In this article by Hui-Chuan Chloe Lee, Hideto Saito, and Ke-Jou Carol Hsu, the authors of the book, Kubernetes Cookbook, we will cover the recipe Monitoring master and node.
(For more resources related to this topic, see here.)
Monitoring master and node
Here comes a new level of view for your Kubernetes cluster. In this recipe, we are going to talk about monitoring. Through monitoring tool, users could not only know the resource consumption of workers, the nodes, but also the pods. It will help us to have a better efficiency on resource utilization.
Getting ready
Before we setup our monitoring cluster in Kubernetes system, there are two main prerequisites:
- One is to update the last version of binary files, which makes sure your cluster has stable and capable functionality
- The other one is to setup the DNS server
A Kubernetes DNS server can reduce some steps and dependency for installing cluster-like pods. In here, it is easier to deploy a monitoring system in Kubernetes with a DNS server.
In Kubernetes, how DNS server gives assistance in large-system deployment?
The DNS server can support to resolve the name of Kubernetes service for every container. Therefore, while running a pod, we don't have to set specific IP of service for connecting to other pods. Containers in a pod just need to know the service's name.
The daemon of node kubelet assign containers the DNS server by modifying the file /etc/resolv.conf. Try to check the file or use the command nslookup for verification after you have installed the DNS server:
# kubectl exec <POD_NAME> [-c <CONTAINER_NAME>] -- cat /etc/resolv.conf

// Check where the service "kubernetes" served

# kubectl exec <POD_NAME> [-c <CONTAINER_NAME>] -- nslookup kubernetes
Update Kubernetes to the latest version: 1.2.1
Updating the version of a running Kubernetes system is not such a trouble duty. You can simply follow the following steps. The procedure is similar to both master and node:
- Since we are going to upgrade every Kubernetes binary file, stop all of the Kubernetes services before you upgrade. For example, service <KUBERNETES_DAEMON> stop.
- Download the latest tarball file: version 1.2.1:
# cd /tmp && wget https://storage.googleapis.com/kubernetes-release/release/v1.2.1/kubernetes.tar.gz
- Decompress the file at a permanent directory. We are going to use the add-on templates provided in official source files. These templates can help to create both DNS server and monitoring system:
// Open the tarball under /opt

# tar -xvf /tmp/kubernetes.tar.gz -C /opt/

// Go further decompression for binary files

# cd /opt && tar -xvf /opt/kubernetes/server/kubernetes-server-linux-amd64.tar.gz
- Copy the new files and overwrite the old ones:
# cd /opt/kubernetes/server/bin/

// For master, you should copy following files and confirm to overwrite

# cp kubectl hypercube kube-apiserver kube-controller-manager kube-scheduler kube-proxy /usr/local/bin

// For nodes, copy the below files

# cp kubelet kube-proxy /usr/local/bin
- Finally, you can now start the system services. It is good to verify the version through the command line:
# kubectl version

Client Version: version.Info{Major:"1", Minor:"2", GitVersion:"v1.2.1", GitCommit:"50809107cd47a1f62da362bccefdd9e6f7076145", GitTreeState:"clean"}

Server Version: version.Info{Major:"1", Minor:"2", GitVersion:"v1.2.1", GitCommit:"50809107cd47a1f62da362bccefdd9e6f7076145", GitTreeState:"clean"}
As a reminder, you should update both master and node at the same time.
Setup DNS server
As mentioned, we will use the official template to build up the DNS server in our Kubernetes system. Two steps only. First, modify templates and create the resources. Then, we need to restart the kubelet daemon with DNS information.
Start the server by template
The add-on files of Kubernetes are located at <KUBERNETES_HOME>/cluster/addons/. According to last step, we can access the add-on files for DNS at /opt/kubernetes/cluster/addons/dns, and two template files are going to be modified and executed. Feel free to depend on the following steps:
- Copy the file from the format .yaml.in to YAML file, and we will edit the copied ones later:
# cp skydns-rc.yaml.in skydns-rc.yaml
|
Input variable
|
Substitute value
|
Example
|
|
{{ pillar['dns_domain'] }}
|
The domain of this cluster
|
k8s.local
|
|
{{ pillar['dns_replicas'] }}
|
The number of relica for this replication controller
|
1
|
|
{{ pillar['dns_server'] }}
|
The private IP of DNS server. Must also be in the CIDR of cluster
|
192.168.0.2
|
# cp skydns-svc.yaml.in skydns-svc.yaml
- In this two templates, replace the pillar variable, which is covered by double big parentheses with the items in this table. As you know, the default service kubernetes will occupy the first IP in CIDR. That's why we use IP 192.168.0.2 for our DNS server:
# kubectl get svc

NAME         CLUSTER-IP    EXTERNAL-IP   PORT(S)   AGE

kubernetes   192.168.0.1   <none>        443/TCP   4d
- In the template for the replication controller, the file named skydns-rc.yaml, specify master URL in the container kube2sky:
# cat skydns-rc.yaml

(Ignore above lines)

:

- name: kube2sky

  image: gcr.io/google_containers/kube2sky:1.14

  resources:

    limits:

      cpu: 100m

      memory: 200Mi

    requests:

      cpu: 100m

      memory: 50Mi

  livenessProbe:

    httpGet:

      path: /healthz

      port: 8080

      scheme: HTTP

    initialDelaySeconds: 60

    timeoutSeconds: 5

    successThreshold: 1

    failureThreshold: 5

  readinessProbe:

    httpGet:

      path: /readiness

      port: 8081

      scheme: HTTP

    initialDelaySeconds: 30

    timeoutSeconds: 5

  args:

  # command = "/kube2sky"

  - --domain=k8s.local

  - --kube-master-url=<MASTER_ENDPOINT_URL>:<EXPOSED_PORT>
:

(Ignore below lines)
After you finish the preceding steps for modification, you just start them using the subcommand create:
# kubectl create -f skydns-svc.yaml

service "kube-dns" created

# kubectl create -f skydns-rc.yaml

replicationcontroller "kube-dns-v11" created
Enable Kubernetes DNS in kubelet
Next, we have to access to each node and add DNS information in the daemon kubelet. The tags we used for cluster DNS are --cluster-dns, which assigns the IP of DNS server, and --cluster-domain, which defines the domain of the Kubernetes services:
Unlock access to the largest independent learning library in Tech for FREE!
Get unlimited access to 7500+ expert-authored eBooks and video courses covering every tech area you can think of.
Renews at $19.99/month. Cancel anytime
// For init service daemon

# cat /etc/init.d/kubernetes-node

(Ignore above lines)

:

# Start daemon.

echo $"Starting kubelet: "

        daemon $kubelet_prog

                --api_servers=<MASTER_ENDPOINT_URL>:<EXPOSED_PORT>

                --v=2

                --cluster-dns=192.168.0.2

                --cluster-domain=k8s.local

                --address=0.0.0.0

                --enable_server

                --hostname_override=${hostname}

                > ${logfile}-kubelet.log 2>&1 &

:

(Ignore below lines)

// Or, for systemd service

# cat /etc/kubernetes/kubelet

(Ignore above lines)

:

# Add your own!

KUBELET_ARGS="--cluster-dns=192.168.0.2 --cluster-domain=k8s.local"
Now, it is good for you to restart either service kubernetes-node or just kubelet! And you can enjoy the cluster with the DNS server.
How to do it…
In this section, we will work on installing a monitoring system and introducing its dashboard. This monitoring system is based on Heapster (https://github.com/kubernetes/heapster), a resource usage collecting and analyzing tool. Heapster communicates with kubelet to get the resource usage of both machine and container. Along with Heapster, we have influxDB (https://influxdata.com) for storage, and Grafana (http://grafana.org) as the frontend dashboard, which visualizes the status of resources in several user-friendly plots.
Install monitoring cluster
If you have gone through the preceding section about the prerequisite DNS server, you must be very familiar with deploying the system with official add-on templates.
- Let's go check the directory cluster-monitoring under <KUBERNETES_HOME>/cluster/addons. There are different environments provided for deploying monitoring cluster. We choose influxdb in this recipe for demonstration:
# cd /opt/kubernetes/cluster/addons/cluster-monitoring/influxdb && ls

grafana-service.yaml      heapster-service.yaml             influxdb-service.yaml

heapster-controller.yaml  influxdb-grafana-controller.yaml
Under this directory, you can see three templates for services and two for replication controllers.
- We will retain most of the service templates as the original ones. Because these templates define the network configurations, it is fine to use the default settings but expose Grafana service:
# cat heapster-service.yaml

apiVersion: v1

kind: Service

metadata:

  name: monitoring-grafana

  namespace: kube-system

  labels:

    kubernetes.io/cluster-service: "true"

    kubernetes.io/name: "Grafana"

spec:

  type: NodePort

  ports:

    - port: 80

      nodePort: 30000

      targetPort: 3000

  selector:

    k8s-app: influxGrafana
As you can find, we expose Grafana service with port 30000. This revision will let us be able to access the dashboard of monitoring from browser.
- On the other hand, the replication controller of Heapster and the one combining influxDB and Grafana require more additional editing to meet our Kubernetes system:
# cat influxdb-grafana-controller.yaml

(Ignored above lines)

:

- image: gcr.io/google_containers/heapster_grafana:v2.6.0-2

          name: grafana

          env:

          resources:

            # keep request = limit to keep this container in guaranteed class

            limits:

              cpu: 100m

              memory: 100Mi

            requests:

              cpu: 100m

              memory: 100Mi

          env:

            # This variable is required to setup templates in Grafana.

            - name: INFLUXDB_SERVICE_URL

              value: http://monitoring-influxdb.kube-system:8086

            - name: GF_AUTH_BASIC_ENABLED

              value: "false"

            - name: GF_AUTH_ANONYMOUS_ENABLED

              value: "true"

            - name: GF_AUTH_ANONYMOUS_ORG_ROLE

              value: Admin

            - name: GF_SERVER_ROOT_URL

              value: /

:

(Ignored below lines)
For the container of Grafana, please change some environment variables. The first one is the URL of influxDB service. Since we set up the DNS server, we don't have to specify the particular IP address. But an extra-postfix domain should be added. It is because the service is created in the namespace kube-system. Without adding this postfix domain, DNS server cannot resolve monitoring-influxdb in the default namespace. Furthermore, the Grafana root URL should be changed to a single slash. Instead of the default URL, the root (/) makes Grafana transfer the correct webpage in the current system.
- In the template of Heapster, we run two Heapster containers in a pod. These two containers use the same image andhave similar settings, but actually, they take to different roles. We just take a look at one of them as an example of modification:
# cat heapster-controller.yaml

(Ignore above lines)

:

      containers:

        - image: gcr.io/google_containers/heapster:v1.0.2

          name: heapster

          resources:

            limits:

              cpu: 100m

              memory: 200Mi

            requests:

              cpu: 100m

              memory: 200Mi

          command:

            - /heapster

            - --source=kubernetes:<MASTER_ENDPOINT_URL>:<EXPOSED_PORT>?inClusterConfig=false

            - --sink=influxdb:http://monitoring-influxdb.kube-system:8086

            - --metric_resolution=60s

:

(Ignore below lines)
At the beginning, remove all double-big-parentheses lines. These lines will cause creation error, since they could not be parsed or considered in the YAML format. Still, there are two input variables that need to be replaced to possible values. Replace {{ metrics_memory }} and {{ eventer_memory }} to 200Mi. The value 200MiB is a guaranteed amount of memory that the container could have. And please change the usage for Kubernetes source. We specify the full access URL and port, and disable ClusterConfig for refraining authentication. Remember to do an adjustment on both the heapster and eventer containers.
- At last, now you can create these items with simple commands:
# kubectl create -f influxdb-service.yaml

service "monitoring-influxdb" created

# kubectl create -f grafana-service.yaml
You have exposed your service on an external port on all nodes in your
If you want to expose this service to the external internet, you may
need to set up firewall rules for the service port(s) (tcp:30000) to serve traffic.
See http://releases.k8s.io/release-1.2/docs/user-guide/services-firewalls.md for more details.
service "monitoring-grafana" created

# kubectl create -f heapster-service.yaml

service "heapster" created

# kubectl create -f influxdb-grafana-controller.yaml

replicationcontroller "monitoring-influxdb-grafana-v3" created

// Because heapster requires the DB server and service to be ready, schedule it as the last one to be created.

# kubectl create -f heapster-controller.yaml

replicationcontroller "heapster-v1.0.2" created
- Check your Kubernetes resources at namespace kube-system:
# kubectl get svc --namespace=kube-system

NAME                  CLUSTER-IP        EXTERNAL-IP   PORT(S)             AGE

heapster              192.168.135.85    <none>        80/TCP              12m

kube-dns              192.168.0.2       <none>        53/UDP,53/TCP       15h

monitoring-grafana    192.168.84.223    nodes         80/TCP              12m

monitoring-influxdb   192.168.116.162   <none>        8083/TCP,8086/TCP   13m

# kubectl get pod --namespace=kube-system

NAME                                   READY     STATUS    RESTARTS   AGE

heapster-v1.0.2-r6oc8                  2/2       Running   0          4m

kube-dns-v11-k81cm                     4/4       Running   0          15h

monitoring-influxdb-grafana-v3-d6pcb   2/2       Running   0          12m
Congratulations! Once you have all the pods in a ready state, let's check the monitoring dashboard.
Introduce Grafana dashboard
At this moment, the Grafana dashboard is available through nodes' endpoints. Please make sure whether node's firewall or security group on AWS have opened port 30000 to your local subnet. Take a look at the dashboard by browser. Type <NODE_ENDPOINT>:30000 in your URL searching bar:
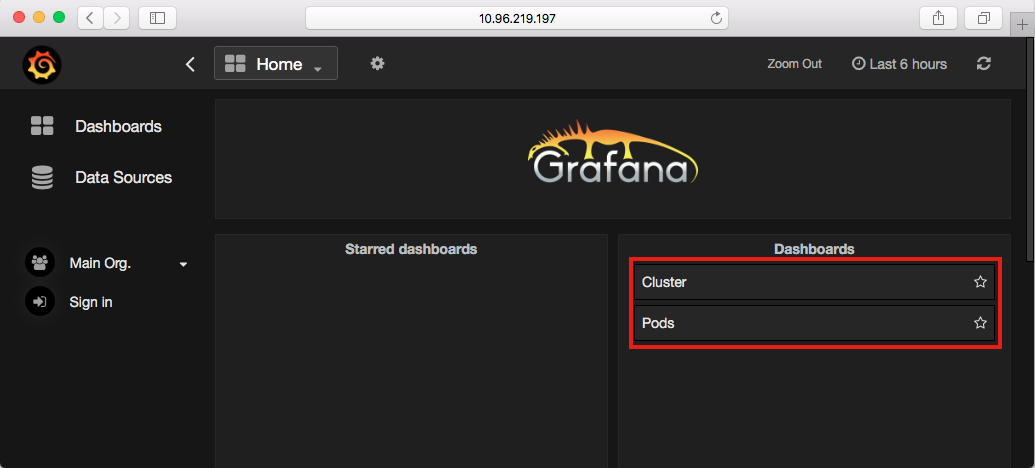
In the default setting, we have Cluster and Pods in these two dashboards. Cluster board covers nodes' resource utilization, such as CPU, memory, network transaction, and storage. Pods dashboard has similar plots for each pod and you can go watching deep into each container in a pod:
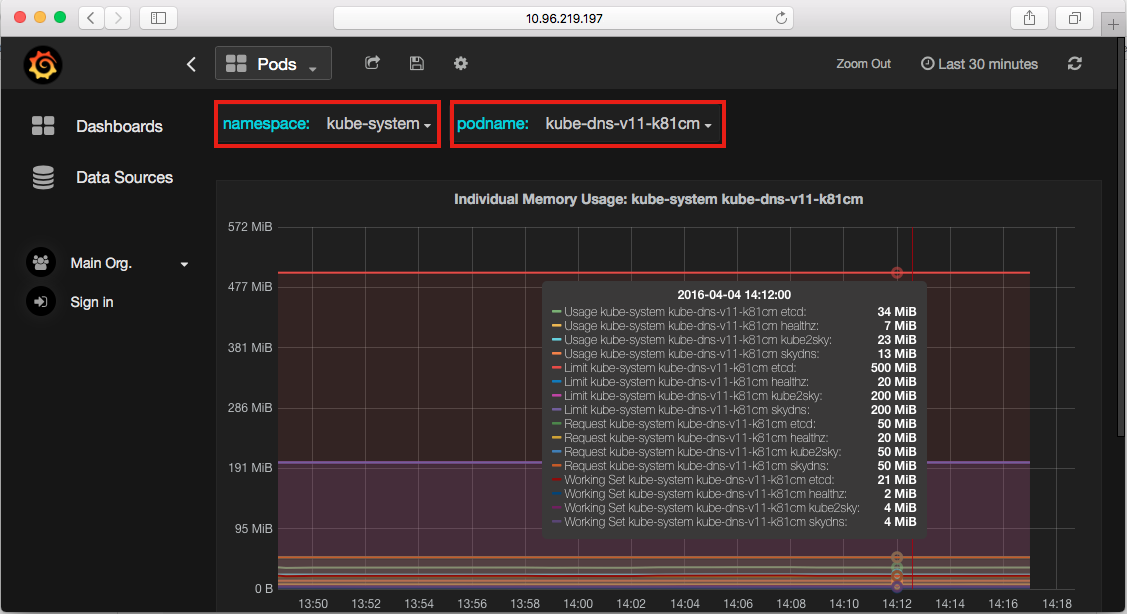
As the previous images show, for example, we can observe the memory utilization of individual containers in the pod kube-dns-v11, which is the cluster of the DNS server. The purple lines in the middle just indicate the limitation we set to the container skydns and kube2sky.
Create a new metric to monitor pod
There are several metrics for monitoring offered by Heapster (https://github.com/kubernetes/heapster/blob/master/docs/storage-schema.md).We are going to show you how to create a customized panel by yourself. Please take the following steps as a reference:
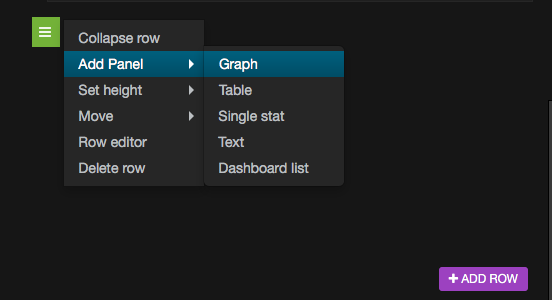
- Go to the Pods dashboard and click on ADD ROW at the bottom of webpage. A green button will show up on the left-hand side. Choose to add a graph panel:
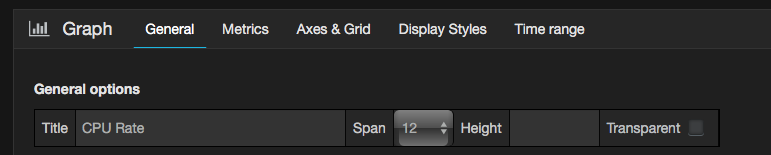
- First, give your panel a name. For example, CPU Rate. We would like to create the one showing the rate of CPU utility:
- Set up the parameters in the query as shown in the following screenshot:
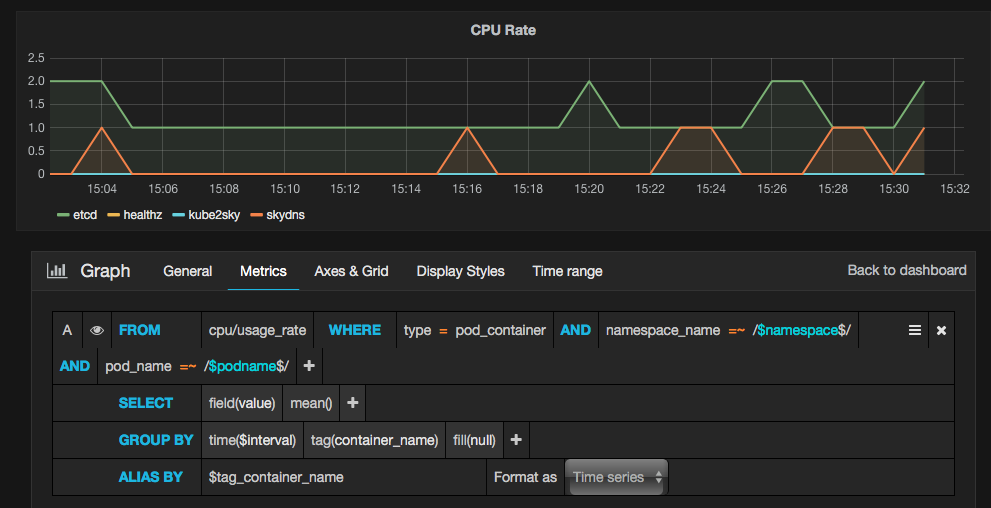
- FROM: For this parameter input cpu/usage_rate
- WHERE: For this parameter set type = pod_container
- AND: Set this parameter with the namespace_name=$namespace, pod_name= $podname value
- GROUP BY: Enter tag(container_name) for this parameter
- ALIAS BY: For this parameter input $tag_container_name
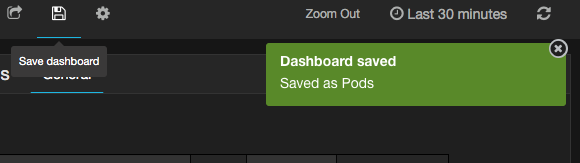
- Good job! You can now save the pod by clicking on the icon at upper bar.
Just try to discover more functionality of the Grafana dashboard and the Heapster monitoring tool. You will get more understanding about your system, services, and containers through the information from the monitoring system.
Summary
This recipe informs you how to monitor your master node and nodes in the Kubernetes system. Kubernetes is a project which keeps moving forward and upgrade at a fast speed. The recommended way for catching up to it is to check out new features on its official website: http://kubernetes.io; also, you can always get new Kubernetes on GitHub: https://github.com/kubernetes/kubernetes/releases. Making your Kubernetes system up to date and learning new features practically is the best method to access the Kubernetes technology continuously.
Resources for Article:
Further resources on this subject:

 United States
 Great Britain
 India
India
 Germany
 France
 Canada
 Russia
 Spain
Spain
 Brazil
 Australia
 Singapore
 Canary Islands
 Hungary
 Ukraine
 Luxembourg
 Estonia
 Lithuania
 South Korea
 Turkey
 Switzerland
 Colombia
 Taiwan
 Chile
Chile
 Norway
 Ecuador
 Indonesia
 New Zealand
 Cyprus
 Denmark
 Finland
 Poland
 Malta
Malta
 Czechia
 Austria
 Sweden
 Italy
Italy
 Egypt
Egypt
 Belgium
 Portugal
 Slovenia
 Ireland
 Romania
 Greece
 Argentina
 Netherlands
 Bulgaria
 Latvia
 South Africa
 Malaysia
 Japan
Japan
 Slovakia
 Philippines
 Mexico
 Thailand