Search icon CANCEL
Subscription
0
Cart icon
Your Cart (0 item)
Close icon
You have no products in your basket yet
Save more on your purchases! discount-offer-chevron-icon
Savings automatically calculated. No voucher code required.
Arrow left icon
Explore Products
Best Sellers
New Releases
Books
Videos
Audiobooks
Learning Hub
Newsletter Hub
Free Learning
Arrow right icon
timer SALE ENDS IN
0 Days
:
00 Hours
:
00 Minutes
:
00 Seconds
Arrow up icon
GO TO TOP
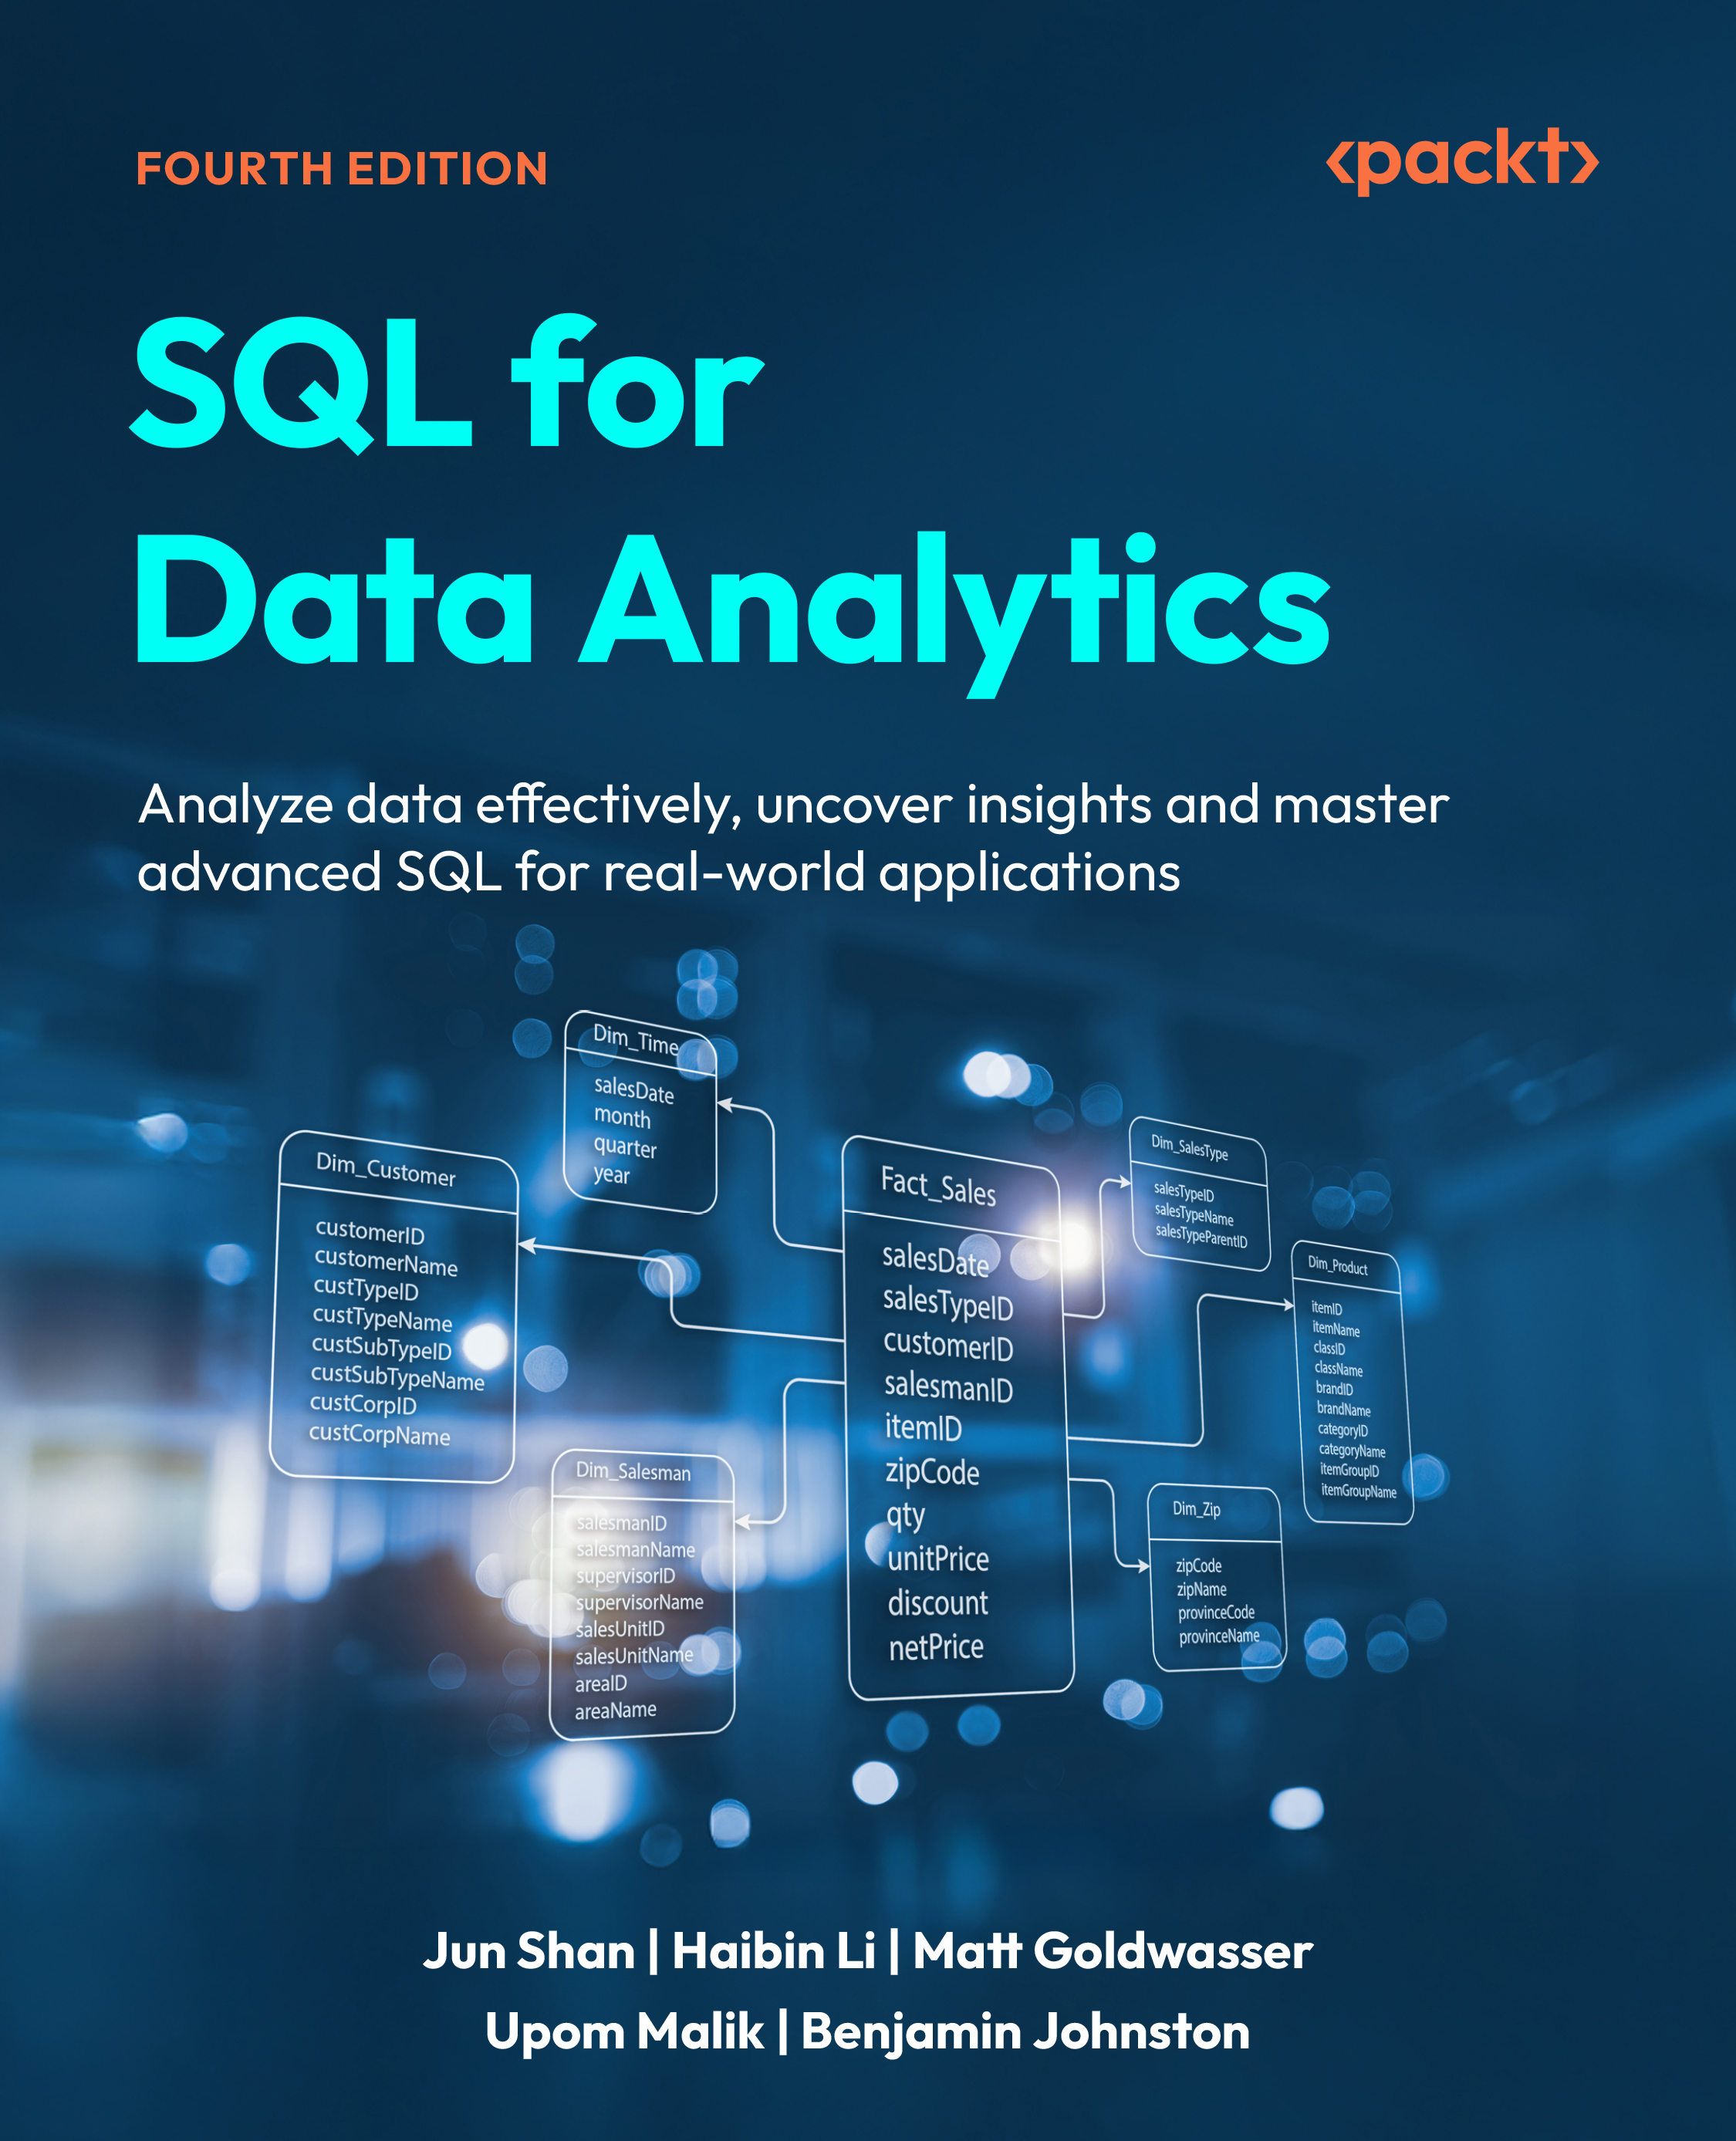
SQL for Data Analytics

You're reading from   SQL for Data Analytics Analyze data effectively, uncover insights and master advanced SQL for real-world applications

Arrow left icon
Product type Paperback
Published in Nov 2025
Publisher Packt
ISBN-13 9781836646259
Length 336 pages
Edition 4th Edition
Languages
Tools
Arrow right icon
Authors (5):
Arrow left icon
Jun Shan Jun Shan
Author Profile Icon Jun Shan
Jun Shan
Benjamin Johnston Benjamin Johnston
Author Profile Icon Benjamin Johnston
Benjamin Johnston
Haibin Li Haibin Li
Author Profile Icon Haibin Li
Haibin Li
Matt Goldwasser Matt Goldwasser
Author Profile Icon Matt Goldwasser
Matt Goldwasser
Upom Malik Upom Malik
Author Profile Icon Upom Malik
Upom Malik
+1 more Show less
Arrow right icon
View More author details
Toc

Table of Contents (21) Chapters Close

Preface 1. Part 1: Data Management Systems
2. Introduction to Data Management Systems FREE CHAPTER 3. Creating Tables with Solid Structures 4. Exchanging Data Using COPY 5. Manipulating Data with Python 6. Part 2: Data Presentation and Manipulation
7. Presenting Data with SELECT 8. Transforming and Updating Data 9. Defining Datasets from Existing Datasets 10. Aggregating Data with GROUP BY 11. Inter-Row Operation with Window Functions 12. Part 3: Advanced Topics on Analytics
13. Performant SQL 14. Processing JSON and Arrays 15. Advanced Data Types: Date, Text, and Geospatial 16. Inferential Statistics Using SQL 17. A Case Study for Analytics Using SQL 18. Unlock Your Exclusive Benefits 19. Other Books You May Enjoy
20. Index

Analyzing correlation and performing regression

Correlation is a statistical measure that quantifies the strength and direction of a linear relationship between two quantitative variables. To understand correlation, it’s helpful to consider variance and covariance. Variance measures the spread or dispersion of a single variable around its mean. Covariance, on the other hand, extends this idea to two variables. It measures the direction of the linear relationship between them, indicating whether they tend to vary together (positive covariance) or in opposite directions (negative covariance). However, the magnitude of covariance is not standardized and depends on the units of the variables, making it difficult to directly interpret the strength of the relationship. This is where correlation becomes useful. The Pearson correlation coefficient (r) can be seen as a standardized version of the covariance. It’s calculated by dividing the covariance of the two variables from...

lock icon The rest of the chapter is locked
Visually different images
CONTINUE READING
83
Tech Concepts
36
Programming languages
73
Tech Tools
Icon Unlimited access to the largest independent learning library in tech of over 8,000 expert-authored tech books and videos.
Icon Innovative learning tools, including AI book assistants, code context explainers, and text-to-speech.
Icon 50+ new titles added per month and exclusive early access to books as they are being written.
SQL for Data Analytics
Register for a free Packt account to unlock a world of extra content!
A free Packt account unlocks extra newsletters, articles, discounted offers, and much more. Start advancing your knowledge today.
Unlock this book and the full library FREE for 7 days
Get unlimited access to 7000+ expert-authored eBooks and videos courses covering every tech area you can think of
Renews at $19.99/month. Cancel anytime
Modal Close icon
Modal Close icon