Getting Started with Zabbix
It's Friday night and you are at a party outside the city with old friends. After a few beers, it looks as if this is going to be a great party, when suddenly your phone rings. A customer can't access some critical server that absolutely has to be available as soon as possible. You try to connect to the server using SSH, only to discover that the customer is right—it can't be accessed.
As driving after those few beers would quite likely lead to an inoperable server for quite some time, you get a taxi—expensive because of the distance (while many modern systems have out-of-band management cards installed that might have helped a bit in such a situation, our hypothetical administrator does not have one available). After arriving at the server room, you find out that some log files have been growing more than usual over the past few weeks and have filled up the hard drive.
While the preceding scenario is very simplistic, something similar has probably happened to most IT workers at one point or another in their careers. Most will have implemented a simple system monitoring and reporting solution soon after that.
We will learn how to set up and configure one such monitoring system—Zabbix. In this very first chapter, we will cover the following topics:
- First steps in monitoring
- Zabbix architecture and choosing the version and repository
- Setting up Zabbix from packages
- Setting up Zabbix from the source
- Configuring the Zabbix frontend
Technical requirements
You will need a server or virtual machine with the option to install CentOS/Red Hat or Debian/Ubuntu.
The first steps in monitoring
Situations similar to the one just described are actually more common than desired. A system fault that had no visible symptoms before is relatively rare. A subsection of UNIX administration horror stories (http://www-uxsup.csx.cam.ac.uk/misc/horror.txt) only containing stories about faults that weren't noticed in time could probably be compiled easily.
As experience shows, problems tend to happen when we are least equipped to solve them. To work with them on our terms, we turn to a class of software commonly referred to as network monitoring software. Such software usually allows us to constantly monitor things happening in a computer network using one or more methods and notify the persons responsible if a metric passes a defined threshold.
One of the first monitoring solutions most administrators implement is a simple shell script invoked from crontab, which checks some basic parameters, such as disk usage, or some service state, such as an Apache server. As the server and monitored parameter count grows, a neat and clean script system starts to grow into a performance-hogging script hairball that costs more time in upkeep than it saves. While the do-it-yourself crowd claims that nobody needs dedicated software for most tasks (monitoring included), most administrators will disagree as soon as they have to add switches, UPSes, routers, IP cameras, and a myriad of other devices to the swarm of monitored objects.
So, what basic functionality can expect from a monitoring solution? Let's take a look:
- Data gathering: This is where everything starts. Usually, data is gathered using various methods, including Simple Network Management Protocol (SNMP), Zabbix agents, Intelligent Platform Management Interface (IPMI), and Java Management Extensions (JMX).
- Data storage: Once we have gathered the data, it doesn't make sense to throw it away, so we will often want to store it for later analysis.
- Alerting: Gathered data can be compared to thresholds and alerts sent out when required using different channels, such as email or SMS.
- Visualization: Humans are better at distinguishing visualized data than raw numbers, especially when there's a lot of data. As we have data already gathered and stored, it is easy to generate simple graphs from it.
Sounds simple? That's because it is. But then we start to want more features, such as easy and efficient configuration, escalations, and permission delegation. If we sit down and start listing the things we want to keep an eye out for, it may turn out that that area of interest extends beyond the network, for example, a hard drive that has Self-Monitoring, Analysis, and Reporting Technology (S.M.A.R.T) errors logged, an application that has too many threads, or a UPS that has one phase overloaded. It is much easier to manage the monitoring of all of these different problem categories from a single configuration point.
In the quest for a manageable monitoring system, wondrous adventurers stumbled upon collections of scripts much like the way they themselves implemented obscure and not-so-obscure workstation-level software and heavy, expensive monitoring systems from big vendors.
Many went with a different category—free software. We will look at a free software monitoring solution, Zabbix.
Zabbix features and architecture
Zabbix provides many ways of monitoring different aspects of your IT infrastructure and, indeed, almost anything you might want to hook up to it. It can be characterized as a semi-distributed monitoring system with centralized management. While many installations have a single central system, it is possible to use distributed monitoring with proxies, and most installations will use Zabbix agents.
What features does Zabbix provide? Let's have a look:
- A centralized, easy to use web interface
- A server that runs on most UNIX-like operating systems, including Linux, AIX, FreeBSD, OpenBSD, and Solaris
- Native agents for most UNIX-like operating systems and Microsoft Windows versions
- The ability to directly monitor SNMP (SNMPv1, SNMPv2c, and SNMPv3) and IPMI devices
- The ability to directly monitor Java applications using JMX
- The ability to directly monitor vCenter or vSphere instances using the VMware API
- Built-in graphing and other visualization capabilities
- Notifications that allow easy integration with other systems
- Flexible configuration, including templating
- Low-Level Discovery (LLD) and the ability to generate items, graphs, and triggers (among others) in an automated way
- A lot of other features that allow you to implement a sophisticated monitoring solution
If we look at a simplified network from the Zabbix perspective, placing the Zabbix server at the center, the communication of the various monitoring aspects matters. The following diagram depicts a relatively simple Zabbix setup with several of the monitoring capabilities used and different device categories connected:

The Zabbix Server directly monitors multiple devices, but a remote location is separated by a firewall, so it is easier to gather data through a Zabbix proxy. The Zabbix proxy and Zabbix agents, just like the server, are written in the C language.
Our central object is the Zabbix database, which supports several backends. The Zabbix server, written in the C language, and the Zabbix web frontend, written in PHP, can both reside on the same machine or on another server. When running each component on a separate machine, both the Zabbix server and the Zabbix web frontend need access to the Zabbix database, and the Zabbix web frontend needs access to the Zabbix server to display the server status and for some additional functionality.
While it is perfectly fine to run all three server components on a single machine, there might be good reasons to separate them, such as taking advantage of an existing high-performance database or web server.
In general, monitored devices have little control over what is monitored—most of the configuration is centralized. Such an approach seriously reduces the ability of a single misconfigured system to bring down the whole monitoring setup.
In the following diagram, we have an overview of the basic Zabbix setup with our Zabbix server, web server and relational database. In our setup, we will install the three components on one machine. It is possible, however, to split up components over three different machines, something we will see later in this book:

Installation
Alright, enough with the dry talk—what use is that? Let's look at the dashboard screen of the Zabbix web frontend, showing only a very basic standard configuration:
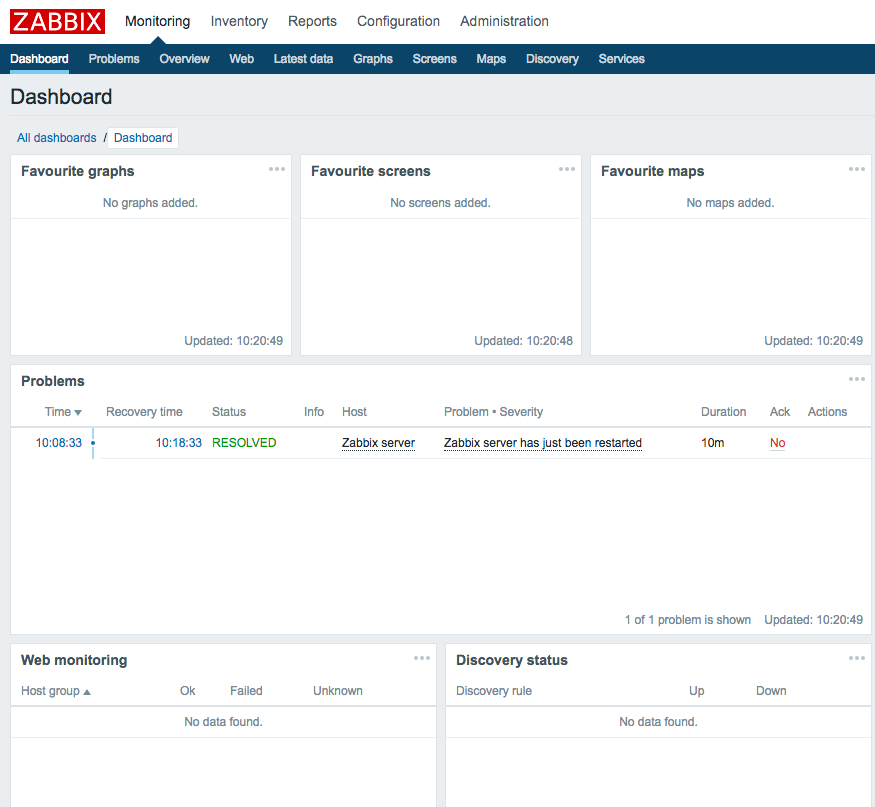
The Zabbix dashboard shows you a high-level overview of the overall status of the monitored system, the status of Zabbix, some of the most recent problems, and a few more things. This particular dashboard shows a very tiny Zabbix setup. Eventually, your Zabbix installation will grow and monitor different devices, including servers of various operating systems, different services and the hardware state on those servers, network devices, UPSes, web pages, other components of IT, and other infrastructure.
The frontend will provide various options for visualizing data, starting from lists of problems and simple graphs and ending with network maps and reports, while the backend will work hard to provide the information that this visualization is based on and send out alerts. All of this will require some configuration that we will learn to perform along the course of this book.
Before we can configure Zabbix, we need to install it. Usually, you'll have two choices—installing from packages or setting it up from the source code. Zabbix packages are available in quite a lot of Linux distribution repositories, and it is usually a safe choice to use those. Additionally, a Zabbix-specific repository is provided by SIA Zabbix (the company developing the product) for some distributions.
Choosing the version and repository
At first, we will set up the Zabbix server, database, and frontend, all running on the same machine and using a MySQL database.
Should you use the packages or install from the source? In most cases, installing from the packages will be easier. Here are a few considerations that might help you select the method:
- There are certain benefits of using distribution packages. These include the following:
- Automated installation and updating
- The dependencies are usually sorted out
- Easy and proper cleanup when uninstalling
- No installation of compilers needed on your systems
- Compiling from source also has its share of benefits. They are as follows:
- You can get newer versions with more features and improvements.
- You have more fine-grained control over compiled-in functionality.
But which version to choose? You might see several versions available in repositories, and those versions might not be equal. Since Zabbix 2.2, the concept of a Long-Term Support (LTS) release has been introduced. This determines how long support in the form of bug fixes will be available for. An LTS release is supported for five years (three years full support and two years limited support), while a normal release is supported until a month after the release date of the next version. Zabbix 2.2 and 3.0 are LTS releases, while 2.4, 3.2, and 3.4 are normal releases. Choose an LTS release for an installation that you don't plan to upgrade for a setup where you want vendor (Zabbix SIA) support. A normal release can be used for a setup you intend to keep up-to-date. In this book, we will use the latest LTS release Zabbix version 4.0.
This policy might change. Verify the details on the Zabbix website: http://www.zabbix.com/life_cycle_and_release_policy.php.
The most widely used Zabbix architecture is a server that queries agents. This is what we will learn to set up initially so that we can monitor our test system.
As with most software, there are some prerequisites that we will need in order to run Zabbix components. These include requirements of hardware and other software that the Zabbix server and agent depend on. For the purpose of our installation, we will settle for running Zabbix on Linux, using a MySQL database. The specific Linux distribution does not matter much—it's best to choose the one you are most familiar with.
Hardware requirements
Hardware requirements vary wildly depending on the configuration. It is impossible to provide definite requirements, so any production installation should evaluate them individually. For our test environment, though, even as little RAM as 128 MB should be enough. CPU power in general won't play a huge role; Pentium II-class hardware should be perfectly capable of dealing with it, although generating graphs with many elements or other complex views could require more powerful hardware to operate at an acceptable speed. You can take these as a starting point as well when installing on a virtual machine.
Of course, the more resources you give to Zabbix, the snappier and happier it will be.
Installing from the packages
If you have decided to install Zabbix from the packages, package availability and the procedure will differ based on the distribution. A few distributions will be covered here—read the distribution-specific instructions for others. For the installation, we need root rights.
Red Hat Enterprise Linux (RHEL)/CentOS
RHEL or CentOS users have two repositories to choose from: the well-known Extra Packages for Enterprise Linux (EPEL) and the Zabbix repository. EPEL might be a safer choice, but it might not always have the latest version. (In fact, at the time of writing, the latest version in EPEL was still 3.0.22, so it's possible that 4.0 will not be available in EPEL). In production, most of the time you will encounter setups with Security-Enhanced Linux (SELinux) enabled. However, SELinux is rather complex on its own, so it's out of the scope of this book; please disable SELinux before you start with the installation of Zabbix. If you have no clue how to do so, this can be done by editing the /etc/selinux/config file and putting disable or permissive instead of enabled. Don't forget to reboot afterwards so that changes are applied to the system. You can verify the status with the getenforce command.
EPEL
If EPEL is not set up already, it must be added. For RHEL/CentOS 7, the command is similar to this:
# rpm -Uvh http://ftp.colocall.net/pub/epel/7/x86_64/e/epel-release-7-5.noarch.rpm
For CentOS7 only, run the following command:
# yum install epel-release
If you would like to check the available Zabbix versions in EPEL, it is possible with the next command:
# yum --disablerepo="*" --enablerepo="epel" search zabbix
Once the repository has been set up, you may install the packages (except the following is for 3.0 not for 4.0 as it was not available when this book was written):
# yum install zabbix30-agent zabbix30-dbfiles-mysql zabbix30-server-mysql zabbix30-web-mysql
The Zabbix repository
First, the package that will define that the Zabbix repository should be installed:
# rpm -ivh http://repo.zabbix.com/zabbix/4.0/rhel/7/x86_64/zabbix-release-4.0-1.el7.noarch.rpm
Once the repository has been set up, you may install the packages:
# yum install zabbix-server-mysql zabbix-web-mysql zabbix-agent
Ubuntu/Debian
Zabbix has repositories available for Debian and Ubuntu just as it does for CentOS/Red Hat, so both are equally supported. Just be aware that Zabbix SIA has a slight preference lately for CentOS/Red Hat, and that this is the preferred OS for their training as well, but both are equally supported and tested:
# For Ubuntu 18.04
# wget https://repo.zabbix.com/zabbix/4.0/ubuntu/pool/main/z/zabbix-release/zabbix-release_4.0-1+bionic_all.deb

# For Debian 9
# wget https://repo.zabbix.com/zabbix/4.0/debian/pool/main/z/zabbix-release/zabbix-release_4.0-1+stretch_all.deb
# dpkg -i zabbix-release_4.0-1+bionic_all.deb
Once the repository has been set up, you may want to update the cache and install the packages, as follows:
# apt update
# add-apt-repository universe # (This is needed
                              # for package
                              # like fping ...)
# apt install zabbix-server-mysql zabbix-agent zabbix-frontend-php
Installing from source
If you have decided to install Zabbix from the source, you will need to obtain the source, configure it, and compile it. After the daemons are put in place, the frontend will have to be set up manually as well.
The server and agent
At first, we will only set up the Zabbix server and agent, both running on the same system. We will set up additional components later during the course of this book.
Software requirements
Now, we should get to compiling the various components of Zabbix, so make sure to install the minimum required packages to get Zabbix working with MySQL. Here they are:
- GCC
- Automake
- MariaDB (or any compatible MySQL DB)
Depending on your distribution and the desired functionality, you might also need some or all of the following packages:
- zlib-devel
- mariadb-devel (for MySQL support)
- glibc-devel
- curl-devel (for web monitoring)
- libidn-devel (curl-devel might depend on it)
- openssl-devel (curl-devel might depend on it)
- net-snmp-devel (for SNMP support)
- popt-devel (net-snmp-devel might depend on it)
- rpm-devel (net-snmp-devel might depend on it)
- OpenIPMI-devel (for IPMI support)
- libssh2-devel (for direct SSH checks)
- libxm2-devel (for VMware monitoring)
- unixODBC-devel (for database monitoring)
- Java SDK (for Java gateway/JMX checks)
Downloading the source
There are several ways of downloading the source code of Zabbix. You can get it from a Subversion (SVN) repository, which will be discussed in Appendix B, Being part of the Community; however, for this installation procedure, I suggest you download version 4.0.0 from the Zabbix home page, https://www.zabbix.com/. While it should be possible to use the latest stable version, using 4.0.0 will allow you to follow instructions more closely. Go to the Download section and grab the compressed source package. Usually, only the latest stable version is available on the download page, so you might have to browse the source archives, but do not take a development or beta version, which might be available.
To make further references easy, I suggested you choose a directory to work in, for example, ~/zabbix (~ being your home directory). Download the archive into this directory.
Compilation
Once the archive has finished downloading, open a Terminal and extract it:
$ cd ~/zabbix; tar -zxvf zabbix-4.0.0.tar.gz
I suggest you install the prerequisites and compile Zabbix with external functionality right away so that you don't have to recompile as we progress.
For the purpose of this book, we will compile Zabbix with server, agent, MySQL, CURL, SNMP, SSH, ODBC, XML (VMware), and IPMI support.
To continue, enter the following in the Terminal:
$ cd zabbix-4.0.0
$ ./configure --enable-server --with-mysql --with-net-snmp --with-libcurl --with-openipmi --enable-agent --with-libxml2 --with-unixodbc --with-ssh2 --with-openssl
In the end, a summary of the compiled components will be printed. Verify that you have the following enabled:
 Enable server:         yes
 Server details:
 With database:         MySQL
 WEB Monitoring:        CURL
 SNMP:                  yes
 IPMI:                  yes
 SSH:                   yes
 TLS:                   OpenSSL
 ODBC:                  yes
 Enable agent:          yes
If the configuration completes successfully, it's all good. If it fails, check the error messages printed in the console and verify that all prerequisites have been installed. A file named config.log might provide more detail about the errors. If you can't find out what's wrong, check Appendix A, Troubleshooting, which lists some common compilation problems.
To actually compile Zabbix, issue the following command:
$ make
You can grab a cup of tea, but don't expect to have much time—Zabbix compilation doesn't take too long; even an old 350-MHz Pentium II compiles it in approximately five minutes. On a modern machine, give it less than a minute. After the make process has finished, check the last lines for any error messages. If there are none, congratulations—you have successfully compiled Zabbix!
Now, we should install it. I suggest you create proper packages, but that will require some effort and will be distribution dependent. Another option is to run make install. This will place the files in the filesystem but will not register Zabbix as an installed package—removing and upgrading such software is harder.
If you have experience with creating distribution packages, do so—it is a better approach. If this is just a test installation, run the following:
# make install
But remember that test installations have a tendency of becoming production installations later—it might be a good idea to do things properly from the very beginning.
Dash or underscore
Depending on the method of installation, you might get Zabbix binaries and configuration files using either a dash (minus) or an underscore, as in the following:
- zabbix_server versus zabbix-server
- zabbix_agentd versus zabbix-agentd
- zabbix_server.conf versus zabbix-server.conf
While Zabbix itself uses an underscore, many distributions will replace it with a dash to follow their own guidelines. There is no functional difference; you just have to keep in mind the character that your installation uses. In this book, we will reference binaries and files using an underscore.
Initial configuration
After compilation or installation from the package, we have to configure some basic parameters for the server and agent. Default configuration files are provided with Zabbix. The location of these files will depend on the installation method you chose:
- Source installation: /usr/local/etc
- RHEL/CentOS/Debian/Ubuntu package installation: /etc
On other distributions, the files might be located in a different directory. In this book, we will reference binaries and configuration files using relative names, except in situations where the absolute path is recommended or required.
To configure the Zabbix agent, we don't have to do anything. The default configuration will do just fine for now. That was easy, right?
For the server, we will need to make some changes. Open the zabbix_server.conf file in your favorite editor (you will need to edit it as the root user) and find the following entries in the file:
- DBName
- DBUser
- DBPassword
DBName should be zabbix by default; we can leave it as is. DBUser is set to root, and we don't like that, so let's change it to zabbix. For DBPassword, choose any password. You won't have to remember it, so be creative.
In UNIX-like solutions, a hash character or # at the beginning of a line usually means that the line is commented out. Make sure not to start lines you want to have an effect with a hash.
Creating and populating the database
For the Zabbix server to store the data, we need a database. As we have installed our Zabbix server with MySQL support, we need to install the MySQL server first. You will see that we install MariaDB instead of MySQL. This is because now most distributions prefer to deliver MariaDB instead of MySQL as MySQL was acquired by Oracle and people were afraid Oracle would change the license. Zabbix also has support for other databases, such as Oracle, IBM DB2, and PostgreSQL. The reason we use MySQL is because it's the most widely known and also the preferred database by Zabbix SIA. This does not mean other solutions are worse or less tested. It's just because the best knowledge in Zabbix SIA is with MySQL and not PostgreSQL or any other supported database:
CentOS/Red Hat 7
# yum install mariadb-server

Ubuntu/Debian
# apt install mysql-server
We also have to create a database. Start a MySQL client to connect to the MySQL Server:
CentOS/Red Hat 7  Start the database first and set a DB root password
# systemctl start mariadb; systemctl enable mariadb
# mysql_secure_installation
# mysql -u root -p

Ubuntu/Debian Start the database first and set a DB root password
# mysql_secure_installation
# mysql -u root -p
Using mysql_secure_installation is easy to set a root password for your database. It also allows you to configure MySQL/MariaDB easy in a more secure way.
Enter the root user's password for MySQL (you will have set this during the installation of MariaDB or the password could be something that is the default for your distribution). If you do not know the password, you can try omitting -p. This switch will tell the client to attempt to connect without a password (or with an empty password).
If you are using MySQL Community Edition from the packages and the version is 5.7.6 or higher, it generates a random password that is stored in logfiles. Check out the MySQL documentation at http://dev.mysql.com/doc/refman/5.7/en/linux-installation-rpm.html for more details.
Now, let's create the database. Add the user through which Zabbix will connect to the database and grant the necessary permissions to this user:
mysql> create database zabbix character set utf8 collate utf8_bin;
Query OK, 1 row affected (0.01 sec)
mysql> grant all privileges on zabbix.* to 'zabbix'@'localhost' identified by 'mycreativepassword';
Query OK, 0 rows affected (0.12 sec)
Use the password you set in the zabbix_server.conf file instead of mycreativepassword.
Quit the MySQL client by entering the following command:
mysql> quit
Let's populate the newly created database with a Zabbix schema and initial data. The following commands refer to the files as they appear in the Zabbix source. When installing from packages, this file could be located in a directory such as /usr/share/doc/zabbix-server-mysql-4.0.0/ or /usr/share/zabbix-server-mysql:
# zcat /usr/share/doc/zabbix-server-mysql*/create.sql.gz | mysql -uzabbix -p zabbix
This processes should complete without any messages. If there are any errors, review the messages, fix the issue, and retry the failed operation. If the import is interrupted in the middle of the process, you might have to clear the database—the easiest way to do this is to delete the database by typing this:
mysql> drop database zabbix;
Query OK, 0 rows affected (0.00 sec)
By now, we should have the Zabbix server and agent installed and ready to start.
Starting up
You should never start the Zabbix server or agent as root, which is common sense for most daemon processes. If you installed Zabbix from distribution packages, system users should have been created already—if not, let's create a new user to run these processes. You can use tools provided by your distribution or use the most widely available command, useradd, which we need to execute as root:
# useradd -m -s /bin/bash zabbix
For production systems, consider using different user accounts for the Zabbix server and agent. Otherwise, users with configuration rights will be able to discover Zabbix database credentials by instructing the agent to read the server configuration file. Some distribution packages, such as the EPEL and OpenSUSE ones, already use a separate user account called zabbixsrv or zabbixs by default.
This will create a user named zabbix with a home directory in the default location, /home/zabbix usually, and a shell at /bin/bash.
If you installed from source, let's try the direct approach—running the binaries. The location of the binaries will depend on the chosen method of installation. Installing from the source without any extra parameters will place the agent and server binaries in /usr/local/sbin; distribution packages are likely to place them in /usr/sbin. Assuming they are in your path, you can determine where the binaries are by running this:
# which zabbix_server
This will show something similar to the following:
/usr/sbin/zabbix_server
Alternatively, the whereis command can also list configuration and other related files:
# whereis zabbix_server
This would likely list the binary, configuration file, and main page:
zabbix_server: /usr/sbin/zabbix_server /usr/local/etc/zabbix_server.conf /usr/share/man/man3/zabbix_server
Once you know the exact location of the binaries, execute the following as the root user:
# <path>/zabbix_agentd
This will start the Zabbix agent daemon, which should start up silently and daemonize. If the command produces errors, resolve them before proceeding. If it succeeds, continue by starting the Zabbix server:
# <path>/zabbix_server
If you installed from the packages, execute this:
# systemctl start zabbix-agent
# systemctl start zabbix-server
Feel free to experiment with other parameters, such as stop and restart—it should be obvious what these two do.
You can verify whether services are running with the status parameter. For a service that is not running, you would get the following:
# systemctl status zabbix-server
A running service would yield the following:
zabbix-server.service - Zabbix Server
Loaded: loaded (/usr/lib/systemd/system/zabbix-server.service; disabled; vendor preset: disabled)
Active: active (running) since Sun 2018-08-05 12:57:13 CEST; 1min 39s ago
Process: 1972 ExecStart=/usr/sbin/zabbix_server -c $CONFFILE (code=exited, status=0/SUCCESS)
Main PID: 1974 (zabbix_server)
CGroup: /system.slice/zabbix-server.service
├─1974 /usr/sbin/zabbix_server -c /etc/zabbix/zabbix_server.conf
├─1979 /usr/sbin/zabbix_server: configuration syncer [synced
configuration in 0.008373 sec, idle 60 sec]
....
While it's nice to have Zabbix processes running, it's hardly a process one expects to do manually upon each system boot, so the server and agent should be added to your system's startup sequence. This is fairly distribution specific, so all possible variations can't be discussed here. With RHEL or CentOS, a command such as this should help:
# systemctl enable zabbix-agent
# systemctl enable zabbix-server
This will add both services to be started at boot time.
A nice summary of Systemd can be found at https://fedoraproject.org/wiki/SysVinit_to_Systemd_Cheatsheet.
Verifying the service's state
While the systemd method is a nice way to check a service's state for some distributions, it's not available everywhere and isn't always enough. Sometimes, you might want to use these other methods to check whether the Zabbix server or agent is running:
- Checking running processes: The most common method to check whether a particular process is running is by looking at the running processes. You can verify whether the Zabbix agent daemon processes are actually running using this command:
$ ps -C zabbix_agentd
- Output from the ss command: Sometimes, an agent daemon might start up but fail to bind to the port or the port might be used by some other process. You can verify whether some other process is listening on the Zabbix port or whether the Zabbix agent daemon is listening on the correct port by issuing this command:
# ss -tlnp
Process names won't be printed for other users' processes unless you are the root user. In the output, look for a line similar to this:
State  Recv-Q Send-Q Local Address:Port Peer Address:Port
LISTEN  0     128    *:10050            *:* users:(("zabbix_agentd",pid=1965,fd=4),("zabbix_agentd",pid=1964,fd=4),("zabbix_agentd",pid=1963,fd=4),
...
LISTEN  0     128   *:10051             *:* users:(("zabbix_server",pid=2011,fd=5),("zabbix_server",pid=2010,fd=5),("zabbix_server",pid=2009,fd=5),
...
LISTEN  0     50   *:3306               *:* users:(("mysqld",pid=1832,fd=14))
LISTEN 0 128 *:22 *:* users:(("sshd",pid=1033,fd=3))
LISTEN  0     100   127.0.0.1:25        *:* users:(("master",pid=1278,fd=13))
LISTEN 0 128 :::10050 :::* users:(("zabbix_agentd",pid=1965,fd=5),
...
LISTEN  0     128   :::10051            :::* users:(("zabbix_server",pid=2011,fd=6),("zabbix_server",pid=2010,fd=6),("zabbix_server",pid=2009,fd=6),
...
LISTEN  0     128    :::22              :::* users:(("sshd",pid=1033,fd=4))
LISTEN 0 100 ::1:25 :::* users:(("master",pid=1278,fd=14))
This indicates that the zabbix_agentd process is running and listening on all addresses on port 10050—just what we need.
- Telnetting to the port: Even when a service starts up and successfully binds to a port, there might be some connectivity issues, perhaps due to a local firewall. To quickly check connectivity on the desired port, you can try this:
$ telnet localhost 10050
This command should open a connection to the Zabbix agent daemon, and the daemon should not close the connection immediately. All of this applies to the Zabbix server as well, except that it uses a different port by default: 10051.
On CentOS, it is possible that telnet will not work—that's because we have to install it first. This can be done by running the following:
# yum install telnet
The web frontend
Now that we have the Zabbix server and agent either compiled and installed or installed from the distribution packages, and both daemons are running, you probably have a feeling that something's missing. We have only configured some low-level behavior, so where's the meat?
That's what the frontend is for. While, in theory, Zabbix can have multiple frontends, the only one with full functionality so far is the Zabbix web frontend, which is written in PHP. We have to set it up to configure Zabbix and get to those nice graphs everybody likes.
Prerequisites and setting up the environment
Of course, being a Zabbix web frontend, it will require a platform to run on—a web server with a PHP environment. We will need the following installed:
- A web server that is supported by PHP; Apache is the most common choice
- PHP version 5.4.0 or higher
In the next code block, we will show you how to install the webserver on CentOS and Debian:
On CentOS
# yum install httpd php php-ldap php-mysql
# systemctl enable httpd
# systemct start httpd

On Debian/Ubuntu
# apt install apache2 php php7.2-cli php7.2-mysql php7.2-common php7.2-curl php7.2-json php7.2-cgi libapache2-mod-php7.2 php7.2 php7.2-ldap
It is easiest to install these from the distribution packages as it will take care of all of the dependencies we need. Just make sure you install the correct PHP connector for your database—in our case, this is php-mysql. If you would like to make a connection to your AD/LDAP, you also need to make sure that php-ldap is installed.
Once you have all of these installed, it's time to set up the frontend. Again, there's a choice of using packages or installing from source. If you decided to go with the packages, you should have the frontend installed already and should be able to proceed with the configuration wizard section explained next. If you went with the source installation, it's just a simple copying of some files.
First, you have to decide where the frontend code has to go. Most distributions that package web servers use /srv/www/htdocs or /var/www. If you compiled the Apache web server from the source, it would be /usr/local/apache2/htdocs (unless you manually changed the prefix or installed an older Apache version). We will place the frontend in a simple subdirectory, zabbix.
Assuming you have Apache distribution packages installed with the web root directory at /srv/www/htdocs, placing the frontend where it is needed is as simple as executing the following as the root user:
# cp -r frontends/php /srv/www/htdocs/zabbix
The last thing we need to do is open our firewall so that our browser can connect on the web server port of our server:
CentOS/Red Hat
# firewall-cmd --add-service=http --permanent
# firewall-cmd --reload

Debian / Ubuntu
(standard there is no firewall installed you could use iptables or ufw or similar solution)
 # apt install firewalld
Using the web frontend configuration wizard
The web frontend has a wizard that helps you to configure its basics. Let's go through the simple steps it offers.
It's time to fire up a browser and navigate to Zabbix's address: http://<server_ip_or_name>/zabbix. It should work just fine in the latest versions of most browsers, including Firefox, Chrome, Safari, Opera, Konqueror, and Internet Explorer.
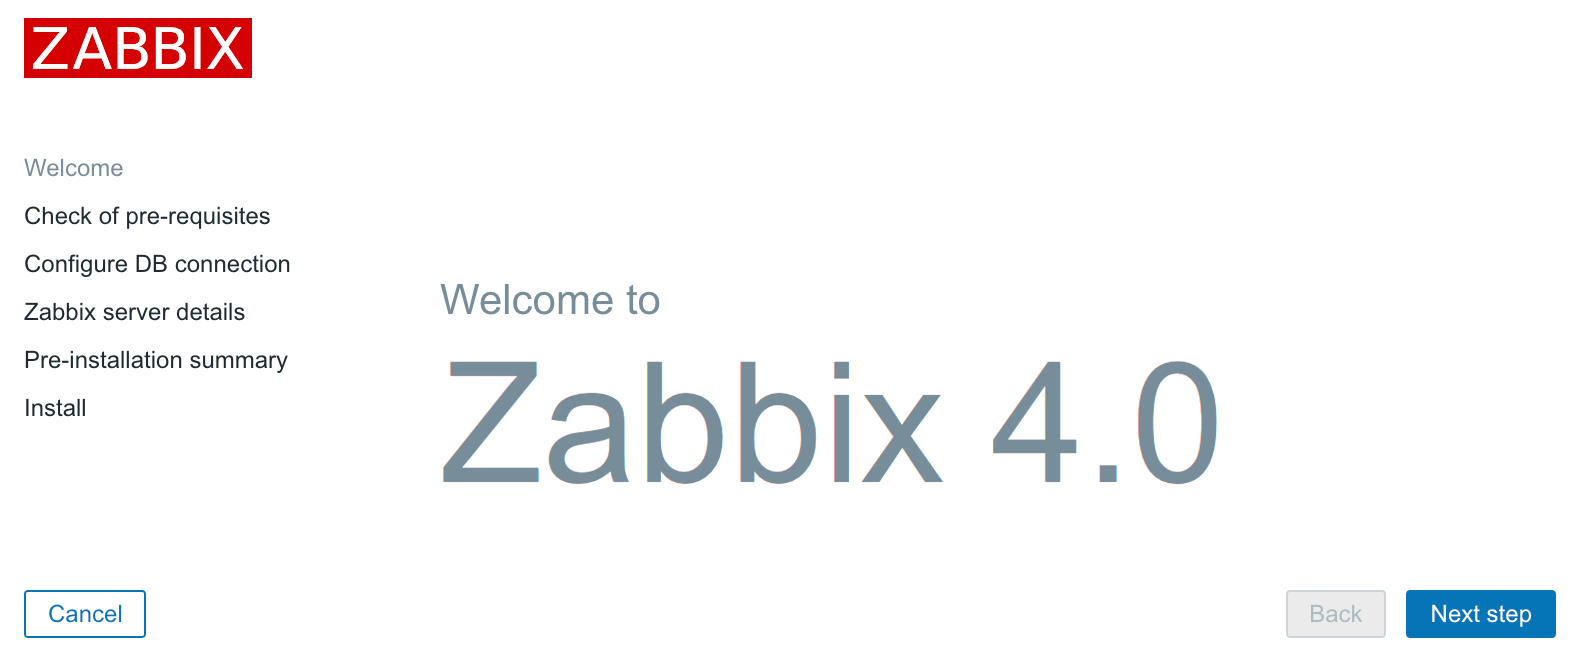
Step 1 – welcome
If everything has been configured properly, you should be greeted by the installation wizard:
If you are not, there are several things that could have gone wrong. If the connection fails completely, make sure Apache is started up and there is no firewall blocking access. If you see a blank page or some PHP code, make sure that PHP is properly installed and configured to parse files ending with the .php extension through the AddType application/x-httpd-php directive. If you see a file and directory listing instead of the installation wizard, make sure you have added index.php to the DirectoryIndex directive. If these hints do not help, check the PHP documentation at https://secure.php.net/manual/en/.
This screen doesn't offer us much to configure, so just click on Next step.
Step 2 – PHP prerequisites
In this step, the installation wizard checks PHP-related prerequisites. If you are lucky, all will have been satisfied, and you will be greeted with all green entries:
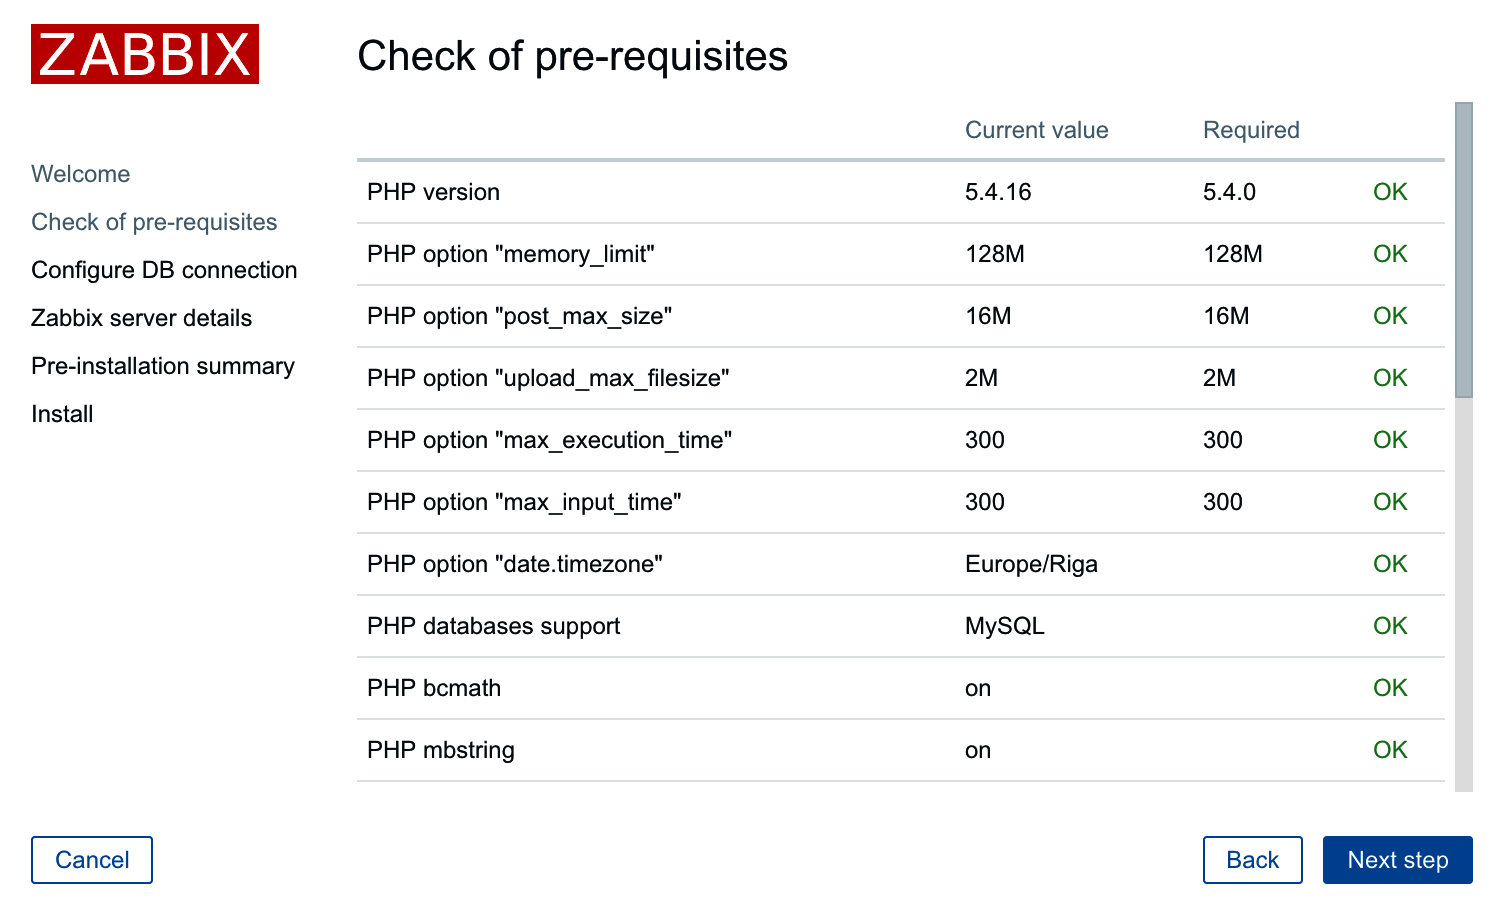
If so, just click on the Next step button to continue to Step 3 – database access.
However, more often than not, one or more entries will have a red Fail warning listed next to them. This is where things get more interesting. Problems at this point fall into two categories—PHP installation or configuration.
Entries such as PHP version, PHP databases support, PHP bcmath, PHP mbstring, PHP gd, PHP gd PNG/JPEG/FreeType support, and others that are not listed as an option are PHP installation problems. To solve these, either install the appropriate distribution packages (sometimes called php5-bcmath, php5-gd, php5-mysql, and so on), or recompile PHP with the corresponding options.
PHP option "memory_limit", PHP option "post_max_size", PHP option "upload_max_filesize", PHP option "max_execution_time", PHP option "max_input_time", and PHP time zone are configuration issues that are all set in the php.ini configuration file. This file is usually located at /etc/php5 or similar for distribution packages and /usr/local/lib for PHP source installations. Set the following options:
max_execution_time 300
memory_limit 128M
post_max_size 16M
upload_max_filesize 2M
max_input_time 300
always_populate_raw_post_data -1
date.timezone Europe/Riga
For the time zone, set the date.timezone option to a time zone that best matches your environment. The default for Zabbix is Europe/Riga, and you can see valid options at http://www.php.net/manual/en/timezones.php.
Make sure you restart Apache after changing the PHP configuration file. If you can't find php.ini, or you make changes but the installation wizard does not pick them up, create a file named test.php in the htdocs directory with only this content:
<?php phpinfo() ?>
Navigate to this file using your browser and check the value for a Configuration File (php.ini) Path entry—this is where you should look for php.ini.
Once everything is fixed, click on the Next step button to continue.
If you install from packages then you only have to edit the zabbix config file in your web server's config folder and after applying the correct changes restart your web server:
CentOS/Red Hat
# /etc/httpd/conf.d/zabbix.conf
Debian/Ubuntu
#/etc/apache2/conf-enabled/zabbix.conf
Step 3 – database access
Remember the database we created earlier? That's the information we'll supply here:

We already configured database credentials for the Zabbix server, but the Zabbix frontend uses a different configuration file. The default Database type, Database host, and Database port values should work for us. Set both Database name and User to zabbix. If you have forgotten the password, just look it up or copy it from zabbix_server.conf. After entering the data, click on the Next step button. If all of the information is correct, the wizard should proceed to the next step.
Step 4 – Zabbix server details
The next screen lets you specify the Zabbix server's location:
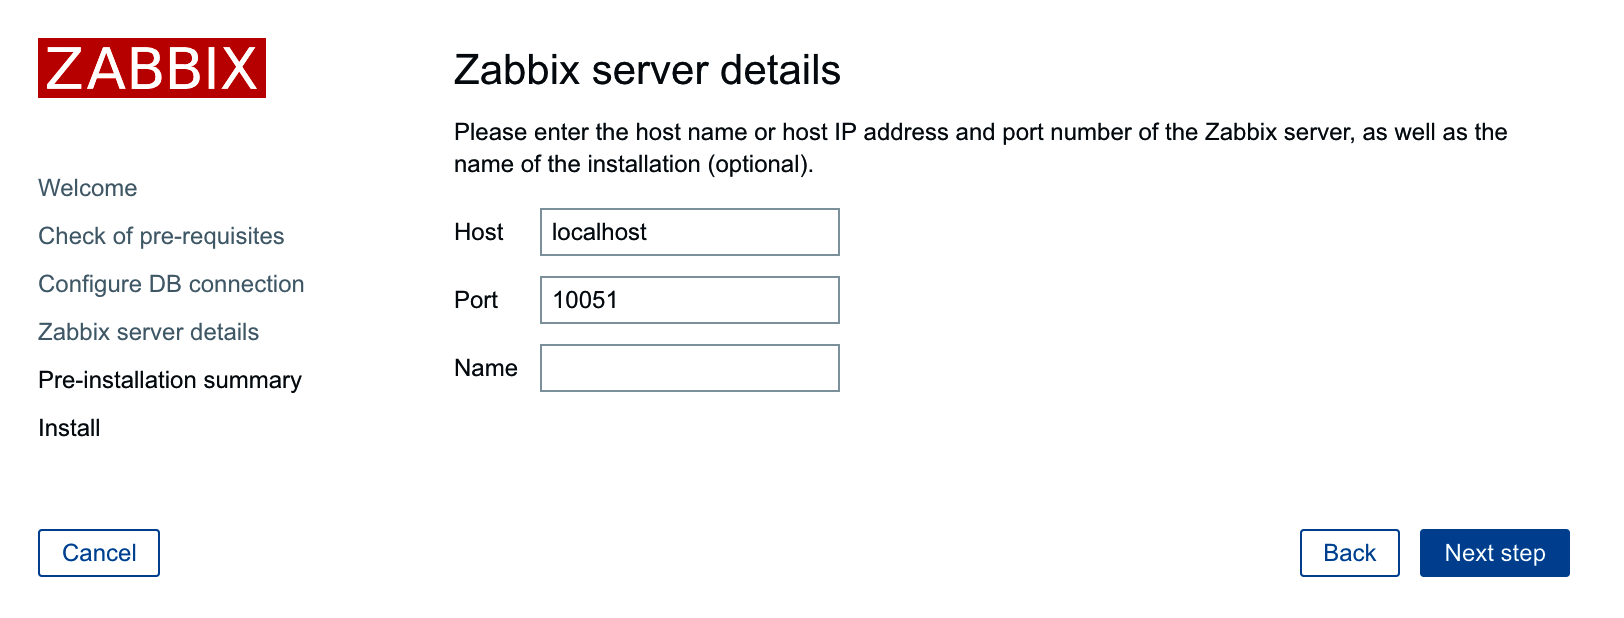
The defaults for the host and port are suitable for us, but we could benefit from filling in the Name field. The contents of this field will be used for page titles and a label in the upper-right corner of the Zabbix interface—this could be really handy if we had multiple Zabbix installations. Feel free to enter any name here, but for this book, we'll call the server Zabbix One. When you're done, it's over to the Next step again. The next screen is a summary of the choices made in the previous screens.
Step 5 – summary
If you left the defaults where appropriate and your database connection test was successful, it should be safe to continue by clicking on Next step:

Step 6 – writing the configuration file
It is quite likely that in the next screen, you will be greeted with failure:
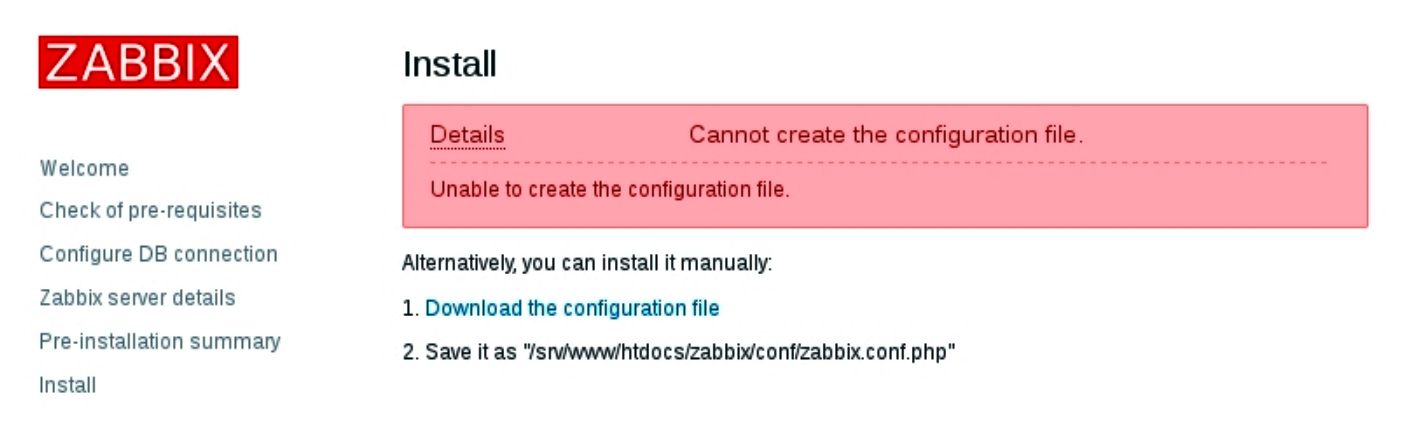
The installation wizard attempted to save the configuration file, but with the access rights that it has, it should not be possible. Previous versions of Zabbix explained two alternatives for proceeding. Unfortunately, Zabbix 4.0 has lost the explanation for one of those. The two possible solutions are as follows:
- Click on Download the configuration file and manually place this file in the htdocs/zabbix/conf directory.
- Make the htdocs/zabbix/conf directory writable by the web server user (execute as root). Use these commands:
    # chown <username> /path/to/htdocs/zabbix/conf
    # chmod 700 /path/to/htdocs/zabbix/conf
Obviously, we need to insert the correct username and directory in these commands. Remember, common locations are /var/www/html and /usr/local/apache2/htdocs—use the one you copied the Zabbix frontend code to. Common users are wwwrun, www-data, nobody, and daemon—you can find out which one the correct user is for your system by running this:
$ ps aux | grep http
You could also run this:
$ ps aux | grep apache
The username that most httpd processes are running under will be the correct one. Once the permissions have been changed, click on Finish. That should successfully save the configuration file.
It is suggested that you restrict the permissions on this file afterwards to be readable only by the web server user, by issuing these commands as root:
# chmod 440 /path/to/htdocs/zabbix/conf/zabbix.conf.php
# chown root /path/to/htdocs/zabbix/conf/
The file contains the database password, which is best kept secret.
Step 7 – finishing the wizard
Congratulations, this is the last wizard screen, which only wants you to be friendly to it and press Finish:

Step 8 – logging in
Immediately after clicking on Finish, you should see a login form:
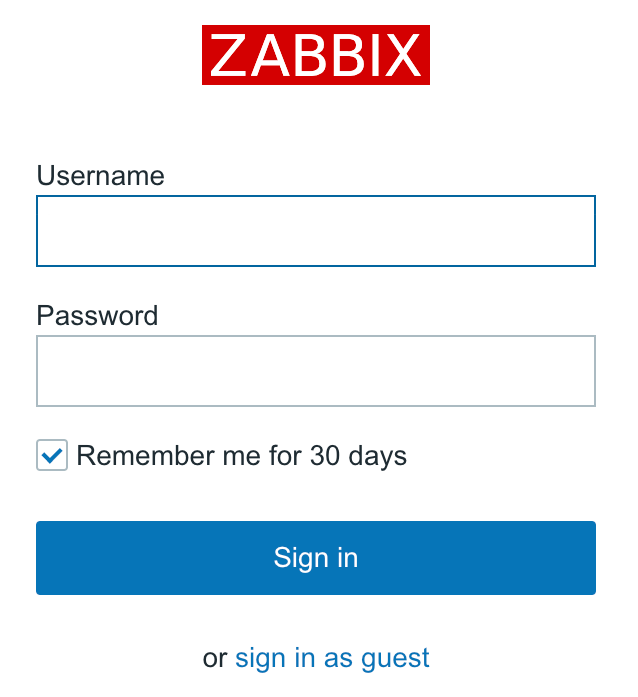
The Zabbix database data that we inserted previously also supplied the default username and password. The default credentials are as follows:
- Username: Admin
- Password: zabbix
That should get you to the initial frontend screen, which drops you into a quite empty dashboard:
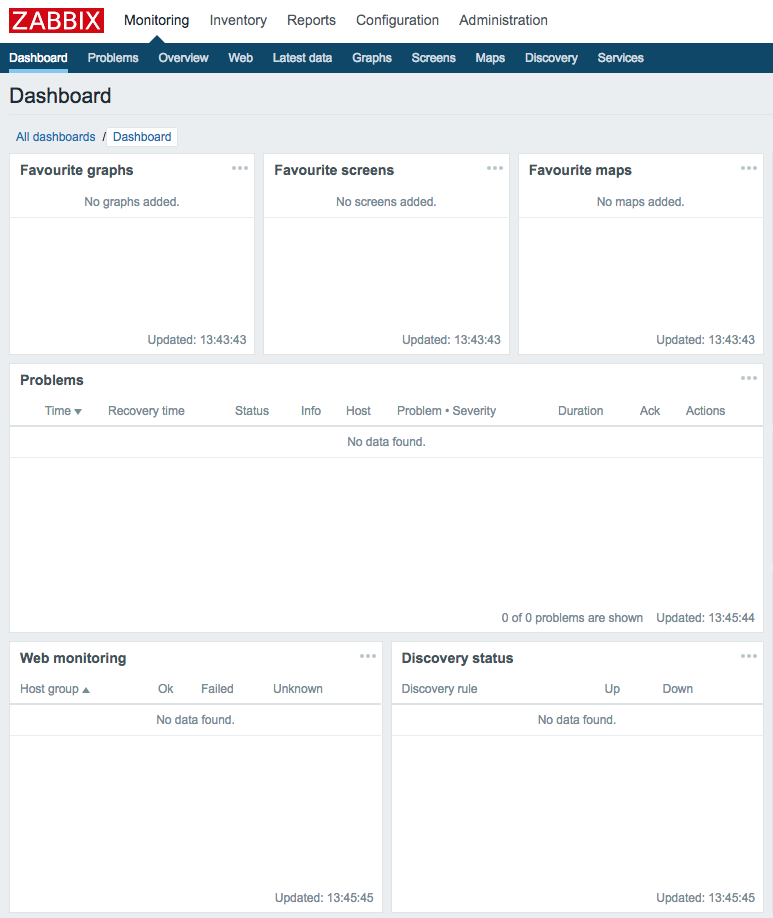
Congratulations! The web frontend is now set up and we have logged in.
If you take a closer look at the upper-right corner, you'll spot something familiar: it's the server name we entered earlier in the configuration wizard. This makes it easier to distinguish this installation from other Zabbix instances; for example, if you had a testing and a production instance. Additionally, this name is also used in the page title, and hence in the tab title in most modern browsers. When multiple tabs are open, you should be able to see the instance name right there in the tab. There's no need to click on each tab individually and check the URL or upper-right corner of the Zabbix frontend:

The dashboard isn't too exciting right now, except maybe for that table labeled System information. The same view is also available somewhere else, though—click on Reports and then click on System information, the very first report:
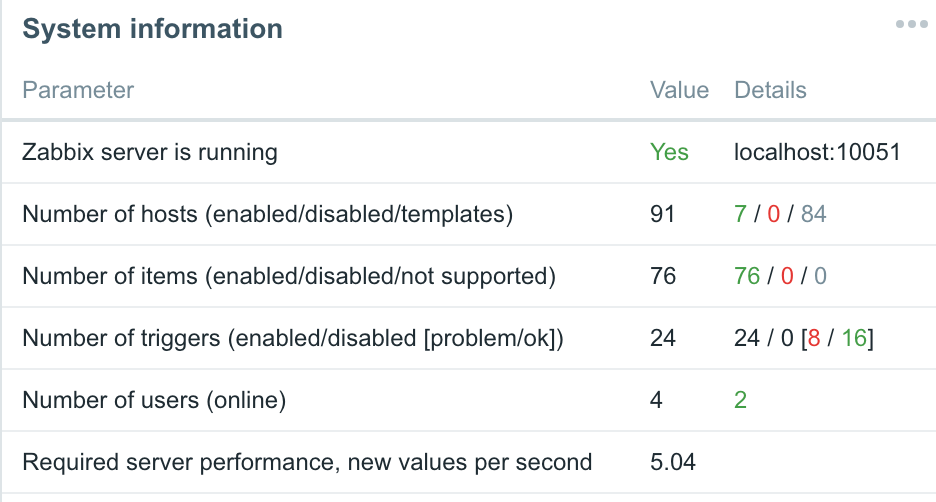
Now we can concentrate on this widget. The frontend successfully sees that the Zabbix server is running and displays the host and port to which it is trying to connect. It also knows some basic things about Zabbix's configuration—there are 76 hosts configured in total. Wait, what's that? We have only set it up and have not configured anything; how can there be 76 hosts already? Let's take a closer look at the DETAILS column. These values correspond to the descriptions in parentheses located in the PARAMETER column. So, there are 0 monitored hosts, 1 that is not monitored, and 75 templates. Now that makes more sense—75 of those 76 are templates, not actual hosts. Still, there's one host that isn't monitored, what's up with that?
Click on Configuration and choose Hosts. You should see the following screenshot:
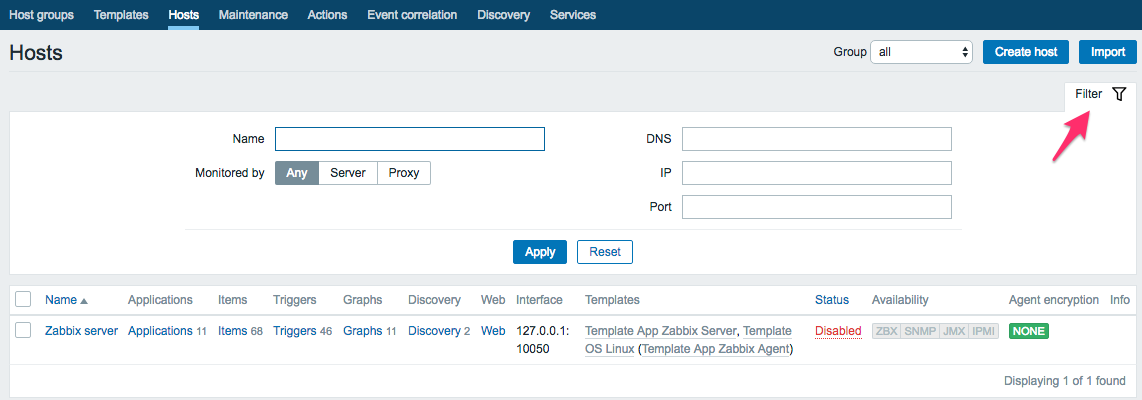
So, there it is. It turns out that the default Zabbix database already has one server configured—the local Zabbix server. It is disabled by default, as indicated in the System information screen and here by the Disabled string in the Status column.
Summary
In this chapter, we set up a fresh Zabbix installation consisting of a database, a server, and an agent daemon, all running on the same machine. We also installed and configured the Zabbix web frontend, based on PHP, to access the database.
We will use the results of this work in all of our future chapters. To see how we can get from a monitored metric to an alert email, we'll go through a simple scenario in the next chapter: think of it as a sort of quick start guide.
Questions
- What are the three main components that we need to set up a Zabbix server ?
- In what language is the Zabbix server written ?
- In what language is the Zabbix frontend written ?
- What databases other than MySQL are supported ?
Further reading
The next list contains a list of URLs that should help you find some extra information concerning what we have seen in this chapter.
- Requirements: https://www.zabbix.com/documentation/4.0/manual/installation/requirements
- Installation from sources: https://www.zabbix.com/documentation/4.0/manual/installation/install
- Why MariaDB Scores Over MySQL: https://opensourceforu.com/2018/04/why-mariadb-scores-over-mysql/
- mysql_secure_installation: https://mariadb.com/kb/en/library/mysql_secure_installation/