


In this chapter, we will cover the tasks related to CPU performance design. You will learn the following aspects of CPU performance design:
- Critical performance consideration - VMM scheduler
- CPU scheduler - processor topology/cache-aware
- Ready time - warning sign
- Spotting CPU overcommitment
- Fighting guest CPU saturation in SMP VMs
- Controlling CPU resources using resource settings
- What is most important to monitor in CPU performance
- CPU performance best practices
Ideally, a performance problem should be defined within the context of an ongoing performance management process. Performance management refers to the process of establishing performance requirements for applications in the form of a service-level agreement (SLA) and then tracking and analyzing the achieved performance to ensure that those requirements are met. A complete performance management methodology includes collecting and maintaining baseline performance data for applications, systems, and subsystems, for example, storage and network.
In the context of performance management, a performance problem exists when an application fails to meet its predetermined SLA. Depending on the specific SLA, the failure might be in the form of excessively long response times or throughput below some defined threshold.
ESXi and virtual machine (VM) performance tuning are complicated because VMs share the underlying physical resources, in particular, the CPU.
Finally, configuration issues or inadvertent user errors might lead to poor performance. For example, a user might use a symmetric multiprocessing (SMP) VM when a single processor VM would work well. You might also see a situation where a user sets shares but then forgets about resetting them, resulting in poor performance because of the changing characteristics of other VMs in the system.
If you overcommit any of these resources, you might see performance bottlenecks. For example, if too many VMs are CPU-intensive, you might experience slow performance because all the VMs need to share the underlying physical CPU.
A Virtual machine monitor (VMM) is a thin layer that provides a virtual x86 hardware environment to the guest operating system on a VM. This hardware includes a virtual CPU, virtual I/O devices, and timers. A VMM leverages key technologies in VMkernel, such as scheduling, memory management, and the network and storage stacks.
Each VMM is devoted to one VM. To run multiple VMs, VMkernel starts multiple VMM instances, also known as worlds. Each VMM instance partitions and shares the CPU, memory, and I/O devices to successfully virtualize the system. A VMM can be implemented using hardware virtualization, software virtualization (binary translation), or paravirtualization (which is deprecated) techniques.
Paravirtualization refers to the communication between the guest operating system and the hypervisor to improve performance and efficiency. The value proposition of paravirtualization is in lower virtualization overhead, but the performance advantage of paravirtualization over hardware or software virtualization can vary greatly depending on the workload. Because paravirtualization cannot support unmodified operating systems (for example, Windows 2000/XP), its compatibility and portability are poor.
Paravirtualization can also introduce significant support and maintainability issues in production environments because it requires deep modifications to the operating system kernel, and for this reason, it was most widely deployed on Linux-based operating systems.
To step through this recipe, you need a running ESXi Server, a VM, a vCenter Server, and vSphere Web Client. No other prerequisites are required.
Perform the following steps to get started:
- Open up vSphere Web Client.
- On the home screen, navigate to
Hosts and Clusters. - Expand the left-hand navigation list.
- In the VM inventory, right-click on
virtual machine, then click onEdit Settings. TheVirtual Machine Edit Settingsdialog box appears. - On the
Virtual Hardwaretab, expand theCPUsection.
- Change the
CPU/MMU Virtualizationoption underAdvancedto one of the following options:
AutomaticSoftware CPU and MMUHardware CPU, Software MMUHardware CPU and MMU

- Click on
OKto save your changes.
- For the change to take effect, perform one of these actions:
- Power cycle or reset the VM
- Suspend and then resume the VM
- vMotion the VM
The VMM determines a set of possible monitor modes to use and then picks one to use as the default monitor mode unless something other than Automatic has been specified. The decision is based on:
- The physical CPU's features and guest operating system type
- Configuration file settings
There are three valid combinations for the monitor mode, as follows:
- BT: Binary translation and shadow page tables
- HV: AMD-V or Intel VT-x and shadow page tables
- HWMMU: AMD-V with RVI or Intel VT-x with EPT (RVI is inseparable from AMD-V, and EPT is inseparable from Intel VT-x)
BT, HV, and HWMMU are abbreviations used by ESXi to identify each combination.
When a VM is powering on, the VMM inspects the physical CPU's features and the guest operating system type to determine the set of possible execution modes. It first finds the set of modes allowed. Then it restricts the allowed modes by configuring file settings. Finally, among the remaining candidates, it chooses the preferred mode, which is the default monitor mode. This default mode is then used if you have Automatic selected.
For the majority of workloads, the default monitor mode chosen by the VMM works best. The default monitor mode for each guest operating system on each CPU has been carefully selected after a performance evaluation of the available choices. However, some applications have special characteristics that can result in better performance when using a non-default monitor mode. These should be treated as exceptions, not rules.
The chosen settings are honored by the VMM only if the settings are supported on the intended hardware. For example, if you select Software CPU and MMU for a 64-bit guest operating system running on a 64-bit Intel processor, the VMM will choose Intel VT-x for CPU virtualization instead of BT. This is because BT is not supported by the 64-bit guest operating system on this processor.
The virtual CPU consists of the virtual instruction set and the virtual memory management unit (MMU). An instruction set is a list of instructions that a CPU executes. MMU is the hardware that maintains the mapping between the virtual addresses and physical addresses in the memory.
The combination of techniques used to virtualize the instruction set and memory determines the monitor execution mode (also called the monitor mode). The VMM identifies the VMware ESXi hardware platform and its available CPU features and then chooses a monitor mode for a particular guest operating system on that hardware platform. It might choose a monitor mode that uses hardware virtualization techniques, software virtualization techniques, or a combination of hardware and software techniques.
We have always had a challenge in hardware virtualization. x86 operating systems are designed to run directly on bare metal hardware, so they assume that they have full control over the computer hardware. The x86 architecture offers four levels of privileges to operating systems and applications to manage access to the computer hardware: ring 0, ring 1, ring 2, and ring 3. User-level applications typically run in ring 3; the operating system needs to have direct access to the memory and hardware and must execute its privileged instructions in ring 0.
Binary translation allows the VMM to run in ring 0 for isolation and performance while moving the guest operating system to ring 1. Ring 1 is a higher privilege level than ring 3 and a lower privilege level than ring 0.
VMware can virtualize any x86 operating system using a combination of binary translation and direct execution techniques. With binary translation, the VMM dynamically translates all guest operating system instructions and caches the results for future use. The translator in the VMM does not perform a mapping from one architecture to another; that would be emulation, not translation. Instead, it translates from the full unrestricted x86 instruction set issued by the guest operating system to a subset that is safe to execute inside the VMM. In particular, the binary translator replaces privileged instructions with sequences of instructions that perform the privileged operations in the VM rather than on the physical machine. This translation enforces encapsulation of the VM while preserving the x86 semantics as seen from the perspective of the VM.
Meanwhile, user-level code is directly executed on the processor for high-performance virtualization. Each VMM provides each VM with all of the services of the physical system, including a virtual BIOS, virtual devices, and virtualized memory management.
In addition to software virtualization, there is support for hardware virtualization. This allows some of the work of running virtual CPU instructions to be offloaded onto the physical hardware. Intel has the Intel Virtualization Technology (Intel VT-x) feature. AMD has the AMD Virtualization (AMD-V) feature. Intel VT-x and AMD-V are similar in aim but different in detail. Both designs aim to simplify virtualization techniques.
The ESXi Server has an advanced CPU scheduler geared towards providing high performance, fairness, and isolation of VMs running on Intel/AMD x86 architectures.
The ESXi CPU scheduler is designed with the following objectives:
- Performance isolation: Multi-VM fairness
- Coscheduling: Illusion that all vCPUs are concurrently online
- Performance: High throughput, low latency, high scalability, and low overhead
- Power efficiency: Saving power without losing performance
- Wide Adoption: Enabling all the optimizations on diverse processor architecture
There can be only one active process per CPU at any given instant; for example, multiple vCPUs can run on the same pCPU, just not in one instance--often, there are more processes than CPUs. Therefore, queuing will occur, and the scheduler will become responsible for controlling the queue, handling priorities, and preempting the use of the CPU.
The main tasks of the CPU scheduler are to choose which world is to be scheduled to a processor. In order to give each world a chance to run, the scheduler dedicates a time slice (also known as the duration in which a world can be executed (usually 10-20 ms, 50 for VMkernel by default)) to each process and then migrates the state of the world between run, wait, co-stop, and ready.
ESXi implements the proportional share-based algorithm. It associates each world with a share of CPU resource across all VMs. This is called entitlement and is calculated from the user-provided resource specifications, such as shares, reservations, and limits.
To step through this recipe, you need a running ESXi Server, a VM that is powered off, and vSphere Web Client. No other prerequisites are required.
Let's get started:
- Open up vSphere Web Client.
- On the home screen, navigate to
Hosts and Clusters. - Expand the left-hand navigation list.
- In the VM inventory, right-click on
virtual machine, and click onEdit Settings. TheVirtual Machine Edit Settingsdialog box appears. - Click on the
VM Optionstab. - Under the
Advancedsection, click onEdit Configuration.

- At the bottom, enter
sched.cpu.vsmpConsolidateasName,TrueforValue, and click onAdd. - The final screen should like the following screenshot. Once you get this, click on
OKto save the setting:

The CPU scheduler uses processor topology information to optimize the placement of vCPUs onto different sockets.
Cores within a single socket typically use a shared last-level cache. The use of a shared last-level cache can improve vCPU performance if the CPU is running memory-intensive workloads.
By default, the CPU scheduler spreads the load across all the sockets in under-committed systems. This improves performance by maximizing the aggregate amount of cache available to the running vCPUs. For such workloads, it can be beneficial to schedule all the vCPUs on the same socket, with a shared last-level cache, even when the ESXi host is under committed. In such scenarios, you can override the default behavior of the spreading vCPUs across packages by including the following configuration option in the VM's VMX configuration file: sched.cpu.vsmpConsolidate=TRUE. However, it is usually better to stick with the default behavior.
To achieve the best performance in a consolidated environment, you must consider a ready time.
Ready time is the time during which vCPU waits in the queue for pCPU (or physical core) to be ready to execute its instruction. The scheduler handles the queue and when there is contention and the processing resources are stressed, the queue might become long.
Ready time describes how much of the last observation period a specific world spent waiting in the queue. Ready time for a particular world (for example, a vCPU) indicates how much time during that interval was spent waiting in the queue to get access to a pCPU. It can be expressed in percentage per vCPU over observation time, and statistically, it can't be zero on average.
The value of ready time, therefore, is an indicator of how long a VM is denied access to the pCPU resources that it wanted to use. This makes it a good indicator of performance.
When multiple processes try to use the same physical CPU, that CPU might not be immediately available and a process must wait before the ESXi host can allocate a CPU to it.
The CPU scheduler manages access to the physical CPUs on the host system. A short spike in CPU used or CPU ready indicates that you are making the best use of the host resources. However, if both the values are constantly high, the hosts are probably overloaded and performance is likely poor.
Generally, if the CPU-used value of a VM is above 90 percent and the CPU-ready value is above 20 percent per vCPU (high number of vCPUs), performance is negatively affected.
This latency may impact the performance of the guest operating system and the running of applications within a VM.
To step through this recipe, you need a running ESXi Server, a couple of CPU-hungry VMs, a VMware vCenter Server, and vSphere Web Client. No other prerequisites are required.
Let's get started:
- Open up vSphere Web Client.
- On the home screen, navigate to
Hosts and Clusters. - Expand the left-hand navigation list.
- Navigate to one of the CPU-hungry VMs.
- Navigate to the
Monitortab. - Navigate to the
Performancetab. - Navigate to the
Advancedview. - Click on
Chart Options. - Navigate to
CPUfromChart metrics. - Navigate to the VM object and only select
Demand,Ready, andUsageinMHz.
Note
The key metrics when investigating a potential CPU issue are as follows:
- Demand: The amount of CPU that the VM is trying to use.
- Usage: The amount of CPU that the VM is actually being allowed to use.
- Ready: The amount of time during which the VM is ready to run but (has work it wants to do) is unable to because vSphere could not find physical resources to run the VM on.
11. Click on Ok.
In the following screenshot, you will see the high ready time of the VM:

Notice the amount of CPU this VM is demanding and compare that to the amount of CPU usage the VM is actually being able to get (usage in MHz). The VM is demanding more than it is currently being allowed to use.
Notice that the VM is also seeing a large amount of ready time.
A vCPU is in a ready state when the vCPU is ready to run (that is, it has a task it wants to execute). But it is unable to run because the vSphere scheduler is unable to find physical host CPU resources to run the VM on. One potential reason for elevated ready time is that the VM is constrained by a user-set CPU limit or resource pool limit, reported as max limited (MLMTD). The amount of CPU denied because of a limit is measured as the metric max limited.
Ready time is reported in two different values between resxtop/esxtop and vCenter Server. In resxtop/esxtop, it is reported in an easily understood percentage format. A figure of 5 percent means that the VM spent 5 percent of its last sample period waiting for the available CPU resources (only true for 1-vCPU VMs). In vCenter Server, ready time is reported as a measurement of time. For example, in vCenter Server's real-time data, which produces sample values every 20,000 milliseconds, a figure of 1,000 milliseconds is reported for 5 percent ready time. A figure of 2,000 milliseconds is reported for 10 percent ready time.

Although high ready time typically signifies CPU contention, the condition does not always warrant corrective action. If the value of ready time is close in value of the amount of time used on the CPU and if the increased ready time occurs with occasional spikes in CPU activity but does not persist for extended periods of time, this might not indicate a performance problem. The brief performance hit is often within the accepted performance variance and does not require any action on the part of the administrator.
When we provision CPU resources, which is the number of vCPUs allocated to run the VMs, and if its number is greater than the number of physical cores on a host, it is called CPU overcommitment. CPU overcommitment is a normal practice in many situations as it increases the consolidation ratio. Nevertheless, you need to monitor it closely.
CPU overcommitment is not recommended in order to satisfy or guarantee the workload of a tier-1 application with a tight SLA. It may be successfully leveraged to highly consolidate and reduce the power consumption of light workloads on modern, multicore systems.
To step through this recipe, you need a running ESXi Server with SSH enabled, a couple of running CPU-hungry VMs, an SSH client (Putty), a vCenter Server, and vSphere Web Client. No other prerequisites are required.
The following table elaborates on Esxtop CPU Performance Metrics:
Esxtop Metric | Description | Implication |
| The percentage of time a vCPU in a run queue is waiting for the CPU scheduler to let it run on a physical CPU. | A high |
| The percentage of possible CPU processing cycles that were actually used for work during this time interval. | The |
To spot CPU overcommitment, there are a few CPU resource parameters that you should monitor closely. They are:
- Log in to the ESXi Server using an SSH client (Putty).
- Type
esxtopand hit Enter.
- Monitor the preceding values to understand CPU overcommitment.

This example uses esxtop to detect CPU overcommitment. Looking at the pCPU line near the top of the screen, you can determine that this host's two CPUs are 100 percent utilized. Four active VMs are shown, Res-Hungry-1 to Res-Hungry-4. These VMs are active because they have relatively high values in the %USED column. The values in the %USED column alone do not necessarily indicate that the CPUs are overcommitted. In the %RDY column, you see that the three active VMs have relatively high values. High %RDY values plus high %USED values are a sure indicator that your CPU resources are overcommitted.
From the CPU view, navigate to a VM and press the E key to expand the view. It will give a detailed vCPU view for the VM. This is important because, at a quick level, CPU that is ready as a metric is best referenced when looking at performance concerns more broadly than a specific VM. If there is high ready percentage noted, contention could be an issue, particularly if other VMs show high utilization when more vCPUs than physical cores are present. In that case, other VMs could lead to high ready time on a low idle VM. So, long story short, if the CPU ready time is high on VMs on a host, it's time to verify that no other VMs are seeing performance issues.
You can also use the vCenter performance chart to spot CPU overcommitment, as follows:
- Log in to the vCenter Server using vSphere Web Client.
- On the home screen, navigate to
Hosts and Clusters. - Expand the left-hand navigation list.
- Navigate to one of the ESXi hosts.
- Navigate to the
Monitortab. - Navigate to the
Performancetab. - Navigate to the
Advancedview. - Click on
Chart Options. - Navigate to
CPUfromChart metrics. - Select only
UsedandReadyin theCounterssection and click onOK:

Now you will see the ready time and the used time in the graph and you can spot the overcommitment. The following screenshot is an example output:

The following example shows that the host has high ready time:

Although high ready time typically signifies CPU contention, the condition does not always warrant corrective action. If the value of ready time is also accompanied by high used time, then it might signify that the host is overcommitted.
So the used time and ready time of a host might signal contention. However, the host might not be overcommitted due to workload availability.
There might be periods of activity and periods that are idle. So the CPU is not over-committed all the time. Another very common source of high ready time for VMs, even when pCPU utilization is low, is due to storage being slow. A vCPU, which occupies a pCPU, can issue a storage I/O and then sit in the WAIT state on the pCPU, blocking other vCPUs. Other vCPUs accumulate ready time; this vCPU and pCPU accumulate wait time (which is not part of the used or utilized time).
Guest CPU saturation happens when the application and operating system running in a VM use all of the CPU resources that the ESXi host is providing for that VM. However, this guest CPU saturation does not necessarily indicate that a performance problem exists.
Compute-intensive applications commonly use all of the available CPU resources, but this is expected and might be acceptable (as long as the end user thinks that the job is completing quickly enough). Even less-intensive applications might experience periods of high CPU demand without experiencing performance problems. However, if a performance problem exists when guest CPU saturation is occurring, steps should be taken to eliminate the condition.
When a VM is configured with more than one vCPU but actively uses only one of the vCPUs, resources that could be used to perform useful work are being wasted. At this time, you may at least see a potential performance problem from the most active vCPU perspective.
To step through this recipe, you need a running ESXi Server, a couple of running CPU-hungry VMs, a vCenter Server, and vSphere Web Client. No other prerequisites are required.
To spot CPU overcommitment in the guest OS, ready time and usage percentage are two CPU resource parameters that you should monitor closely:
- Log in to vCenter Server using vSphere Web Client.
- On the home screen, navigate to
Hosts and Clusters. - Expand the ESXi host and go to the CPU-hungry VM.
- Navigate to the
Monitortab. - Navigate to the
Performancetab. - Navigate to the
Advancedview. - Click on
Chart Options.
- Navigate to
CPUfromChart metrics. - Navigate to the VM object.
- Navigate to the
Advancedtab and click onChart Options. - Select only
Usage,Ready, andUsedin theCounterssection and click onOK:

The preceding example shows the high usage and used value on a VM configured with one vCPU. We can see its overall CPU usage is 100 percent:

The preceding example shows that after you added a second vCPU to the VM, the percentage of overall CPU usage dropped down to 52 percent.
So in the case of an SMP VM, if it demands high CPU resources, it may happen that either the application is single threaded, or the guest operating system is configured with uniprocessor HAL.
Many applications are written with only a single thread of control. These applications cannot take advantage of more than one processor core.
In order for a VM to take advantage of multiple vCPUs, the guest operating system running on the VM must be able to recognize and use multiple processor cores. If the VM is doing all of its work on vCPU0, the guest operating system might be configured with a kernel or HAL that can recognize only a single processor core.
In the preceding graph, the OS is sharing the load of the single-threaded application between both the available vCPUs.
You have two possible approaches to solve performance problems related to guest CPU saturation:
- Increase the CPU resources provided to the application
- Increase the efficiency with which the VM uses CPU resources
Adding CPU resources is often the easiest choice, particularly in a virtualized environment. If a VM continues to experience CPU saturation even after adding CPU resources, the tuning and behavior of the application and operating system should be investigated.
If you cannot rebalance CPU load or increase processor efficiency even after all of the recipes discussed earlier, then it might be something else that is keeping the host CPU still saturated.
It could be a resource pool and its allocation of resources toward the VM.
Many applications, such as batch jobs, respond to a lack of CPU resources by taking longer to complete but still produce correct and useful results. Other applications might experience failure or might be unable to meet critical business requirements when denied sufficient CPU resources.
The resource controls available in vSphere can be used to ensure that resource-sensitive applications always get sufficient CPU resources, even when host CPU saturation exists. You need to make sure that you understand how shares, reservations, and limits work when applied to resource pools or to individual VMs. The default values ensure that ESXi will be efficient and fair to all VMs. Change the default settings only when you understand the consequences.
To step through this recipe, you need a running ESXi Server, a couple of running CPU-hungry VMs, a vCenter Server, and vSphere Web Client. No other prerequisites are required.
Let's get started:
- Log in to vCenter Server using vSphere Web Client.
- On the home screen, navigate to
Hosts and Clusters. - Expand the ESXi host and go to the CPU-hungry VM.
- Navigate to the
Monitortab. - Navigate to the
Performancetab. - Navigate to the
Advancedview. - Click on
Chart Options. - Navigate to
CPUfromChart metrics. - Navigate to the VM object.
- Navigate to the
Advancedtab and click on theChart Options. - Select only
ReadyandUsedin theCounterssection and click onOK.
Now if there is a lower limit configured on the VM, and at the same time if it is craving for a resource, then you will see high ready time and a low used metric. An example of what it may look like is given in the following image:
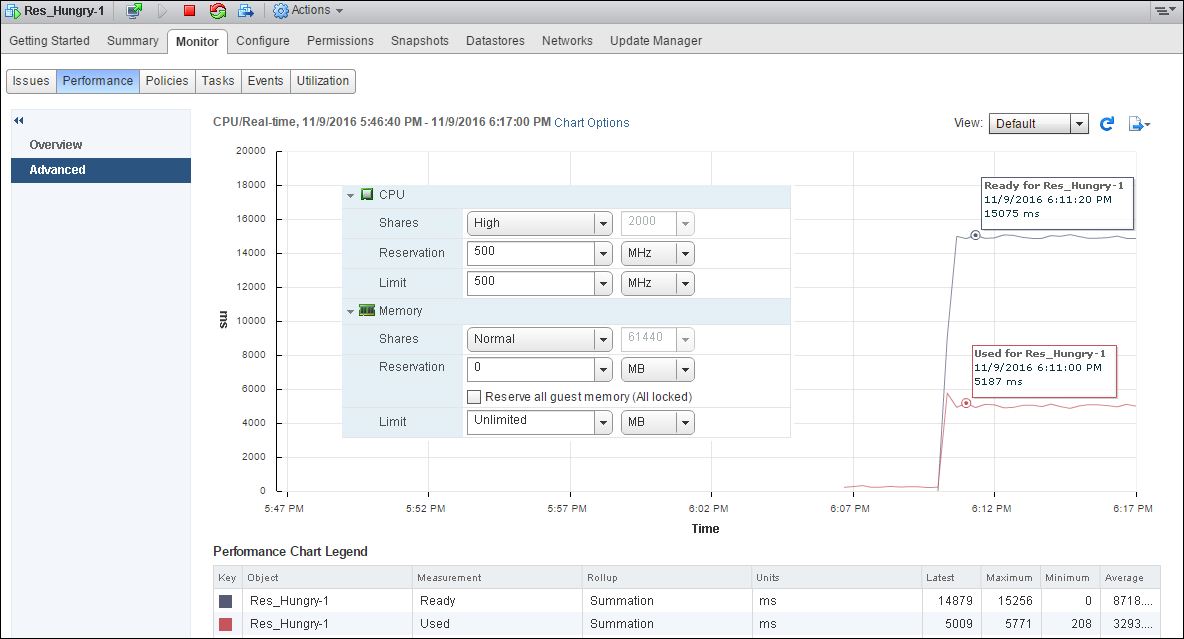
Look at the preceding example and see when the VM is craving for more CPU resource. If you put a limit on top of it, then it will experience high ready time and low used time. Here, in the preceding example, this VM is set with a limit of 500MHz.
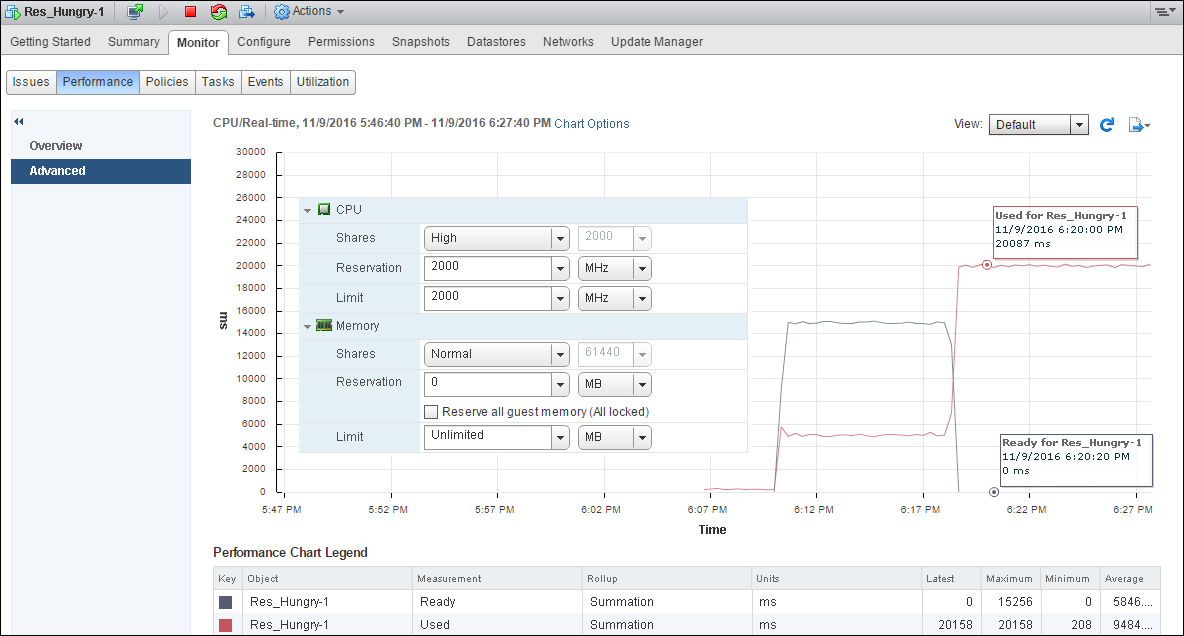
Now to rectify this, we can change the limit value and the VM should perform better with low ready time and high used value.
- Right-click on the CPU-hungry VM and select
Edit Resource Settings. - Under CPU, change the
Sharesvalue toHigh(2,000 Shares). - Change
Reservationto2000MHzand theLimitvalue to2000MHz. - Click on
OK.
Now the VM should look and perform as shown in the following screenshot:
Before you jump to conclusions as to what to monitor in CPU performance, you need to make sure that you know what affects CPU performance. Things that can affect CPU performance include:
- CPU affinity: When you pin down a virtual CPU to a physical CPU, it may happen that your resource gets imbalanced. So this is not advised, until you have a strong reason to do that.
- CPU prioritization: When CPU contention happens, the CPU scheduler will be forced to prioritize VMs based on entitlement and queue requests.
- SMP VMs: If your application is not multithreaded, then there is no benefit in adding more CPU resources in VMs. In fact, the extra idle vCPUs add overhead that prevents some more useful work from being done.
- Idle VMs: You may have too many idle VMs, which you think should not eat up resources. However, in reality, However, in reality, even idle VMs can affect CPU performance if the VM shares or reservations have been changed from their default values.
So, now you know what affects CPU performance. You can now look at what it takes to monitor it.
You can categorize the factors that should be monitored for CPU performance into three main sections:
- Host CPU usage
- VM CPU usage
- VM CPU ready time
To monitor these sections, you need to know the esxtop counters, and they are:
PCPU Used (%)- Per group statistics:
%Used%Sys%RDY%Wait%CSTP%MLMTD
To step through this recipe, you need a running ESXi Server with SSH enabled, a couple of running CPU-hungry VMs, and an SSH client (Putty). No other prerequisites are required.
Let's get started:
- Log in to the ESXi host using an SSH client (Putty).
- Run
esxtopand monitor the statistics. The following screenshot is an example output:

- Now, look at the performance counters as mentioned previously. In the following example output, look at the different metrics:

In the preceding example, you can see our PCPU 0 and PCPU 1 are being used heavily (100 percent and 73 percent UTIL, respectively), and it shows the following figure:

Now in the preceding example, you see that the %Used value of the four CPU-hungry virtual machines is pretty high.
Also, look at the %RDY screen and you will see high ready time, which indicates a performance problem.
The following list is a quick explanation of each of these metrics:
PCPU USED (%): This refers to the CPU utilization per physical CPU.%USED: This is the physical CPU usage per group.%SYS: This is the VMkernel system's activity time.%RDY: This is the ready time. It is referred to as the amount of time that the group spent ready to run but waiting for the CPU to be available. Note that this is not adjusted for the number of vCPUs. You should expand the group to see%Readyfor each vCPU, or at least divide this by the number of vCPUs to use an average per vCPU.%WAIT: This is the percentage of time spent in the blocked or busy state. It includes idle time and also the time waiting for I/O from the disk or network.%CSTP: This is referred to as the percentage of time spent in VMkernel on behalf of the group for processing interrupts.%CSTPfor a vCPU indicates how much time the vCPU has spent not running in order to allow extra vCPUs in the same VM to catch up. High values suggest that this VM has more vCPUs than it needs and the performance might be suffering.%MLMTD: This is the amount of time spent ready to run, but not scheduled because of a CPU limit.
CPU virtualization adds varying amounts of overhead. Because of this, you may need to fine-tune the CPU performance and need to know what the standard best practices are.
The following are the standard CPU performance best practices:
- You need to avoid using SMP VMs unless it is required by the application running inside the guest OS. This means if the application is not multithreaded, then there is no benefit of using the SMP VM.
- You should prioritize VM CPU usage with a proportional share algorithm.
- Use Distributed Resource Scheduler (DRS) and vMotion to redistribute VMs and reduce contention.
- Use the latest available virtual hardware for the VMs.
- Reduce the number of VMs running on a single host. This way, you can not only reduce contention, but also reduce the fault domain configuration.
- You should leverage the application-tuning guide from the vendor to tune your VMs for best performance.
To step through this recipe, you need a running ESXi Server (licensed with Enterprise Plus for DRS), a couple of running VMs, and vSphere Web Client. No other prerequisites are required.
Let's get started:
- For the first best practice, you need to check whether the application is single threaded or multithreaded. If it is single threaded, then avoid running an SMP VM:
- You need to log in to vCenter using vSphere Web Client, then go to the
Hometab. - Once there, go to the VM and look at the
VM Hardwaretile. - Now you can see whether the VM has one vCPU or multiple vCPUs. You see whether it's using them by looking at
%Utilizationor a similar metric for each vCPU:
- You need to log in to vCenter using vSphere Web Client, then go to the

- For the second best practice, you need to prioritize the VM CPU using shares and reservation. Depending on the customer SLA, this has to be defined:
- You need to log in to vCenter using vSphere Web Client, then go to the
Hometab. - Once there, go to the VM, right-click on it, and then select
Edit Resource Settings. - In the
CPUsection, you need to define theSharesandReservationvalues depending on your SLA and the performance factors.
- You need to log in to vCenter using vSphere Web Client, then go to the
By default, ESXi is efficient and fair. It does not waste physical resources. If all the demands could be met, all is well. If all the demands are not satisfied, the deprivation is shared equitably among VMs by default.
VMs can use and then adjust the shares, reservation, or limit settings. But be sure that you know how they work first:

- For the third best practice, you need to have a vSphere Cluster and have DRS enabled for this. DRS will load balance the VMs across the ESXi hosts using vMotion.
The first screenshot shows that the DRS is enabled on this vSphere Cluster:

The second screenshot shows the automation level and migration threshold:

- For the fourth best practice, you first need to see what virtual hardware the VM is running on; if it is not current, then you need to upgrade it. A virtual hardware version can limit the number of vCPUs:
- You need to log in to vCenter using vSphere Web Client, then go to the
Hometab. - Once there, go to
Hosts and Clusters, then click onVMand look at theVM Hardwaretile.
- You need to log in to vCenter using vSphere Web Client, then go to the
In the following example, it is version 10, which is old, and we can upgrade it to version 13.

Note
Take a VM snapshot prior to upgrading in order to mitigate the rare occurrence of a failure to boot the guest operating system after upgrading. For further information, refer to https://kb.vmware.com/kb/1010675.
- Now, to upgrade the virtual hardware of a VM, it has to be powered off. Then, start it again, right-click on
VM, go toCompatibility, and thenUpgrade VM Compatibility. It should give you a warning:

- Once you click on Yes, the virtual hardware version will be upgraded.

- For the fifth recommendation, you need to limit the number of vCPUs required by the VMs that would run on the host and the number of sockets/cores available in each physical host:
- Try to balance the CPU load of your VMs across all of your hosts
- Monitor the VMs for performance and adjust as necessary.
- For the last recommendation, you need to get the vendor-application-tuning guide and follow that to tune your virtual environment. A typical example is Microsoft Exchange Server 2016 Best Practices Guide.
Note
For further information, refer to https://blogs.vmware.com/apps/2016/01/now-updated-microsoft-exchange-server-vmware-vsphere-best-practices-guide.html.