


 Download code from GitHub
Chapter 1: Understanding Cloud Bills
In this first chapter of the book, we will guide you so that you are able to visualize, export, and understand Azure billing from the common Azure portal. We will cover the following topics in the chapter:
- So, you're doing cloud—now what?
- Understanding how cloud billing works
- Reviewing the Azure portal for cost management
- Matching your cloud billing with your company's department organization
- Sources of billing information and export methods of billing data
By the end of this chapter, you will have a deep understanding of how service categories and cloud meters work, and be able to assess, evaluate, and export the cloud billing of your managed Azure subscription(s).
Technical requirements
To follow this chapter, you'll need the following:
- A computer with internet connectivity
- Access to the Azure portal
- Privileges to access Cost Management information (https://docs.microsoft.com/en-us/azure/cost-management-billing/costs/assign-access-acm-data)
You can find the source code used in this book here: https://github.com/PacktPublishing/The-Road-to-Azure-Cost-Governance
So, you're doing cloud—now what?
The public cloud is becoming a mainstream technology staple for every modern company, and most customers have large, skilled, and experienced information technology (IT) teams that are converting from managing on-premises resources to hybrid or pure cloud.
One of the most neglected aspects of public clouds, from an IT department's point of view, is how to deal with recurrent, granular, and detailed cloud costs that are in no way associated with the old purchase process of on-premises resources and require technical skills to be fully understood.
Migrating entire data centers to the cloud is not the arrival point: it is, in fact, only the starting point of a journey toward a pay-as-you-go model, where technology changes along with mentality, ways of working (think of development-operations, more commonly known as DevOps), and flexibility all have a direct, daily, mutable impact on your IT spend, unlike anything you have ever managed before. The shift from capital expenditures (CapEx) on-premises to operational expenditures (OpEx) on the cloud is a major game-changer for every company, and—specifically—per meter billing is a challenge when moving from a fixed cost pattern to a variable and more fluid cost.
This chapter is dedicated to how Azure bills services and cloud objects, and how to retrieve all the necessary information to then proceed with the next step, which is choosing your own cloud spending strategy. The goal is for you to fully understand cloud billing and all its implications, from technical to financial.
Understanding how cloud billing works
This section will guide you through the most common patterns of Azure cloud billing, to be able to correctly display, analyze, and export your billing information and associate it with the relevant IT resources.
In Azure, once you have access to a portal and have privileges to create resources and objects, the billing meters start, according to a few concepts that we'll describe in this chapter, as outlined here:
- Type of agreement with Microsoft (Enterprise Agreement (EA), Microsoft Customer Agreement (MCA), cloud solution provider (CSP), developers, and more): This is a contract signed with Microsoft that will allow you to create Azure subscriptions and cloud services within those subscriptions.
- Services' price: The price of Azure services, along with any discount or promotion or benefit applied to services and or contracts.
- Resource utilization (region, time, frequency, and type): This is a key concept of cloud services. Every cloud service has a different pricing scheme that depends on these variables. For example, a Virtual Machine (VM) is billed by the duration of utilization and according to the VM family and size, and it's also different for each selected region. Therefore, the final price will be defined by how much time a specific VM type in an Azure region (that is, West US) has been running. We'll be able to see practical examples in the pricing section.
The way you can use resources in Azure depends on what type of agreement you have with Microsoft, even if in the end all will be visualized through the Azure portal.
At the time of writing, there are a few different types of billing accounts, as outlined here:
- Microsoft Online Services Program (MOSP): This type of contract can be created by signing up through the Azure website. Each subscription will have its own payment methods and monthly invoice, as shown here:
Figure 1.1 – Structure of the MOSP
- EA: This is created when your company signs an EA with Microsoft. Each agreement will have one or more enrollments where Azure subscriptions can be created. Enrollment is typically associated with a monetary commitment or pre-paid agreements that grant special discounts to companies (the agreement may drop if the customer is not consuming as promised, whereas on exceeding consumption they will get the same discounts). The invoice will be unique across the whole EA, and the payment method is defined within the EA. The structure for an EA billing account is shown in the following diagram:
Figure 1.2 – Structure of the EA
- Microsoft Customer Agreement (MCA): This is a customer agreement only for Azure resources, with a limit of 20 subscriptions for each profile. A diagram of this agreement is shown here:
Figure 1.3 – Structure of the MCA
- Microsoft Partner Agreement (MPA): This agreement is specific to partners (CSP) so that they can manage billing for their customers. If your Azure solution is through a CSP, you will have to request specific access to be able to see the billing. In addition, please be aware that Cost Management access will display retail rates, therefore you will need to make adjustments to reflect any additional discounts or benefits for your contract.
Important Note:
When a customer works with the MPA, they don't own the billing account, and all the features that come with the billing account are only accessible through the CSP itself. Tasks such as creating subscriptions need to be done through the partner, as well as the responsibility of providing such features through a Cost Management Platform (CMP), as for the cloud billing access.
The following diagram shows the structure of the MPA:
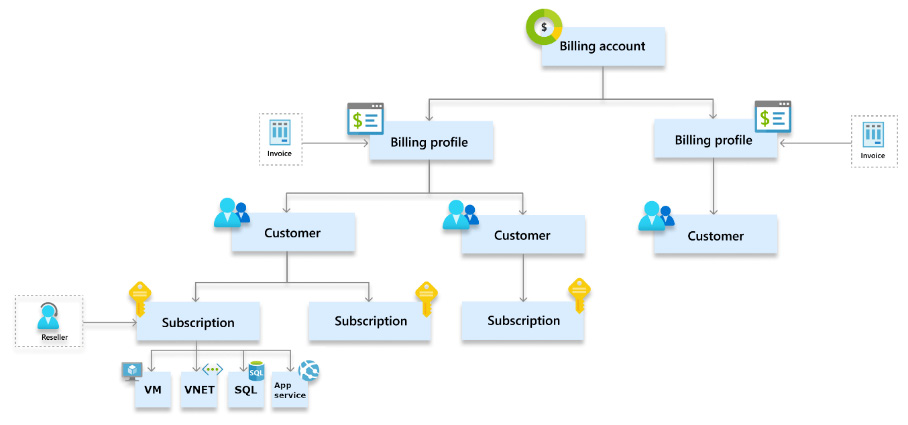
Figure 1.4 – Structure of the MPA
Tip:
A full list of supported Microsoft Azure offers can be found here: https://docs.microsoft.com/en-us/azure/cost-management-billing/costs/understand-cost-mgt-data. Other offer types unsupported by Azure Cost Management can still benefit from this book's suggestions, provided that they can find a way of exporting their cost details.
Cost Management information can be accessed by global admin(s) and admin agents and will display the invoiced pricing for Microsoft partners and providers. This is typically then used to charge back Azure usage to customers and resellers and to view specific billing benefits (such as Partner Credit), user budgets, exports, and notifications.
End customers and resellers can only view their specific subscription(s) billing information with proper Role-Based Access Control (RBAC) access to the subscription(s) and the visibility policy enabled for the tenant: the display information can only be at retail prices.
Additional information can be found here: https://docs.microsoft.com/en-us/azure/cost-management-billing/costs/get-started-partners.
Question 1: How do I know what my billing type is?
As per the documentation at https://docs.microsoft.com/en-us/azure/cost-management-billing/manage/view-all-accounts#check-the-type-of-your-account, you can check your type of billing directly from the Azure portal's Azure Cost Management | Properties page.
Each of these billing types allows you to create Azure subscriptions, which are the largest technical repositories of resources in Azure.
You can then access billing information via several portal pages and dashboards according to the scopes you choose, as shown in the next screenshot:
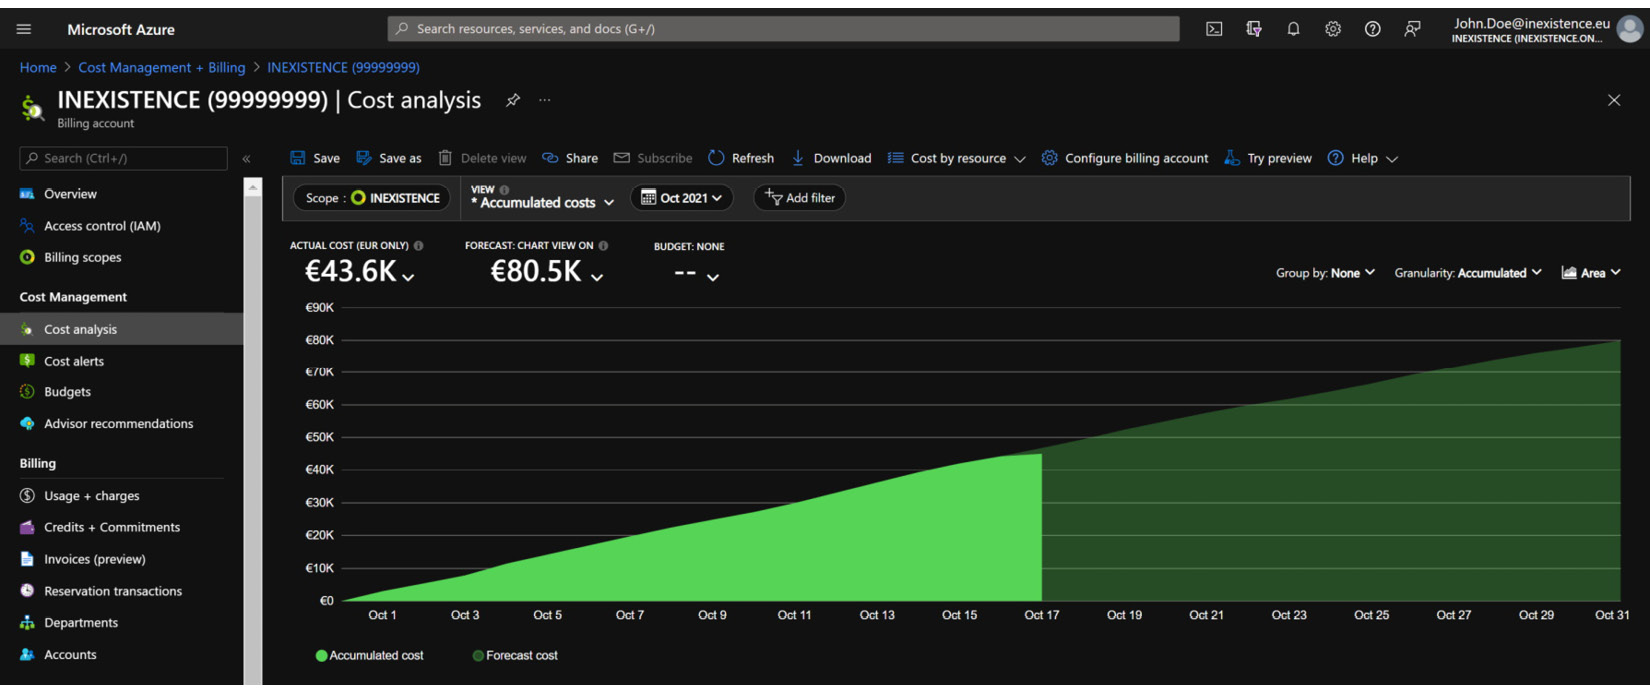
Figure 1.5 – Azure portal Cost Management + Billing page
The Azure portal Cost Management + Billing page will display a table with all the available scopes according to the following:
- Your credentials
- Your access permissions (identity and access management, or IAM)
- Your company's hierarchy
For Azure plans that allow invoices to be read and downloaded, this can be done via the Azure portal through the following:
- MOSP
- MCA
- MPA
Question 2: How are resources billed in Azure?
Well, the truth is that it depends on the resource and the meter category and subcategory. Also, considering the whole set of data center services, not all resources are billed: for example, a network interface card (NIC) attached to a VM is typically not billed.
Every Azure service that is billed has a metering unit that will define how the object can be considered in terms of a paid service—for example, a VM is billed according to its capacity (the VM size is the meter subcategory) and its usage frequency (VMs are billed per duration of usage). In the final monthly bill or invoice, every used Meter Category and subcategory is summed according to its usage and pricing.
Platform-as-a-Service (PaaS) services are typically billed by performance tiers—such as standard, premium, basic, and so on—depending on the type of service and the combination of resources that are included in each tier.
Let's review a few examples of how various Azure services have slightly different billing rules, as follows:
- VMs: Azure VMs are billed per second rounded down to the last minute, but the different VM states (if the VM is starting, or doing operating system (OS) provisioning, and so on) will help you decide whether or not to pay for the VM, as explained in the following screenshot. This is important when you are switching off a VM for cost reduction (we'll learn more about this in the upcoming chapters) and must make sure you deallocate it in order to stop its billing (additional information can be found here: https://docs.microsoft.com/en-us/azure/virtual-machines/states-billing):
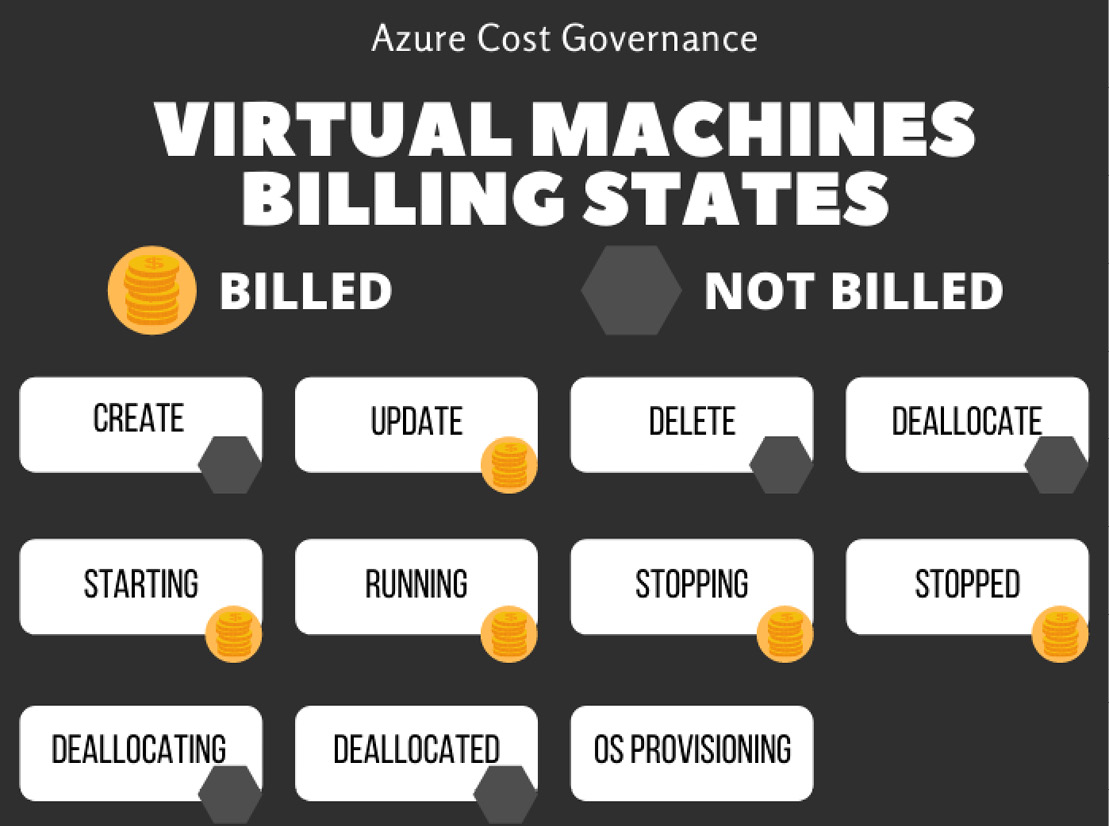
Figure 1.6 – VM billing states
- App Service (according to the official pricing given at https://azure.microsoft.com/en-us/pricing/details/app-service/windows/) has six different pricing plans, each with a different set of features, CPU/memory, and pricing:
- Free
- Shared
- Basic (B1, B2, B3)
- Standard (S1, S2, S3)
- Premium (P1V2, P2V2, P3V2, P1V3, P2V3, P3V3)
- Isolated (I1, I2, I3, I1V2, I2V2, I3V2, I1V3, I2V3, I3V3)
The price is calculated by hours of usage, and users can add items on top of the plan, such as domain, certificate, and Secure Sockets Layer (SSL) connections. The following screenshot summarizes all the App Service available tiers and the related included features:
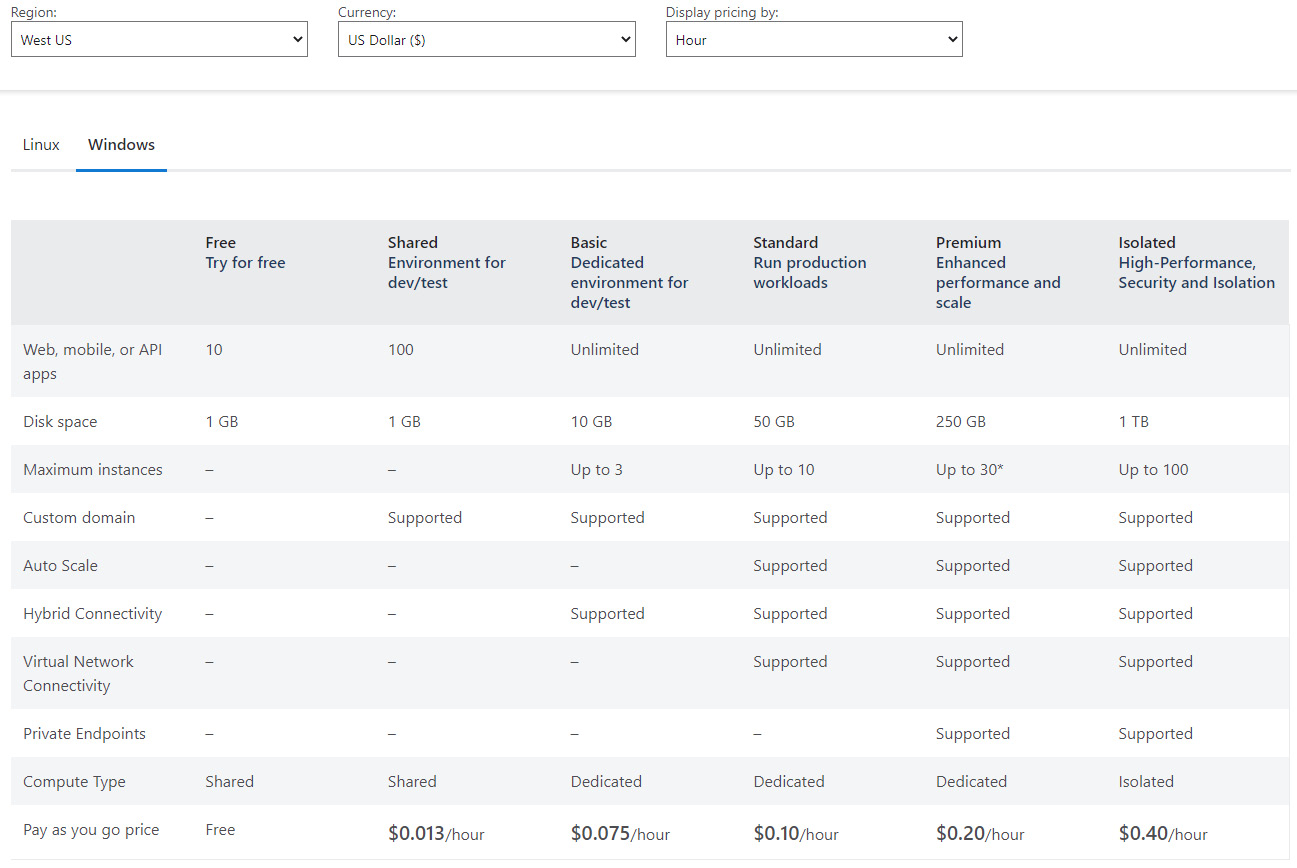
Figure 1.7 – App Service plans
- Other examples of pay per use are Cosmos DB and Functions. Cosmos DB (https://azure.microsoft.com/en-us/pricing/details/cosmos-db/) normalizes all database operations and offers two database models, as follows:
On top of it, storage must be added.
For the serverless model, the following screenshot displays the Cosmos DB pricing for RUs:
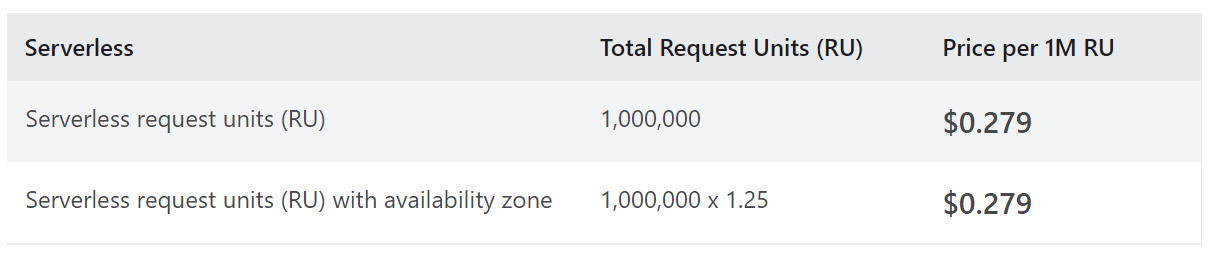
Figure 1.8 – Cosmos DB pricing for RUs
The next screenshot shows the Cosmos DB pricing for storage consumed:
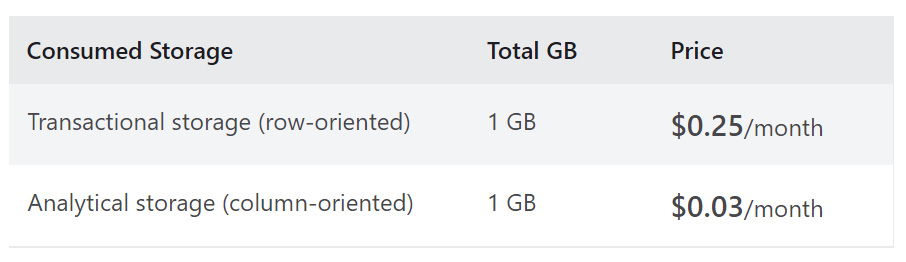
Figure 1.9 – Cosmos DB pricing for storage
In addition, users must take into account backup storage, analytical storage, dedicated gateway, and multiple regions. All these configurations should be evaluated during the project design phase to better understand the impact on costs that a specific choice will have according to how that specific resource is billed.
According to its pricing rules (mentioned at https://azure.microsoft.com/en-us/pricing/details/functions/), with Azure Functions, the pay-per-use model has a number of free grants (1 million requests and 400,000 gigabytes (GB) of resource consumption) per month, and a price per execution and execution time, as displayed in the following screenshot:
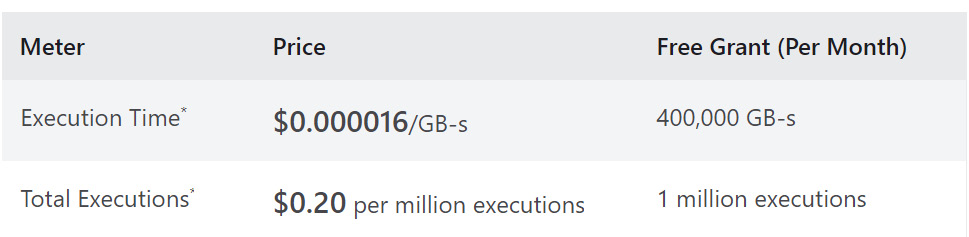
Figure 1.10 – Azure Functions pay-per-use price
There is also a premium plan with reserved virtual CPU (vCPU) and memory, as illustrated in the following screenshot:
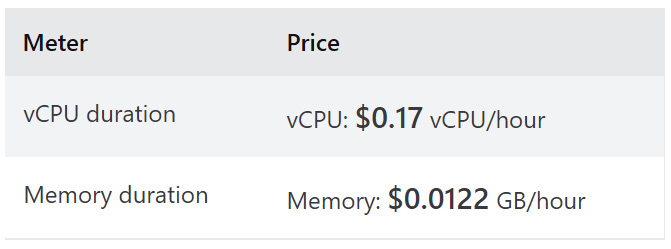
Figure 1.11 – Azure Functions Premium plan
Most of the billing categories can be summarized by service, such as Compute, Storage, Networking, Web, Databases, Identity, Security, Media, and so on, and have their own timeframe, unit, and frequency of billing metering.
Question 3: What are MACC and monetary commitment?
You might have signed with Microsoft a Microsoft Azure Consumption Commitment (MACC), a contractual agreement that upon a commitment of Azure spend, they will grant you special discounts. If your company has a MACC, it is important that you track your monthly and yearly spending against the commitment on a recurring basis, together with all other cost governance matters. This is mainly because your commitment to consuming Azure services will have an impact on the discounts and benefits from Microsoft, and its unfulfillment may have an impact on your grants.
Question 4: How do I know the cost of my Azure services?
You might have got pricing information from your partner, your Microsoft account team, or other sources of information, but for the sake of speed and comprehension, we recommend that you become fluent with using the Azure pricing calculator. This will allow for the following:
- A better understanding of the billing metering for each service
- An updated spending view of new objects in Azure
- A clear spending forecast for new projects
The Azure pricing calculator can be found at https://azure.microsoft.com/en-us/pricing/calculator/.
Here is an example of how you can price a service. Let's imagine you have a very simple application that is comprised of a couple of frontend VMs and a couple of backend VMs. The requirements are very basic, as we can see here:
The first pricing example is for frontend VMs. You choose the OS type and VM family, and enter the details on the configurator's page, as illustrated in the following screenshot:
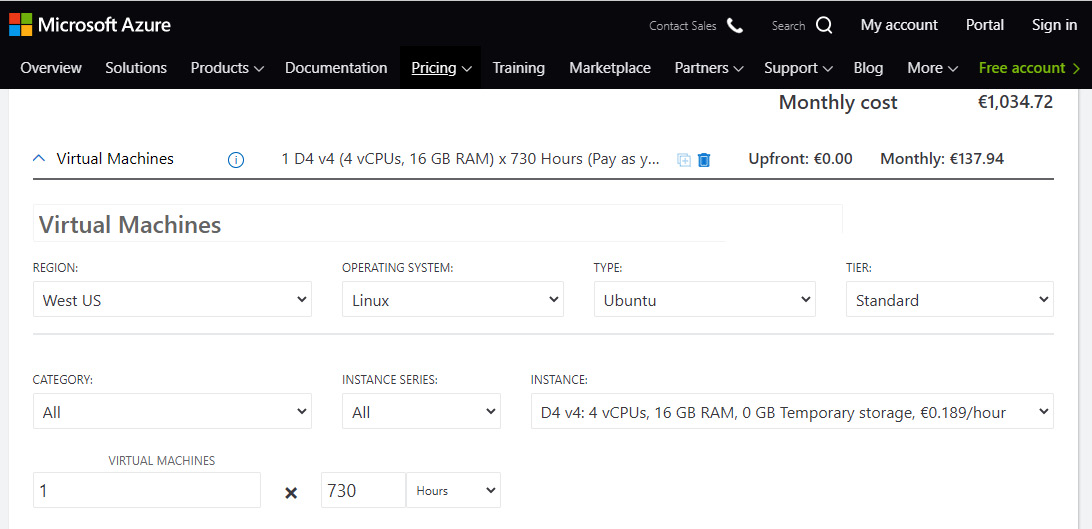
Figure 1.12 – Adding a VM to the Azure pricing tool
At this point, you need to know what type of usage these VMs will endure. You can choose from the following:
- Always on (maybe they are production VMs). In this case, 730 hours is the full month of an always-on VM. If this is the case, you will probably want to consider reservations, which we'll be able to dig deeper into in the next chapter, but for the sake of pricing, you might want to decide on a 1-year or 3-year reservation, to lower the VM price, as illustrated in the following screenshot:
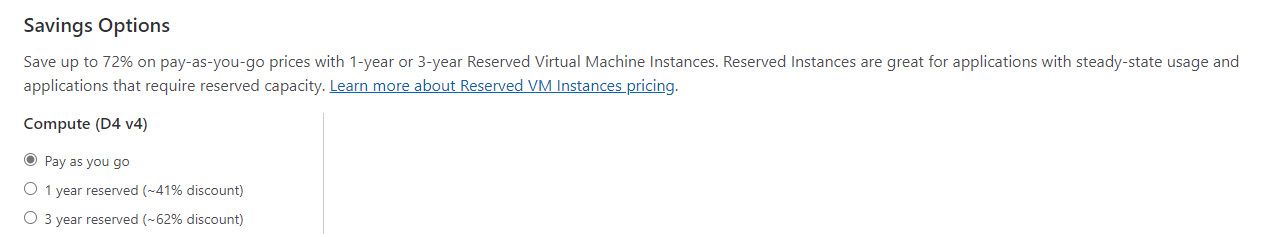
Figure 1.13 – Azure VM pricing: choice of pay as you go or reservation options
- A schedule interval—for example, Mon-Fri, 8 a.m.-8 p.m., which amounts to 12 hours, 5 days per week, for a total of 240 hours per month
- An on-demand VM, typical of development environments, where developers or workers will switch the VM on only when using it—for example, 1 week per month, 12 hours per day, for a total of 60 hours per month
If you change the billing hours of the chosen VM, it will become clear that deciding on the usage time has a strong impact on billing at the end of the month! We'll be able to discover ways of optimizing this choice in the next chapters. The VM pricing lets you add storage options for the OS, along with any storage transactions related to Standard HDDs, as illustrated in the following screenshot:
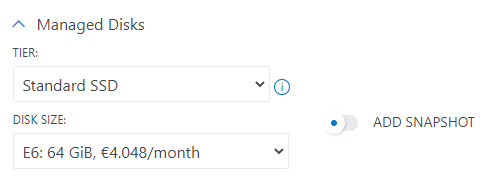
Figure 1.14 – Azure VM price: choice of managed disks
The tool will also help you in calculating data transfer charges where applicable, as shown in the following screenshot:
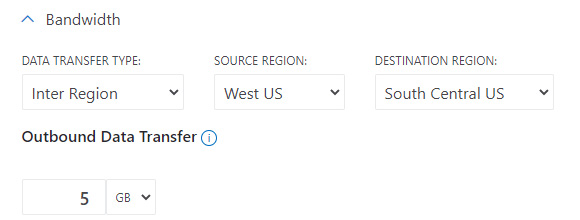
Figure 1.15 – Azure VM price: bandwidth options
You will then need to add any additional data disks via storage service pricing, and even with storage you will have the option of reserving capacity—we will talk about this in the next chapter. This is illustrated in the following screenshot:
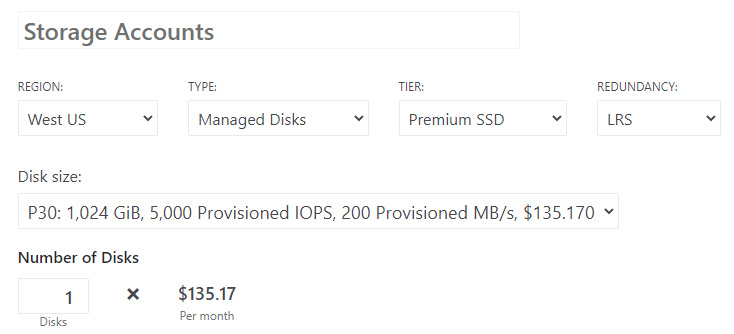
Figure 1.16 – Azure storage account pricing for additional data disks
In this section, we started with explaining the subscription hierarchy and billing of Azure, according to the contract in place with Microsoft, and then provided a brief explanation of the Azure pricing calculator, which is a very helpful tool not only to understand new project costs but also to analyze the impact of savings once the cost optimization process is in place.
Once you have organized your company's subscriptions and have access to each of them, including—where applicable—the root management group (we will work on management groups and privileges later in the book, but for now, the important information is that the cost owner should have full access to all cost-related objects in Azure), it is time for you to open the Azure portal for cost management and start looking at the billing, as we will see in the next section.
Reviewing the Azure portal for cost management
This section will guide you through the Azure portal's Cost Management + Billing section. The first thing to know is that billing is reflected with up to 24 hours' lag in the portal, which means that the spending displayed on the portal has roughly a 1-day delay.
When you open the Cost Management + Billing page, you are prompted with Billing scopes, Cost Management, and management groups links. When you click on the Cost Management link, you are prompted with the menu shown in the following screenshot (at the time of writing, there were a few interesting pages in the Azure portal's Cost Management section):

Figure 1.17 – The Azure portal Cost Management view pane
The Azure portal Cost Management section features a few very useful pages that will allow you to review billing and charges for the subscriptions and agreements where you have the correct privileges (either Owner, Contributor, Reader, or any custom role with access to costs). For partner agreements, you might need to ask your reseller to grant you access to download the billing information for you.
Azure customers with an Azure EA, MCA, or MPA may view and download their pricing in the Azure portal. Depending on the policies set for your organization by the Enterprise admin, only certain administrative roles provide access to your organization's EA pricing information. If you have an MCA, you must be the billing profile owner, contributor, reader, or invoice manager to view and download pricing. If you have an MPA, you must have the Global Admin and Admin Agent role in the partner organization to view and download pricing.
Matching your cloud billing with your company's department organization
The first step to cost governance is to understand the hierarchy of subscriptions and how this can be adapted to the hierarchy of your organization, or vice versa. The goal of this section is to help you define a structural organization for billing that matches the company's one: we will be able to put this into practice in the next chapter by setting up automation and configuration dedicated to billing.
There are several ways to organize subscriptions, and for larger organizations, the Management Groups feature helps manage large numbers and complex hierarchies of subscriptions, in terms of cost, security, and governance. Blueprints help define in a declarative way how you intend to organize and set up your environment.
Defining a subscriptions and scopes hierarchy will allow you to match the billing and chargeback expectations of your company for optimal cost control.
There are several ways to do this, but the choice of hierarchy has a few technical implications that might make it difficult to change afterward, which is why Microsoft recommends carrying out this operation within the Well-Architected Framework and Cloud Adoption Framework governance models so that the landing zone will also consider the billing necessities of the finance and other departments.
You might decide to organize your subscriptions in the following way:
- By department/business unit (that is, marketing, IT, HR, and so on)
- By function (shared services, data services, security, and so on)
- By geography (either by continent, region, or the geographic subsets specific to your company)
- By application/workload
Or, you could use a mix of all the preceding options, especially when considering an already deployed virtual data center where you are reorganizing mixed and stratified configurations.
In my experience, large organizations have very structured IT roles that might clash with fast-paced, constantly shifting cloud roles. A cloud architect is supposed to work on a subscription, but can they also be the owner of such a subscription? A financial operations (FinOps) team may need to have technical skills to understand cloud billing while owning subscriptions and accounts. When a new project starts, should the owner of the project also own the subscription or just be a contributor? Department owners are typically the first stop when looking for subscription owners, but in some companies, there is no chargeback for cloud services, and in the end, this might be useless.
The main question you should pose is: How do I want to organize the cloud spending of my company according to its internal processes and departments? And this conversation should happen as soon as possible. In the next chapter, we'll be able to implement several types of hierarchy for subscriptions, using special features such as management groups.
The takeaway of this section is that your technical department will have to work with the cloud cost owner to understand how the virtual data center must be deployed to make it easier for the finance department to understand and process billing information. This might seem a lower-priority task compared to the technical deployment of objects and resources, but if you don't set the correct expectations before any deployment happens, you may find it very difficult to be able to track costs according to the department or application that is using those resources.
Sources of billing information and export methods of billing data
In this section, we will go through several basic concepts of cloud cost representations and ways of getting cost information, with the related pros and cons.
As mentioned, before jumping into each of the recommended ways of checking your cloud spending, you need to take a little time to clarify what are the targets you want to achieve (it's very useful to also involve the financial controller team of your company in this).
You could start with some of the main questions you typically have to answer, as follows:
Question 5: Do you need a technical representation of the costs, a business representation, or both?
A technical representation is easily achievable since it is based on the infrastructure you've built on Azure and represents the costs for a technical team. A business view of the costs should link the costs to a business object (for example, an application or a service to the customer) that may be composed of different Azure resources. Tagging cloud resources is an important part of this representation and will be covered in the upcoming chapters.
Long story short, you may think about the technical representation as how much we spent on storage, grouped by storage type and storage transactions (typical for a cloud service team) and about the business representation, as we have four applications in our Azure infrastructure, as how much does application A cost on Azure, considering all the Azure resources involved?
Question 6: Which level of detail do you need to reach? You can choose from the following:
- High level: Is it enough to know that VMs cost X, licenses cost Y, and an internet of things (IoT) hub costs Z?
- Detailed: I need to know the costs of every component—for example, I need to know the costs of the storage, split into the space used and access transactions.
Question 7: Is the Azure Cost Management tool enough (the filtering, grouping features, drill-down capabilities, and so on) for your purposes?
Once you have grasped the basic concepts of Azure billing and what information is available with the included tools, you should be able to understand if a different tool is needed for your company.
Question 8: Do you need to work on the raw data to add business value or maybe integrate into the company dashboarding and a total cost of ownership (TCO) control system?
This will again depend on how your organization usually maps, displays, and accounts for IT costs. You might already have a billing dashboard, and integrating the Azure information into your own portal or view is the right way of adding cloud spend to your overall picture.
Question 9: Is the Azure technical terminology right for your audience?
For example: Does your audience know what a storage transaction is, or the difference between bandwidth and inputs/outputs per second (IOPS)?
If you need to export costs to a non-technical audience, you will need to aggregate costs in higher views with custom labels and forget the Azure Cost Management tool, or plan to rename technical terminology with a custom dictionary for non-technical users (for example, general-purpose storage, LRS (locally redundant storage), and (GRS) (geo-redundant storage)) into more company-friendly labels such as storage, local storage, and geo-redundant storage.
Having briefly covered how to organize your subscription, and the importance of your hierarchy and initial setup to successful cost governance, one of the first steps to establish full control is to export, analyze, and save your Azure billing information.
Export methods
Keep in mind that this could not be a one-size-fits-all approach: you should identify which case is better for you and your organization. And the answer may change over time, prompting you to rework and evolve the original approach.
Let's now see the different ways you can get your cost insights.
The Azure Cost Management tool
This is the right tool to start learning about the terminology and how Azure allocates costs and what are the main cost-splitting criteria or cost categories you can find.
The Azure Cost Management tool is integrated into your Azure account and it's ready to use.
You can find the tool in Azure by searching for Cost Management + Billing in the search bar of the Azure portal (https://portal.azure.com).
You can reach the analytics graphs by clicking on Cost analysis on the left pane, as illustrated in the following screenshot:
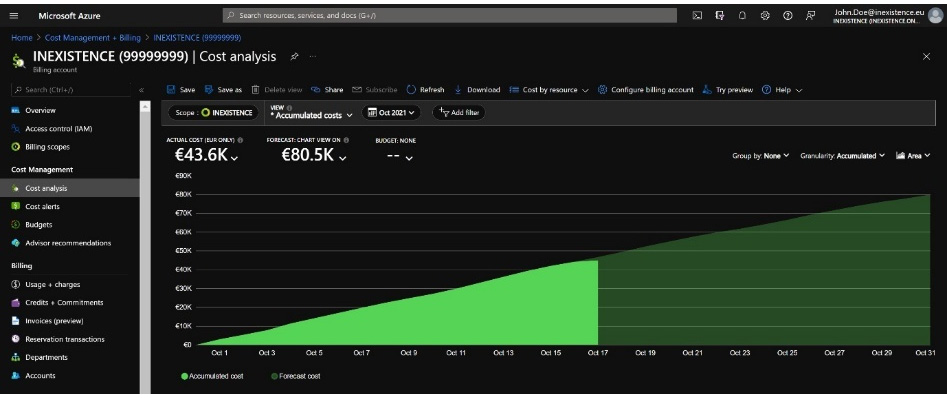
Figure 1.18 – Azure portal: Cost analysis
The default view is a cumulated view of the current month.
Important Note:
The Azure portal features and views are constantly changing; therefore, you might find your screen a bit different from our screenshots. However, the contents and capabilities are typically only added, so the information will be consistent with ours at the time of writing.
Using the controls in the zone above the graph, you can add filtering clause(s) and change the grouping criteria, the Granularity setting, and the rendered graphs, as illustrated in the following screenshot:
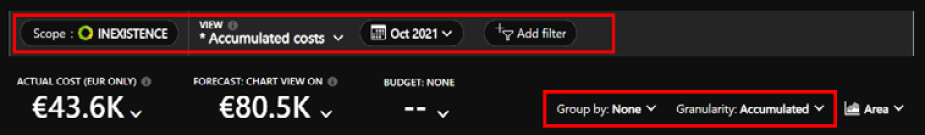
Figure 1.19 – Azure portal: Cost analysis (Accumulated option)
In my experience, the most useful filtering and grouping criteria to start with are these:
- By subscription (remember that the best practices suggest you split different business services/applications into different subscriptions, as we will see in the next chapter): For example, Production, Disaster Recovery, and so on.
- Service name: Simply, the service you bought from Azure. Every service has different
MeterCategorytypes. - Meter category: Let's call it
cost-Macrocategory. It identifies the high-level cost type according to how a specific service is billed (for example, VMs, disks, storage account, IoT hub, Structured Query Language (SQL) servers, SQL databases, and so on). - Meter subcategory: Useful for a detailed drill-down of cost analysis, it identifies different cost types inside
MeterCategory(for example, MeterCategory Disks has different subcategories such as provisioned IOPS, provisioned bandwidth, storage, and so on). - Resource group: This allows you to filter the cost representation for a slice, reflecting the cost of one or more resource groups. If you implemented resource groups by application, you could have a first very interesting high-level cost split. Please also note that the cost analysis pane is also available directly on the specific resource group page.
- Tag: This allows you to filter based on custom tags applied to the instances. The prerequisite of this view is that you've already implemented a tagging policy, otherwise you may lose instances (and costs!) in the report. We will dig deeper into tagging in the next chapter.
If you are a reseller or provider (for CSP contracts), additional scopes are available to your analysis, such as the following:
- Billing account will help visualize billing (pre-tax) for all customers and billing profiles.
- Billing profile will help visualize billing (pre-tax) of a billing invoice that can then be filtered by customer or
InvoiceID. - End customer will display all the costs (pre-tax) associated with a specific customer.
Tip:
Additional information can be found here: https://docs.microsoft.com/en-us/azure/cost-management-billing/costs/get-started-partners.
In the following screenshot, you will find three pie charts that enable you to have three different views for three additional data dimensions. For example, you may have filtered by virtual machines in the main graph and have a different drill-down for Service name, Location, and Enrollment account name:
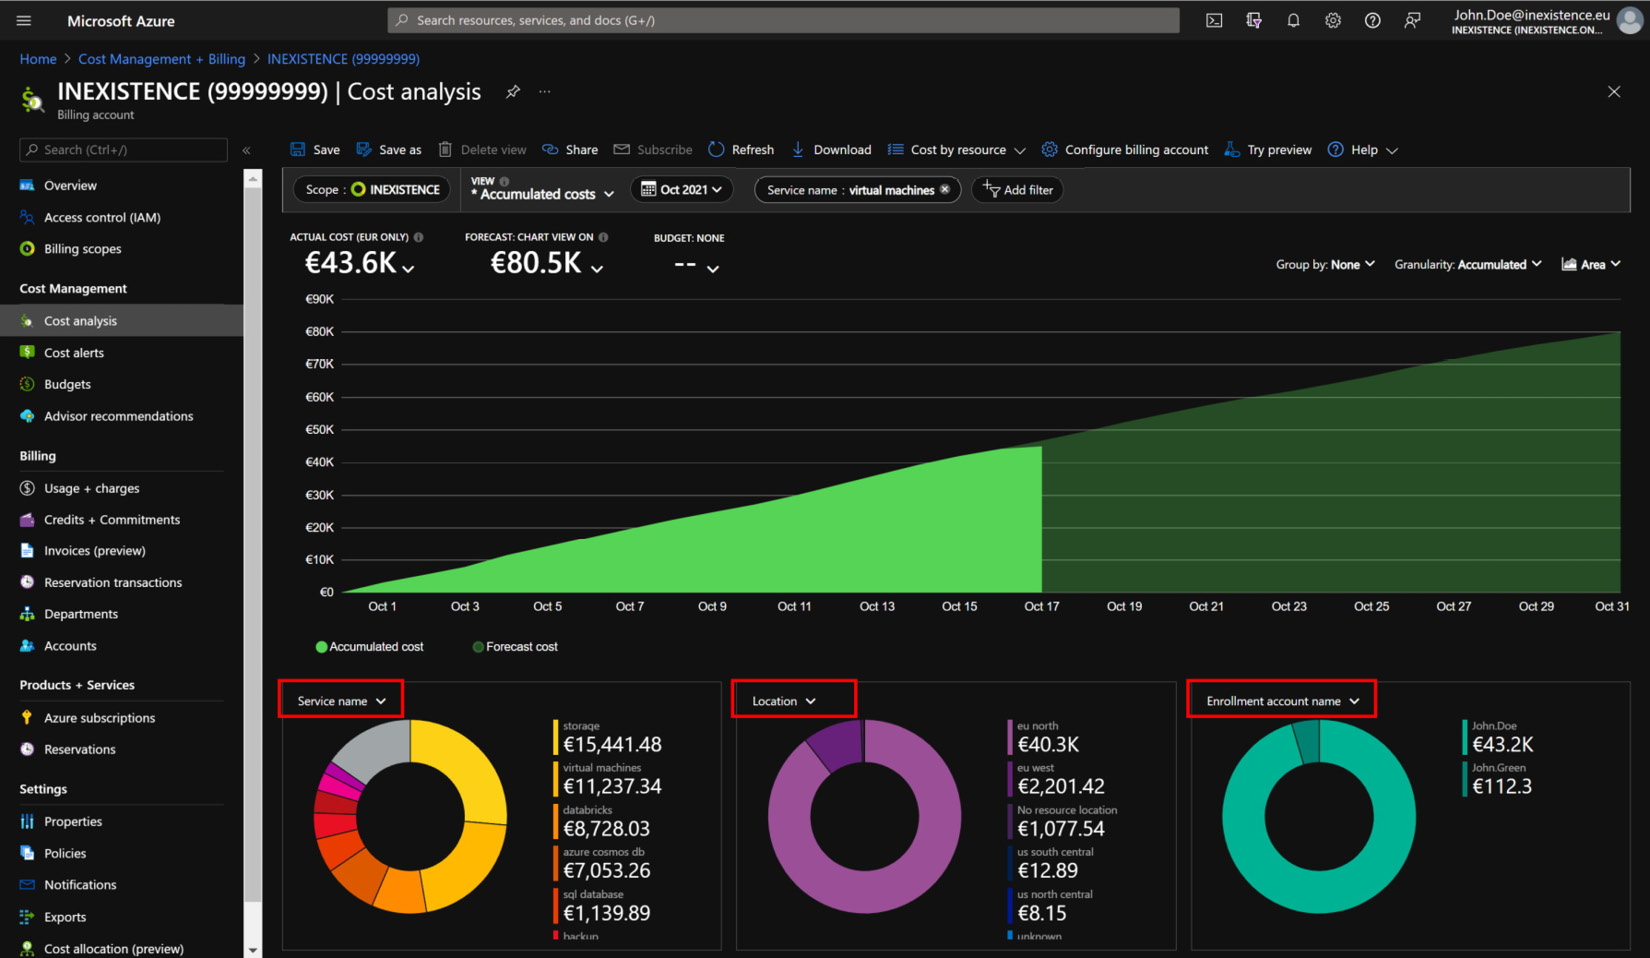
Figure 1.20 – Azure Cost Management (Cost analysis)
Hint: Azure cost control is a two-dimensional (2D) tool, and the pie charts add information but can only represent a static view and not a trend, so they might not help you in identifying unplanned extra costs if you have very dynamic cloud usage. We will learn how to deal with this later in the book.
To identify what is going on with your Azure infrastructure and costs and represent trends and spikes, you need to represent the costs on a timeline, therefore using the main graph area and switching between different visualizations to obtain a more comprehensive way to represent the same data, as follows:
- Filtering by meter category, grouped by resource group, to identify which resource type is more expensive in which resource group.
- Filtering by resource group, grouped by meter category, to identify, inside the resource group you chose, the resource type that is causing any extra costs.
- You can now filter by resource group, filter by meter category, and group by resource to identify the instance(s) that are causing any extra costs.
You should always consider switching graph filtering/grouping due to the representational limits of the main graph until you identify which resource is causing cost anomalies.
In the following subsections, we'll work on different visualization types for the cost analysis that will get you up to speed with fully understanding the cloud bill and all the related details.
Azure data visualization types
Using the rightmost dropdown in the Azure Cost Management main graph, you can change the graph type between the following options:
- Line chart: Trend is represented by a line.
- Area chart: Trend is represented by a colored area.
- Column (stacked): Each item for the grouping criteria is stacked on top of the other.
- Column (grouped): Each item for the grouping criteria is presented side by side.
- Table
An example of an Area chart is provided here:
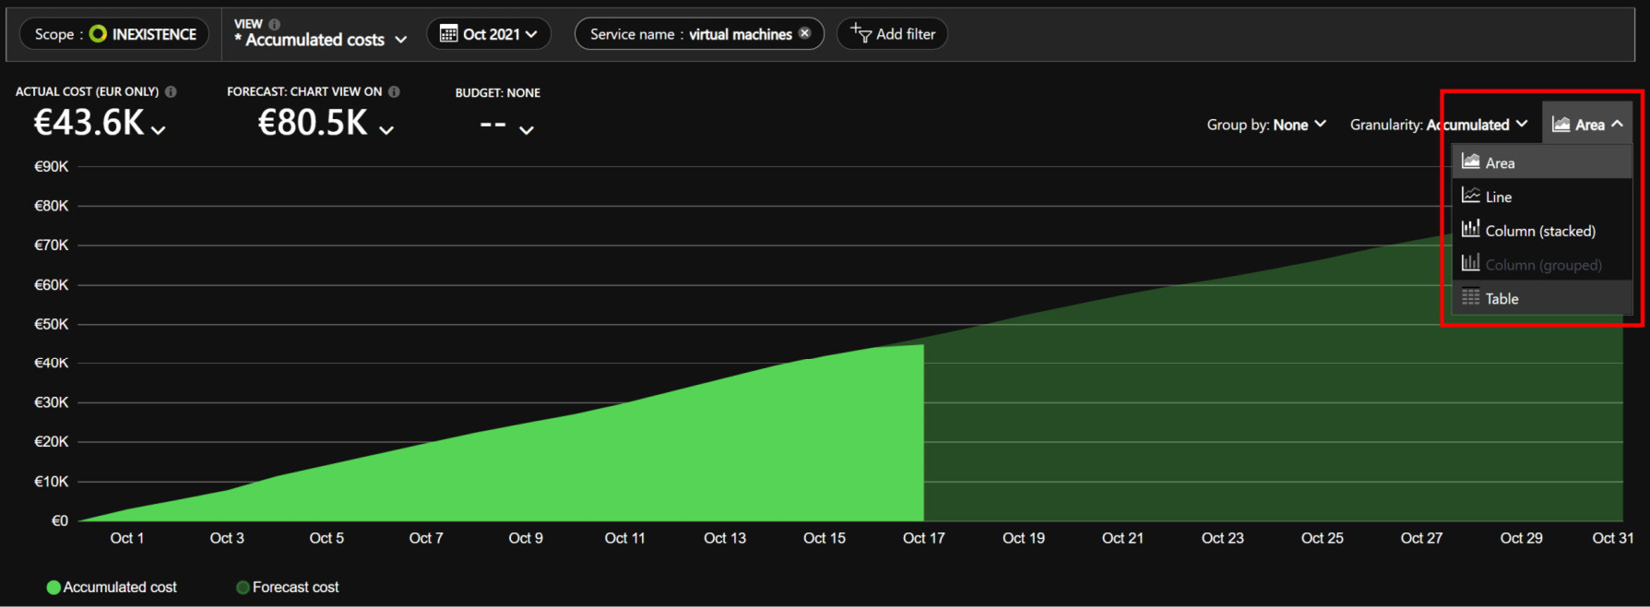
Figure 1.21 – Azure portal: Cost analysis (Accumulated area view)
This visualization is useful to display a trend, and specifically in the Accumulated view, since it allows you to identify if the cost is linear (for example, X Euros (€) per day, for every day) or if there are spikes or unplanned extra-consumption.
Now, let's look at an example of a Column (stacked) bar chart:
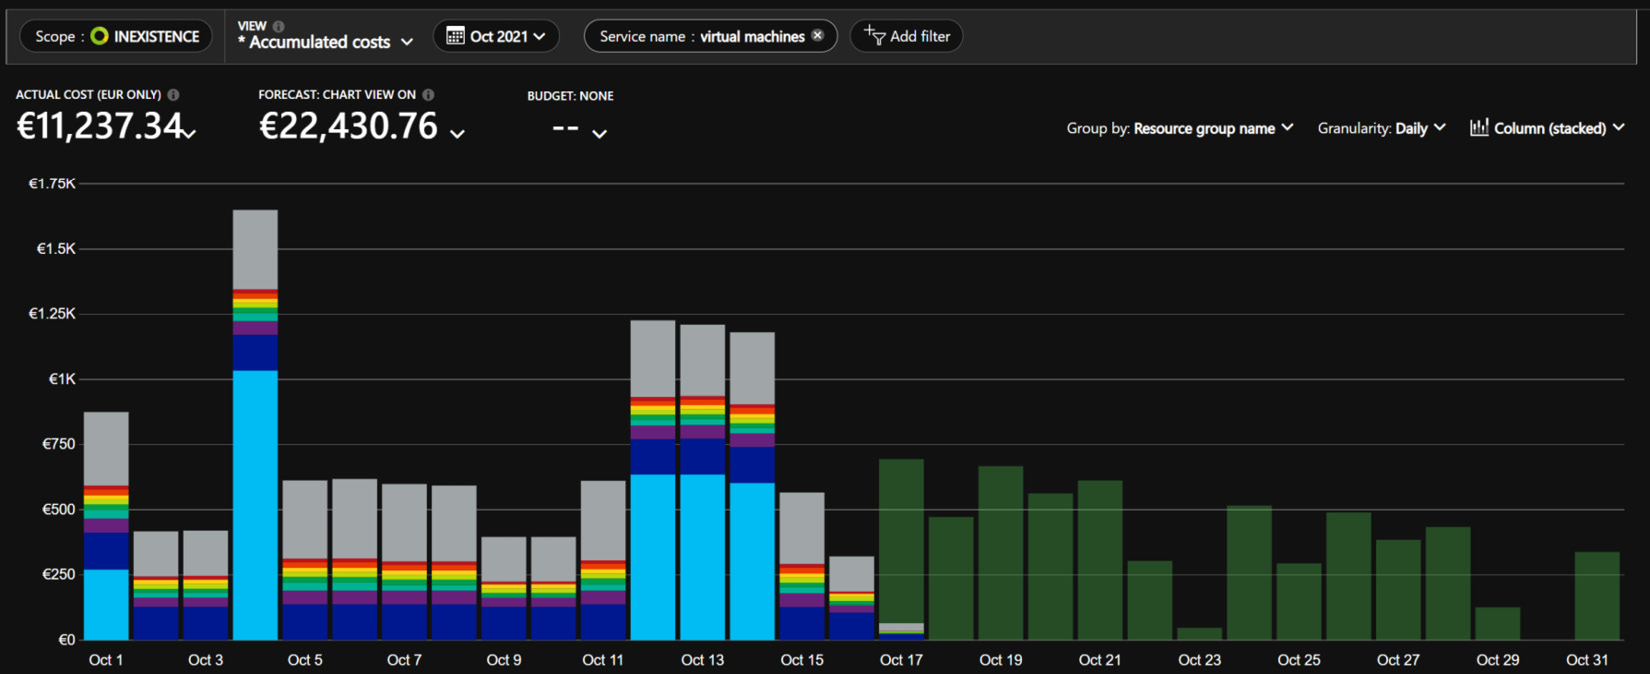
Figure 1.22 – Azure portal: Cost analysis (stacked bar daily view)
This visualization is very useful for period-by-period comparison (for example, with Granularity: Daily, to plot every day in the chosen period).
In the previous screenshot, for example, we can identify and compare the costs of VMs for every resource group; it's very easy to identify the spike and the resource group responsible for the spike.
Spending forecast
Another very useful feature of Azure Cost Management is the analysis of your Azure consumption in the previous period and a calculation of your spending forecast.
The calculated spending for the upcoming future and until the next invoice is typically displayed in a shaded color and will represent your forecasted spending of a future timeframe until the next invoice. Please note you will need at least 10 days of spending data for a forecast to be generated.
Azure and AWS costs
Azure Cost Management allows customers who have a multi-cloud environment to display Amazon Web Services (AWS) costs in the same format as Azure spending. This is done via a management group configuration and will allow consistency in billing reports—for example, to your internal departments, regardless of the cloud used.
For more information about how to configure Azure Cost Management to import AWS account billing information, please refer to the official documentation at https://docs.microsoft.com/en-us/azure/cost-management-billing/costs/aws-integration-set-up-configure.
Amortized versus actual cost
As you open the Cost Management tool, the default view is the ACTUAL COST view, with all the costs and usage made only in the selected period, as illustrated in the following screenshot:
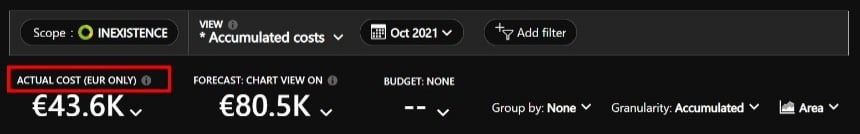
Figure 1.23 – Azure portal: Cost analysis (ACTUAL COST)
Important Note:
Please note that the actual cost will still be a few hours behind the actual resource usage, as mentioned earlier.
If you click on Actual cost, you are presented with an option of changing it to Amortized cost. You can switch to an amortized view by clicking on Amortized cost from the dropdown, as illustrated in the following screenshot:
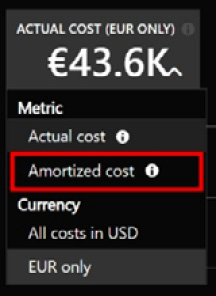
Figure 1.24 – Azure portal: Cost analysis (Amortized cost option)
If you've previously bought upfront reservations, you'll see that the amount will change according to the calculated monthly cost of the upfront reservations.
The following example will clarify this topic.
Let's say you bought, 3 months ago, a VM 1-year pre-paid reservation with a cost of 100 US Dollars (USD) per month, and an upfront payment of 1,200$. The actual and amortized view will be as follows:
- The actual view will show a spend of 1,200$ the day you bought the reservation.
- The amortized view will show a spend of 100$ each month from the month you bought the reservation up to the chosen timeframe.
We will dig deeper into reservations in the following chapters, but for now, this is only needed to understand the Azure portal's different views.
All costs versus usage only
Another very useful filter when you need to separate the cost representation from reservations (both upfront and monthly) is the Charge type filter, which allows you to choose between the following:
- refund: If you refunded a previously bought reservation, you can isolate the refund credit with this filter.
- purchase: All the purchases you made during the period (for example, licenses, reservations both upfront and monthly, and other services).
- usage: The net resource usage, without any kind of reservation purchase(s).
The following screenshot shows the same:
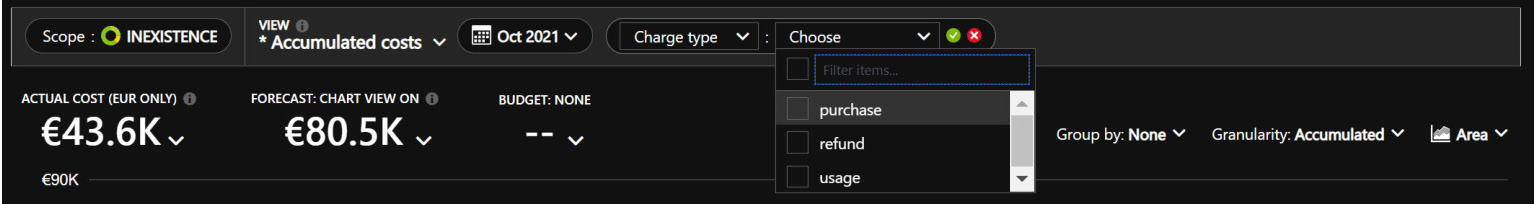
Figure 1.25 – Azure portal: Cost analysis (charge type)
Data export
Every company has its own deck of slides or reports in which you're asked to insert insight and evidence about cloud spending, so you need to export data, tables, or images, and import them into your deck.
There's no need to use the snipping tool: the Azure Cost Management page allows you to export data and graphs in Excel, comma-separated values (CSV), and Portable Network Graphics (PNG) image formats.
You just need to click on the Download icon in the upper bar, as indicated in the following screenshot:

Figure 1.26 – Azure portal: Cost analysis (Download data)
An option section will then appear on the right, as illustrated in the following screenshot:
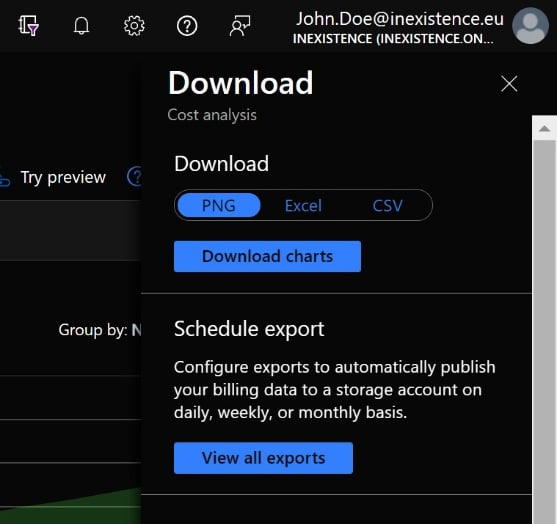
Figure 1.27 – Azure portal: Cost analysis (Download data options)
Here, you can choose the export method (PNG, Excel, or CSV).
Downloading raw data
In the previous method, we learned that the Azure cost control tool is already available for all customers and allows you to understand your costs and the meaning of the various terms such as Service name, Meter category, Meter subcategory, and so on.
This will allow you to explore the costs, but not to integrate this into any of your company's billing dashboards or cost control strategies. Furthermore, Azure cost control does not allow you to customize the data visualization, aggregate service names, or rename labels to export a shared view to management or the cost control division.
Fortunately, there is a way, and Azure has made it quite simple for you. When you download your report file in CSV format, you'll see a complete breakdown of all the charges that were invoiced, per used service.
You can export the raw data in a standard .csv file format, open it with your preferred software, and elaborate upon your personal cost report.
For example, you can aggregate VMs, licenses, disks, and NICs in one macro-category called virtual machines (in the Azure Cost Management tool, you are bound to the predefined categories).
Having all the raw data, it's completely up to you how to aggregate the costs and how to chart them.
Important Note:
Understanding Azure costs starting from the raw CSV data can be difficult for technical people but practical for a cost controller. Consider practicing using Azure Cost Management first, and then double-check your hypothesis on the raw data with Azure Cost Management to ensure your understanding is correct and you're exporting the right cost representation.
To export the raw data, go to the Azure Cost Management page, select the Usage + charges blade in the right menu, and then download the CSV file with the rightmost download icon, as illustrated in the following screenshot:
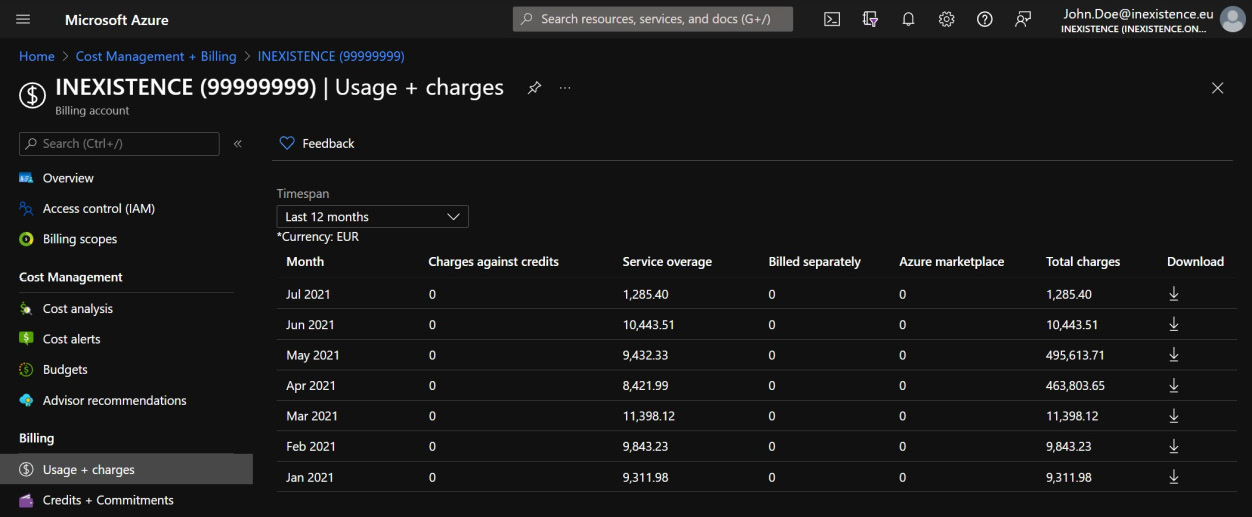
Figure 1.28 – Azure Cost Management: Usage + charges view
If you have an analytics pipeline or data warehouse for cost analysis, you can download CSV files periodically and load them into a cost database to integrate the Azure costs in your cost control system, and implement your personal representation, aligned with your company standard.
Important Note:
Viewing and downloading the cost report in the middle of the billing month period allows you to better control costs (since you must optimize your spending on a daily basis, you should not wait until the end of the month) but I strongly advise you to not to count on the month-to-date export to build the monthly cost by adding each delta, since this may not be so reliable.
A daily export is extremely useful for identifying issues and spikes and behaviors, but the best way to load the final stable view for the monthly spend (corresponding to the invoice) is to wait until at least the second—or, better—the third day of the following month (for example, consolidated, stable raw data from January will be available on February 3). This is due to a delay in processing Azure consumption and different time zones. In my personal experience, the third day of the following month is safe.
Automatically exporting daily costs
If you want to integrate all Azure costs in your company cost control pipeline, a manual daily export to ingest in your cost control system is not practical: you need to automatically have the costs imported into your system.
Azure helps you with the Exports feature, which allows you to schedule an automatic job that exports the CSV file in a storage account. Your cost control system should only download the last CSV file from that storage account and ingest the data automatically.
Just go to the Exports blade—here, you can see the already defined export job or create a new job, as illustrated in the following screenshot:
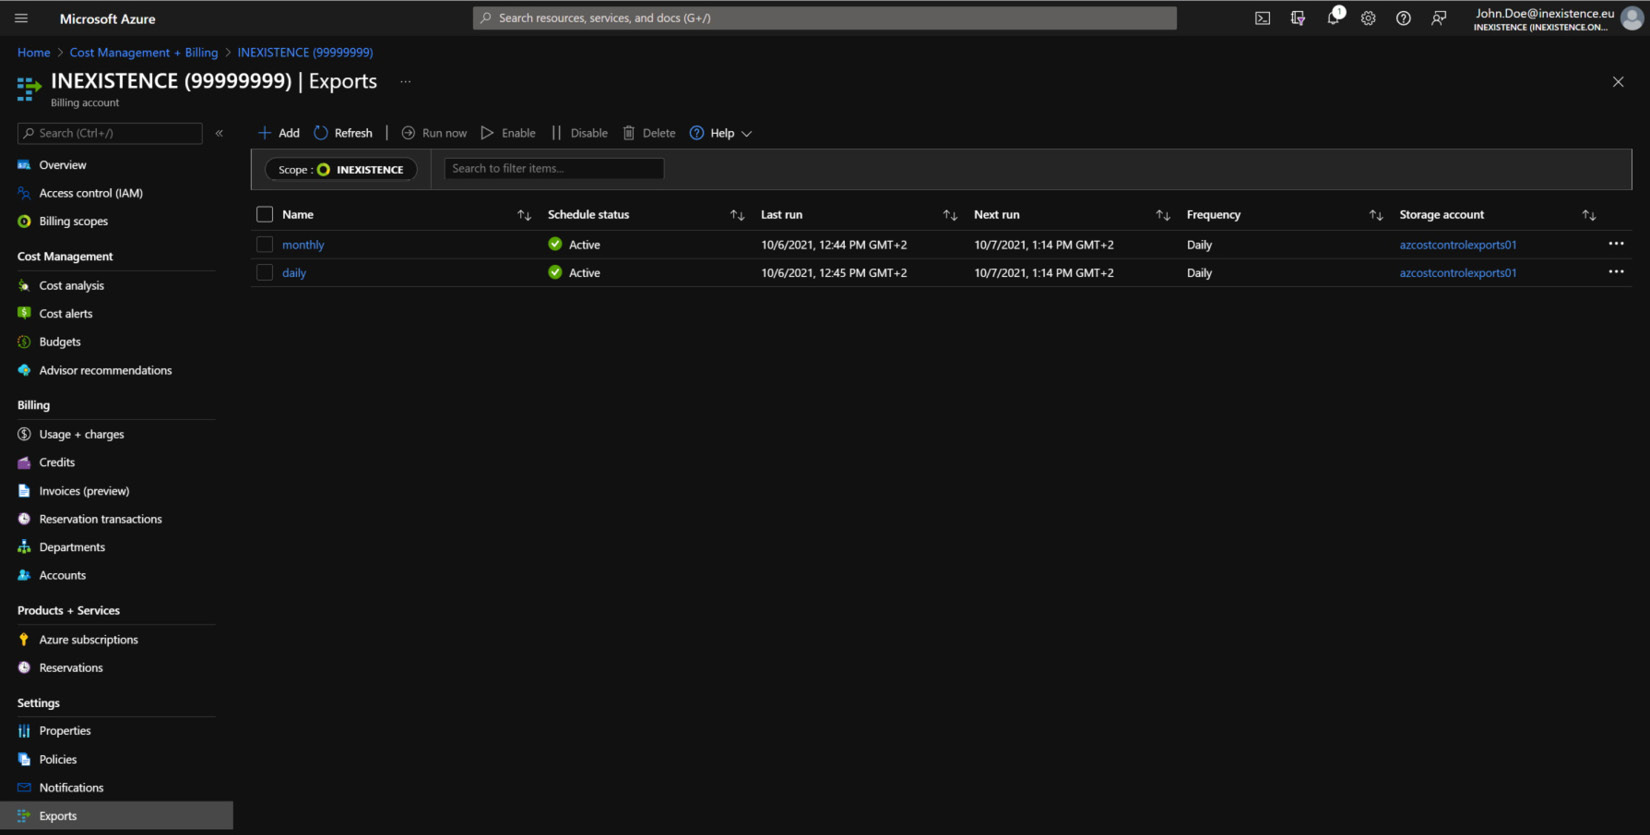
Figure 1.29 – Azure Cost Management (Exports)
To create a new job, you have to click on the + Add button, and then fill out the form displayed, as follows:
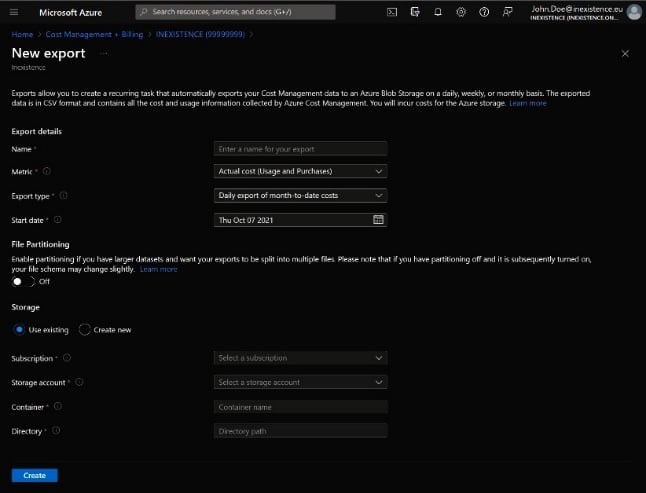
Figure 1.30 – Azure Cost Management (Export options)
Once you named your job, the most important things to set are these:
- Metric: Actual costs (without upfront reservations) or amortized costs (with the monthly cost of the upfront reservation)
- Export type: Daily export (month-to-date); weekly report (last 7 days), monthly report (last month's costs); one-time report
Other fields let you point the export job to the right storage account, using an existing one or creating a new one, but the most important ones are these two.
Hint: I suggest implementing two exports, as follows:
- Actual costs; daily export: To have Azure consumption with monthly reservation and Azure usage costs
- Amortized costs; daily export: To have Azure consumption with upfront reservation too, in order to know (by difference) the amount of upfront reservation monthly
Important Note:
With your tagging strategy if you need to represent costs by custom tags, you'll find a field named Tags in the exported CSV file, with a JavaScript Object Notation (JSON) data structure with all the tags (the ones you added and other service tags, normally hidden).
Using the command-line interface
Another way to get Azure detailed costs is the command-line interface (CLI) (both the PowerShell and the Linux AZ CLI). This is a very interesting option to easily generate reports that you can send to key people, directly with simple batch files, without having to struggle with exporting from Azure, importing the CSV file into a database, and configuring a business intelligence (BI) tool.
Tip:
To install the previously mentioned tools, please refer to the official documentation for the Azure CLI (https://docs.microsoft.com/en-us/cli/azure/install-azure-cli) and PowerShell (https://docs.microsoft.com/en-us/powershell/azure/install-az-ps?view=azps-6.5.0).
Please note that using the Azure CLI (fired within the web browser, from the portal) will incur costs derived from the storage you use and the data transfers, for it to work. Using the Azure Cloud Shell will always have the latest tools available for Azure CLI and PowerShell. Since you need to login through the browser to use the cloud shell, your session is always authenticated. There is a very minimal charge for the static data stored in directories in cloud shell, which uses a storage account in Azure.
The documentation starting points are listed here:
- AZ CLI—Billing (https://docs.microsoft.com/en-us/cli/azure/costmanagement): Lets you manage invoices, billing profiles and details, configure roles for users, list products for billing account, and so on
- AZ CLI—Consumption (https://docs.microsoft.com/en-us/cli/azure/consumption): Lets you manage usage details, reservations, and budgets, and view price sheets
- AZ CLI—Cost management (https://docs.microsoft.com/en-us/cli/azure/costmanagement): Lets you manage Azure Cost Management exports (refer to the Automatically export daily cost section)
- PowerShell (https://docs.microsoft.com/en-us/powershell/module/az.billing)
Though the official documentation may point out a lot of different parameters and queries for managing the cost control by command line, I will focus your attention on a couple of commands for extracting and managing the usage details.
Let's focus on the consumption subcommands, which allow us to download information on currently generated costs on our account.
Here are some AZ CLI examples.
To get Azure usage details for a specific period (a day or a month in the past), you can use the following command:
az consumption usage list --include-meter-details --include-
additional-properties --start-date 2020-10-01
--end-date 2020-10-02
This command will return JSON with useful information (among other useful information) such as the location, instance ID, subscription, resource group, and net costs (without taxes). This command is supported only with EA, Web Direct, and MCA offer types.
Important Note:
If you prefer to have the output in a tab-separated values (TSV) format, you may add --output tsv in the command line, but you'll lose any nested information. Please try executing the command for the JSON and TSV formats and compare the output: you'll find that the JSON format is far more detailed than the other one.
Important things to keep in mind are listed here:
- The command line allows you to have the net prices.
- The command line allows you to specify a period start/end date.
- The command line allows you to get the top N spending resources.
So, it's very useful to have a quick overview of the costs and to work directly in batch scripting, but it's not comprehensive and it does not represent the final invoice.
Please note that on the tagging strategy, you'll find a JSON element with all the instance tags. This information is lost in the TSV format.
Using application programming interfaces
If you want to better control data ingestion, instead of downloading a CSV and ingesting it in your cost control system, you can do it programmatically by using application programming interfaces (APIs). Microsoft has different APIs that let you download the billing details, forecast, budget, and so on.
The main documentation entry point is https://docs.microsoft.com/en-us/rest/api/consumption/: this is where you should start reading documentation about REpresentational State Transfer (REST) entry point(s) you need to invoke to get useful information about your billing, such as the following:
- Usage details—the full CSV or JSON structure for the billing of the desired period (this allows you to customize the period start and end dates)
- Reservation details
- Pricelist
- Budgets
- Forecasts (only for Enterprise customers)
In addition, at the https://docs.microsoft.com/en-us/rest/api/billing/ link, you will find information about other operations on billing objects (for example, transfer billing ownership, payment methods, and so on). Usually, if you're searching for a way to control your costs and integrate the costs in your pipeline, this is not the first point from where you should start.
Important Note:
If you searched online, you may find old Reporting APIs (https://docs.microsoft.com/it-it/rest/api/billing/enterprise/billing-enterprise-api-usage-detail). Despite being officially discontinued, they still work, but we recommend avoiding these APIs for building an injection.
As you can see from the official documentation, using APIs allows you to deeply integrate billing data into your dashboard and cost management software, but it may be a little complex at the beginning, considering you don't know what to expect from each API and you'll probably end up searching in different exports for missing billing details you're desperately seeking.
Question 10: But APIs are a bit complex—why are they so useful?
Unfortunately, there is no simple answer, but APIs are generally very smart for integrating analysis, feedback, and decisions based on an external tool. Just think about an enterprise that uses an integrated authorization flow for any action that could generate costs: creating a VM will generate costs, adding a disk generates costs, creating a new SQL database or an Azure Kubernetes cluster generates costs, and all should be authorized internally.
Your company probably has a centralized governance team that can provide users with internal processes that automate the provisioning of cloud resources. So, everyone should compile some form in a software tool to ask and wait for approval, which will then trigger deployment. The tool will use APIs to start the resource creation process in an automated fashion.
The same applies to buying reserved instances or to cost accounting inside the enterprise: you might need to extract costs based on the department or management group.
Important Note:
You cannot perform this kind of operation without using APIs: it's the only way to integrate Azure actions and extractions, programmatically, to an already existing software (generally an enterprise-scale software).
In the end, please keep in mind that Microsoft itself suggests you use the method we discussed in the Automatically exporting daily costs section for large data handling in its official documentation, which can be found at https://docs.microsoft.com/en-us/azure/cost-management-billing/costs/manage-automation.
In conclusion, my personal suggestion is to start from the first method—the Azure Cost Management online web page—to better understand the terminology and how costs are grouped and exported by Azure.
The next step will be downloading a full monthly invoice, opening it with your preferred spreadsheet, and studying each row, eventually pivoting and comparing what you find in the CSV file and what you've found with the Azure Cost Management tool. Then, you can import the CSV file into a database (a simple open source database is more than enough) and start querying the database, grouping results, and constructing tables to translate the technical terms into something more understandable for non-technical people (such as cost controllers or C-levels).
One more step in automating cost control ingestion is to schedule one or more exports and download the file(s) from the target storage account.
The last, more complex but extremely flexible way to integrate cost management and implement a feedback loop is to use the Consumption and Billing APIs. Once you have your fully automated database ingestion, custom tables, and whatever you need to customize cost representation, you can build your own BI dashboard on it and master cost control.
Summary
In this chapter, we have worked on how Azure bills consumption on several different services in order to understand the invoice at the end of the month. We started with defining what the possible billing types are, then proceeded to the Azure pricing online page, which allows you to foresee and understand how each service is billed and charged. We learned how to price a few key services: VMs, App Service, Cosmos DB, and Azure Functions, which all have very different policies and frequencies of billing.
We then moved to the Azure portal Cost Management section and provided a few useful views that can give you relevant information, and learned how to export the preferred views in the possible formats. We considered API options as a source of billing information, although this book will be focused primarily on the information available through the Azure portal.
In the next chapter, we will focus on how you intend to manage cloud costs and how this can be configured and automated with the available Azure tools.
Further reading
- Management groups and hierarchy: https://docs.microsoft.com/en-us/azure/cloud-adoption-framework/ready/azure-setup-guide/organize-resources?tabs=AzureManagementGroupsAndHierarchy
- Well-Architected Framework: https://docs.microsoft.com/en-us/azure/architecture/framework/
- Cloud Adoption Framework: https://docs.microsoft.com/en-us/azure/cloud-adoption-framework/
- Azure cost analysis: https://docs.microsoft.com/en-us/azure/cost-management-billing/costs/quick-acm-cost-analysis
