Download code from GitHub
Autoscaling Deployments and StatefulSets Based on Resource Usage
- Spock
By now, you probably understood that one of the critical aspects of a system based on Kubernetes is a high level of dynamism. Almost nothing is static. We define Deployments or StatefulSets, and Kubernetes distributes the Pods across the cluster. In most cases, those Pods are rarely sitting in one place for a long time. Rolling updates result in Pods being re-created and potentially moved to other nodes. Failure of any kind provokes rescheduling of the affected resources. Many other events cause the Pods to move around. A Kubernetes cluster is like a beehive. It's full of life, and it's always in motion.
Dynamic nature of a Kubernetes cluster is not only due to our (human) actions or rescheduling caused by failures. Autoscaling is to be blamed as well. We should fully embrace Kubernetes' dynamic nature and move towards autonomous and self-sufficient clusters capable of serving the needs of our applications without (much) human involvement. To accomplish that, we need to provide sufficient information that will allow Kubernetes' to scale the applications as well as the nodes that constitute the cluster. In this chapter, we'll focus on the former case. We'll explore commonly used and basic ways to auto-scale Pods based on memory and CPU consumption. We'll accomplish that using HorizontalPodAutoscaler.
HorizontalPodAutoscaler is implemented as a Kubernetes API resource and a controller. The resource determines the behavior of the controller. The controller periodically adjusts the number of replicas in a StatefulSet or a Deployment to match the observed average CPU utilization to the target specified by a user.
We'll see HorizontalPodAutoscaler in action soon and comment on its specific features through practical examples. But, before we get there, we need a Kubernetes cluster as well as a source of metrics.
Creating a cluster
Before we create a cluster (or start using one you already have available), we'll clone the vfarcic/k8s-specs (https://github.com/vfarcic/k8s-specs) repository which contains most of the definitions we'll use in this book.
Please execute all the commands from this book from Git Bash. That way, you'll be able to run them as they are instead of modifying their syntax to adapt them to Windows terminal or PowerShell.
 1  git clone https://github.com/vfarcic/k8s-specs.git
 2
 3  cd k8s-specs
If you cloned the repository before, please make sure that you have the latest version by executing git pull.
The gists and the specifications that follow are used to test the commands in this chapter. Please use them as inspiration when creating your own test cluster or to validate that the one you're planning to use for the exercises meets the minimum requirements.
- docker-scale.sh: Docker for Desktop with 2 CPUs, 2 GB RAM and with tiller (https://gist.github.com/vfarcic/ca52ff97fc80565af0c46c37449babac).
- minikube-scale.sh: minikube with 2 CPUs, 2 GB RAM and with tiller (https://gist.github.com/vfarcic/5bc07d822f8825263245829715261a68).
- gke-scale.sh: GKE with 3 n1-standard-1 worker nodes and with tiller (https://gist.github.com/vfarcic/9c777487f7ebee6c09027d3a1df8663c).
- eks-scale.sh: EKS with 3 t2.small worker nodes and with tiller (https://gist.github.com/vfarcic/a94dffef7d6dc60f79570d351c92408d).
- aks-scale.sh: AKS with 3 Standard_B2s worker nodes and with tiller (https://gist.github.com/vfarcic/f1b05d33cc8a98e4ceab3d3770c2fe0b).
Please note that we will use Helm to install necessary applications, but we'll switch to "pure" Kubernetes YAML for experimenting with (probably new) resources used in this chapter and for deploying the demo application. In other words, we'll use Helm for one-time installations (for example, Metrics Server) and YAML for things we'll explore in more detail (for example, HorizontalPodAutoscaler).
Now, let's talk about Metrics Server.
Observing Metrics Server data
The critical element in scaling Pods is the Kubernetes Metrics Server. You might consider yourself a Kubernetes ninja and yet never heard of the Metrics Server. Don't be ashamed if that's the case. You're not the only one.
If you started observing Kubernetes metrics, you might have used Heapster. It's been around for a long time, and you likely have it running in your cluster, even if you don't know what it is. Both serve the same purpose, with one being deprecated for a while, so let's clarify things a bit.
Early on, Kubernetes introduced Heapster as a tool that enables Container Cluster Monitoring and Performance Analysis for Kubernetes. It's been around since Kubernetes version 1.0.6. You can say that Heapster has been part of Kubernetes' life since its toddler age. It collects and interprets various metrics like resource usage, events, and so on. Heapster has been an integral part of Kubernetes and enabled it to schedule Pods appropriately. Without it, Kubernetes would be blind. It would not know which node has available memory, which Pod is using too much CPU, and so on. But, just as with most other tools that become available early, its design was a "failed experiment".
As Kubernetes continued growing, we (the community around Kubernetes) started realizing that a new, better, and, more importantly, a more extensible design is required. Hence, Metrics Server was born. Right now, even though Heapster is still in use, it is considered deprecated, even though today (September 2018) the Metrics Server is still in beta state.
So, what is Metrics Server? A simple explanation is that it collects information about used resources (memory and CPU) of nodes and Pods. It does not store metrics, so do not think that you can use it to retrieve historical values and predict tendencies. There are other tools for that, and we'll explore them later. Instead, Metrics Server's goal is to provide an API that can be used to retrieve current resource usage. We can use that API through kubectl or by sending direct requests with, let's say, curl. In other words, Metrics Server collects cluster-wide metrics and allows us to retrieve them through its API. That, by itself, is very powerful, but it is only the part of the story.
I already mentioned extensibility. We can extend Metrics Server to collect metrics from other sources. We'll get there in due time. For now, we'll explore what it provides out of the box and how it interacts with some other Kubernetes resources that will help us make our Pods scalable and more resilient.
If you read my other books, you know that I do not go into much theory and, instead, prefer demonstrating features and principles through practical examples. This book is no exception, and we'll dive straight into Metrics Server hands-on exercises. The first step is to install it.
Helm makes installation of almost any publicly available software very easy if there is a Chart available. If there isn't, you might want to consider an alternative since that is a clear indication that the vendor or the community behind it does not believe in Kubernetes. Or, maybe they do not have the skills necessary to develop a Chart. Either way, the best course of action is to run away from it and adopt an alternative. If that's not an option, develop a Helm Chart yourself. In our case, there won't be a need for such measures. Metrics Server does have a Helm Chart, and all we need to do is to install it.
Google and Microsoft already ship Metrics Server as part of their managed Kubernetes clusters (GKE and AKS). There is no need to install it, so please skip the commands that follow.
Metrics Server is available as one of the plugins. Please execute minikube addons enable metrics-server and kubectl -n kube-system rollout status deployment metrics-server commands instead of those following.
Recent updates to the Metrics Server do not work with self-signed certificates by default. Since Docker for Desktop uses such certificates, you'll need to allow insecure TLS. Please add --set args={"--kubelet-insecure-tls=true"} argument to the helm install command that follows.
 1  helm install stable/metrics-server \
 2      --name metrics-server \
 3      --version 2.0.2 \
 4      --namespace metrics
 5
 6  kubectl -n metrics \
 7      rollout status \
 8      deployment metrics-server
We used Helm to install Metrics Server, and we waited until it rolled out.
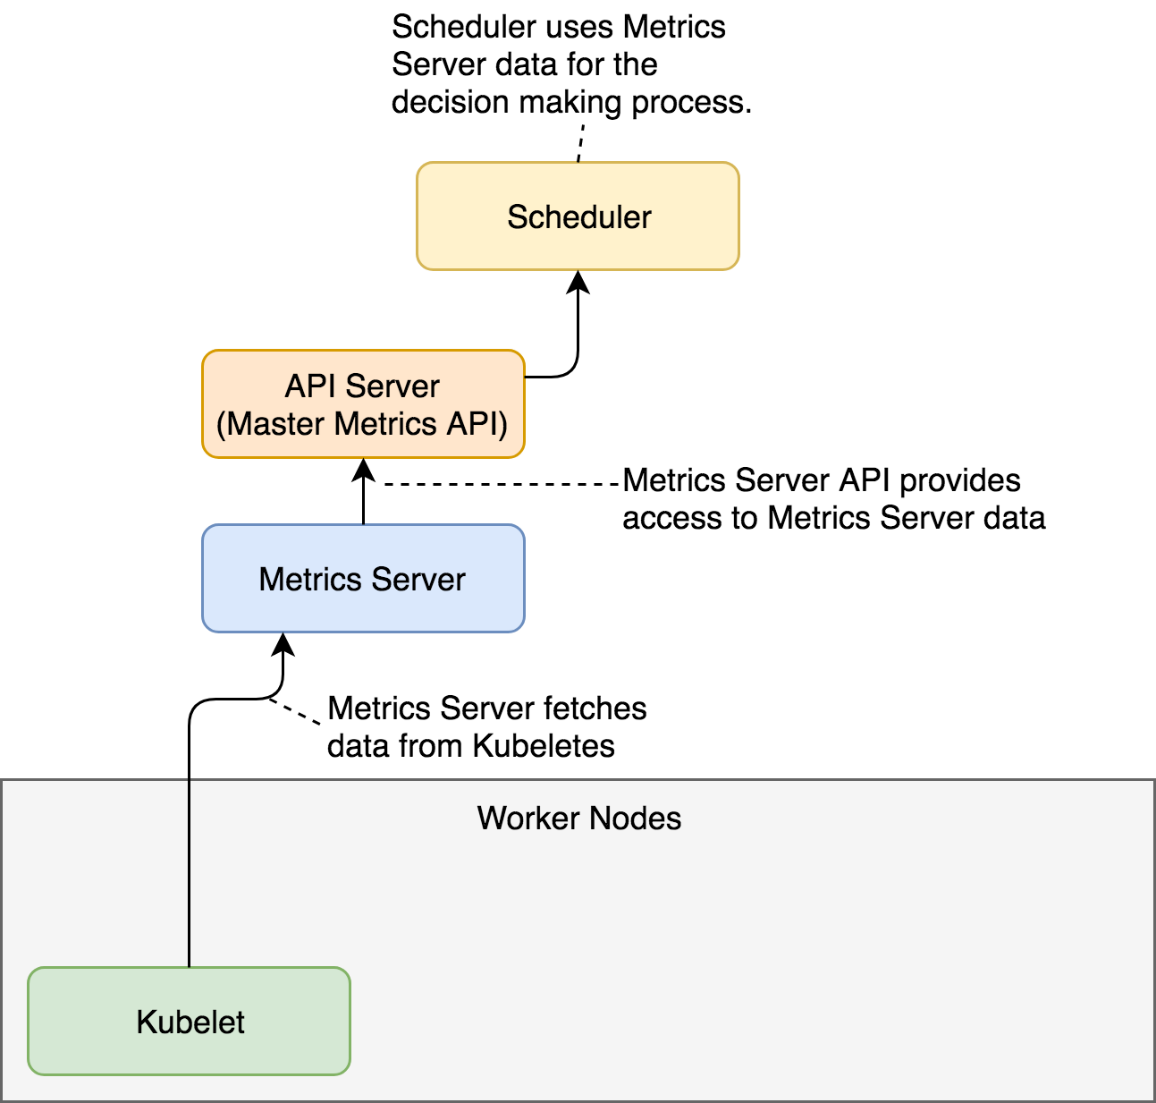
Metrics Server will periodically fetch metrics from Kubeletes running on the nodes. Those metrics, for now, contain memory and CPU utilization of the Pods and the nodes. Other entities can request data from the Metrics Server through the API Server which has the Master Metrics API. An example of those entities is the Scheduler that, once Metrics Server is installed, uses its data to make decisions.
As you will see soon, the usage of the Metrics Server goes beyond the Scheduler but, for now, the explanation should provide an image of the basic flow of data.
Now we can explore one of the ways we can retrieve the metrics. We'll start with those related to nodes.
1 kubectl top nodes
If you were fast, the output should state that metrics are not available yet. That's normal. It takes a few minutes before the first iteration of metrics retrieval is executed. The exception is GKE and AKS that already come with the Metrics Server baked in.
Fetch some coffee before we repeat the command.
1 kubectl top nodes
This time, the output is different.
My output is as follows.
NAME               CPU(cores) CPU% MEMORY(bytes) MEMORY%
docker-for-desktop 248m       12%  1208Mi        63%
We can see that I have one node called docker-for-desktop. It is using 248 CPU milliseconds. Since the node has two cores, that's 12% of the total available CPU. Similarly, 1.2 GB of RAM is used, which is 63% of the total available memory of 2 GB.
Resource usage of the nodes is useful but is not what we're looking for. In this chapter, we're focused on auto-scaling Pods. But, before we get there, we should observe how much memory each of our Pods is using. We'll start with those running in the kube-system Namespace.
1 kubectl -n kube-system top pod
The output (on Docker for Desktop) is as follows.
NAME                                       CPU(cores) MEMORY(bytes)
etcd-docker-for-desktop                    16m        74Mi
kube-apiserver-docker-for-desktop          33m        427Mi
kube-controller-manager-docker-for-desktop 44m        63Mi
kube-dns-86f4d74b45-c47nh                  1m         39Mi
kube-proxy-r56kd                           2m         22Mi
kube-scheduler-docker-for-desktop          13m        23Mi
tiller-deploy-5c688d5f9b-2pspz             0m         21Mi
We can see resource usage (CPU and memory) for each of the Pods currently running in kube-system. If we do not find better tools, we could use that information to adjust requests of those Pods to be more accurate. However, there are better ways to get that info, so we'll skip adjustments for now. Instead, let's try to get current resource usage of all the Pods, no matter the Namespace.
1 kubectl top pods --all-namespaces
The output (on Docker for Desktop) is as follows.
NAMESPACE   NAME                                       CPU(cores) MEMORY(bytes)
docker      compose-7447646cf5-wqbwz                   0m         11Mi
docker      compose-api-6fbc44c575-gwhxt               0m         14Mi
kube-system etcd-docker-for-desktop                    16m        74Mi
kube-system kube-apiserver-docker-for-desktop          33m        427Mi
kube-system kube-controller-manager-docker-for-desktop 46m        63Mi
kube-system kube-dns-86f4d74b45-c47nh                  1m         38Mi
kube-system kube-proxy-r56kd                           3m         22Mi
kube-system kube-scheduler-docker-for-desktop          14m        23Mi
kube-system tiller-deploy-5c688d5f9b-2pspz             0m         21Mi
metrics     metrics-server-5d78586d76-pbqj8            0m         10Mi
That output shows the same information as the previous one, only extended to all Namespaces. There should be no need to comment it.
Often, metrics of a Pod are not granular enough, and we need to observe the resources of each of the containers that constitute a Pod. All we need to do to get container metrics is to add --containers argument.
 1  kubectl top pods \
 2    --all-namespaces \
 3    --containers
The output (on Docker for Desktop) is as follows.
NAMESPACE   POD                                        NAME                 CPU(cores) MEMORY(bytes)
docker      compose-7447646cf5-wqbwz                   compose                 0m         11Mi
docker      compose-api-6fbc44c575-gwhxt               compose                 0m         14Mi
kube-system etcd-docker-for-desktop                    etcd                    16m        74Mi
kube-system kube-apiserver-docker-for-desktop          kube-apiserver          33m        427Mi
kube-system kube-controller-manager-docker-for-desktop kube-controller-manager 46m        63Mi
kube-system kube-dns-86f4d74b45-c47nh                  kubedns                 0m         13Mi
kube-system kube-dns-86f4d74b45-c47nh                  dnsmasq                 0m         10Mi
kube-system kube-dns-86f4d74b45-c47nh                  sidecar                 1m         14Mi
kube-system kube-proxy-r56kd                           kube-proxy              3m         22Mi
kube-system kube-scheduler-docker-for-desktop          kube-scheduler          14m        23Mi
kube-system tiller-deploy-5c688d5f9b-2pspz             tiller                  0m         21Mi
metrics     metrics-server-5d78586d76-pbqj8            metrics-server          0m         10Mi
We can see that, this time, the output shows each container separately. We can, for example, observe metrics of the kube-dns-* Pod separated into three containers (kubedns, dnsmasq, sidecar).
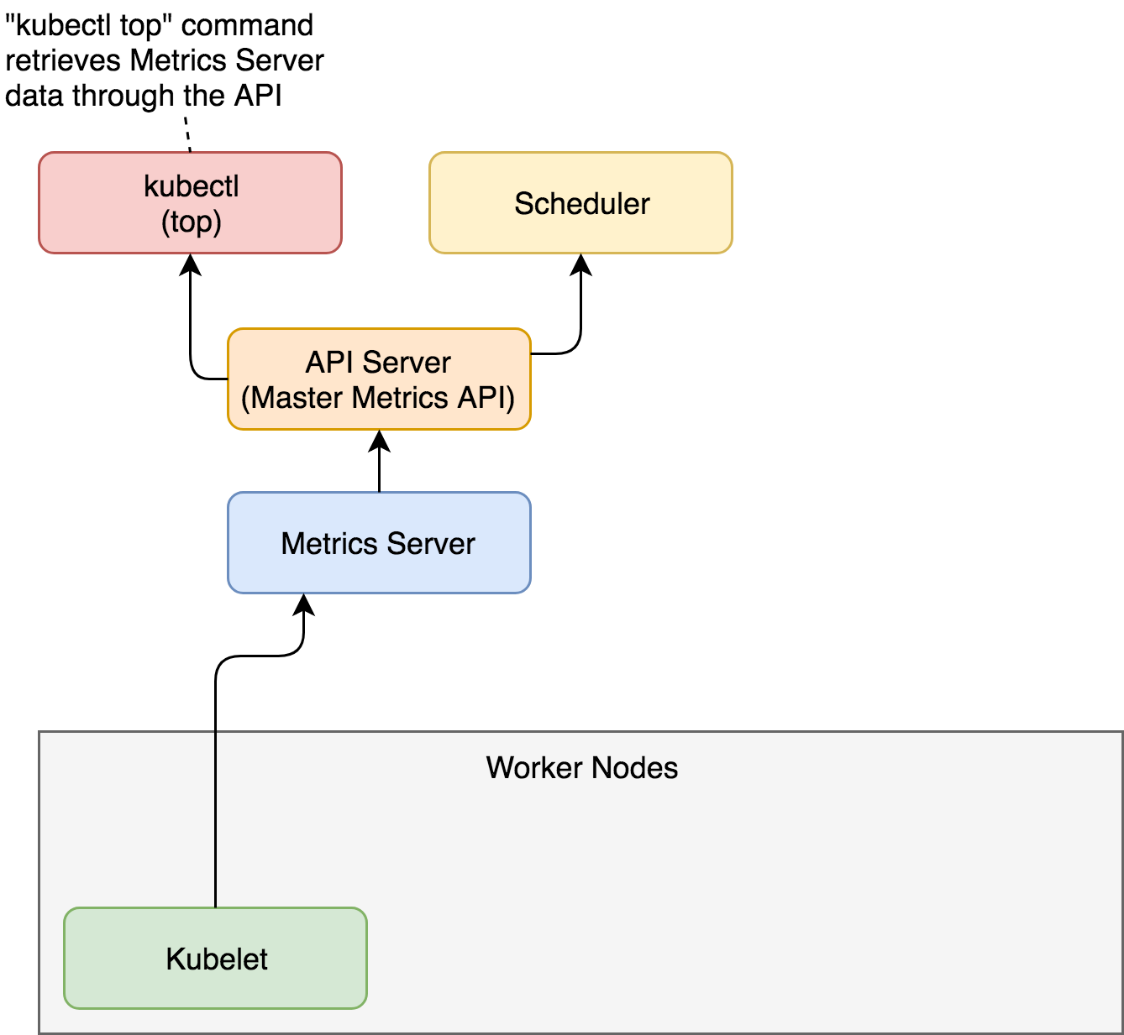
When we request metrics through kubectl top, the flow of data is almost the same as when the scheduler makes requests. A request is sent to the API Server (Master Metrics API), which gets data from the Metrics Server which, in turn, was collecting information from Kubeletes running on the nodes of the cluster.
While kubectl top command is useful to observe current metrics, it is pretty useless if we'd like to access them from other tools. After all, the goal is not for us to sit in front of a terminal with watch "kubectl top pods" command. That would be a waste of our (human) talent. Instead, our goal should be to scrape those metrics from other tools and create alerts and (maybe) dashboards based on both real-time and historical data. For that, we need output in JSON or some other machine-parsable format. Luckily, kubectl allows us to invoke its API directly in raw format and retrieve the same result as if a tool would query it.
 1  kubectl get \
 2      --raw "/apis/metrics.k8s.io/v1beta1" \
 3      | jq '.'
The output is as follows.
{
  "kind": "APIResourceList",
  "apiVersion": "v1",
  "groupVersion": "metrics.k8s.io/v1beta1",
  "resources": [
    {
      "name": "nodes",
      "singularName": "",
      "namespaced": false,
      "kind": "NodeMetrics",
      "verbs": [
        "get",
        "list"
      ]
    },
    {
      "name": "pods",
      "singularName": "",
      "namespaced": true,
      "kind": "PodMetrics",
      "verbs": [
        "get",
        "list"
      ]
    }
  ]
}
We can see that the /apis/metrics.k8s.io/v1beta1 endpoint is an index API that has two resources (nodes and pods).
Let's take a closer look at the pods resource of the metrics API.
 1  kubectl get \
 2      --raw "/apis/metrics.k8s.io/v1beta1/pods" \
 3      | jq '.'
The output is too big to be presented in a book, so I'll leave it up to you to explore it. You'll notice that the output is JSON equivalent of what we observed through the kubectl top pods --all-namespaces --containers command.
That was a rapid overview of the Metrics Server. There are two important things to note. First of all, it provides current (or short-term) memory and CPU utilization of the containers running inside a cluster. The second and the more important note is that we will not use it directly. Metrics Server was not designed for humans but for machines. We'll get there later. For now, remember that there is a thing called Metrics Server and that you should not use it directly (once you adopt a tool that will scrape its metrics).
Now that we explored Metrics Server, we'll try to put it to good use and learn how to auto-scale our Pods based on resource utilization.
Auto-scaling Pods based on resource utilization
Our goal is to deploy an application that will be automatically scaled (or de-scaled) depending on its use of resources. We'll start by deploying an app first, and discuss how to accomplish auto-scaling later.
Let's take a look at a definition of the application we'll use in our examples.
1 cat scaling/go-demo-5-no-sidecar-mem.yml
If you are familiar with Kubernetes, the YAML definition should be self-explanatory. We'll comment only the parts that are relevant for auto-scaling.
The output, limited to the relevant parts, is as follows.
...
apiVersion: apps/v1
kind: StatefulSet
metadata:
  name: db
  namespace: go-demo-5
spec:
  ...
  template:
    ...
    spec:
      ...
      containers:
      - name: db
        ...
        resources:
          limits:
            memory: "150Mi"
            cpu: 0.2
          requests:
            memory: "100Mi"
            cpu: 0.1
        ...
      - name: db-sidecar
        ...

apiVersion: apps/v1
kind: Deployment
metadata:
  name: api
  namespace: go-demo-5
spec:
  ...
  template:
    ...
    spec:
      containers:
      - name: api
        ...
        resources:
          limits:
            memory: 15Mi
            cpu: 0.1
          requests:
            memory: 10Mi
            cpu: 0.01
...
We have two Pods that form an application. The api Deployment is a backend API that uses db StatefulSet for its state.
The essential parts of the definition are resources. Both the api and the db have requests and limits defined for memory and CPU. The database uses a sidecar container that will join MongoDB replicas into a replica set. Please note that, unlike other containers, the sidecar does not have resources. The importance behind that will be revealed later. For now, just remember that two containers have the requests and the limits defined, and that one doesn't.
Now, let's create those resources.
 1  kubectl apply \
 2      -f scaling/go-demo-5-no-sidecar-mem.yml \
 3      --record
The output should show that quite a few resources were created and our next action is to wait until the api Deployment is rolled out thus confirming that the application is up-and-running.
 1  kubectl -n go-demo-5 \
 2      rollout status \
 3      deployment api
After a few moments, you should see the message stating that deployment "api" was successfully rolled out.
To be on the safe side, we'll list the Pods in the go-demo-5 Namespace and confirm that one replica of each is running.
1 kubectl -n go-demo-5 get pods
The output is as follows.
NAME    READY STATUS  RESTARTS AGE
api-... 1/1   Running 0        1m
db-0    2/2   Running 0        1m
So far, we did not yet do anything beyond the ordinary creation of the StatefulSet and the Deployment.
They, in turn, created ReplicaSets, which resulted in the creation of the Pods.

As you hopefully know, we should aim at having at least two replicas of each Pod, as long as they are scalable. Still, neither of the two had replicas defined. That is intentional. The fact that we can specify the number of replicas of a Deployment or a StatefulSet does not mean that we should. At least, not always.
Let's take a look at a simple example of a HorizontalPodAutoscaler.
1 cat scaling/go-demo-5-api-hpa.yml
The output is as follows.
apiVersion: autoscaling/v2beta1
kind: HorizontalPodAutoscaler
metadata:
  name: api
  namespace: go-demo-5
spec:
  scaleTargetRef:
    apiVersion: apps/v1
    kind: Deployment
    name: api
  minReplicas: 2
  maxReplicas: 5
  metrics:
  - type: Resource
    resource:
      name: cpu
      targetAverageUtilization: 80
  - type: Resource
    resource:
      name: memory
      targetAverageUtilization: 80
The definition uses HorizontalPodAutoscaler targeting the api Deployment. Its boundaries are the minimum of two and the maximum of five replicas. Those limits are fundamental. Without them, we'd run a risk of scaling up into infinity or scaling down to zero replicas. The minReplicas and maxReplicas fields are a safety net.
The key section of the definition is metrics. It provides formulas Kubernetes should use to decide whether it should scale (or de-scale) a resource. In our case, we're using the Resource type entries. They are targeting average utilization of eighty percent for memory and CPU. If the actual usage of the either of the two deviates, Kubernetes will scale (or de-scale) the resource.
Please note that we used v2beta1 version of the API and you might be wondering why we chose that one instead of the stable and production ready v1. After all, beta1 releases are still far from being polished enough for general usage. The reason is simple. HorizontalPodAutoscaler v1 is too basic. It only allows scaling based on CPU. Even our simple example goes beyond that by adding memory to the mix. Later on, we'll extend it even more. So, while v1 is considered stable, it does not provide much value, and we can either wait until v2 is released or start experimenting with v2beta releases right away. We're opting for the latter option. By the time you read this, more stable releases are likely to exist and to be supported in your Kubernetes cluster. If that's the case, feel free to change apiVersion before applying the definition.
Now let's apply it.
 1  kubectl apply \
 2      -f scaling/go-demo-5-api-hpa.yml \
 3      --record
We applied the definition that created the HorizontalPodAutoscaler (HPA). Next, we'll take a look at the information we'll get by retrieving the HPA resources.
1 kubectl -n go-demo-5 get hpa
If you were quick, the output should be similar to the one that follows.
NAME REFERENCE      TARGETS                      MINPODS MAXPODS REPLICAS AGE
api  Deployment/api <unknown>/80%, <unknown>/80% 2       5       0        20s
We can see that Kubernetes does not yet have the actual CPU and memory utilization and that it output <unknown> instead. We need to give it a bit more time until the next iteration of data gathering from the Metrics Server. Get yourself some coffee before we repeat the same query.
1 kubectl -n go-demo-5 get hpa
This time, the output is without unknowns.
NAME REFERENCE      TARGETS          MINPODS MAXPODS REPLICAS AGE
api  Deployment/api 38%/80%, 10%/80% 2       5       2        1m
We can see that both CPU and memory utilization are way below the expected utilization of 80%. Still, Kubernetes increased the number of replicas from one to two because that's the minimum we defined. We made the contract stating that the api Deployment should never have less than two replicas, and Kubernetes complied with that by scaling up even if the resource utilization is way below the expected average utilization. We can confirm that behavior through the events of the HorizontalPodAutoscaler.
1 kubectl -n go-demo-5 describe hpa api
The output, limited to the event messages, is as follows.
...
Events:
... Message
... -------
... New size: 2; reason: Current number of replicas below Spec.MinReplicas
The message of the event should be self-explanatory. The HorizontalPodAutoscaler changed the number of replicas to 2 because the current number (1) was below the MinReplicas value.
Finally, we'll list the Pods to confirm that the desired number of replicas is indeed running.
1 kubectl -n go-demo-5 get pods
The output is as follows.
NAME    READY STATUS  RESTARTS AGE
api-... 1/1   Running 0        2m
api-... 1/1   Running 0        6m
db-0    2/2   Running 0        6m
So far, the HPA did not yet perform auto-scaling based on resource usage. Instead, it only increased the number of Pod to meet the specified minimum. It did that by manipulating the Deployment.

Next, we'll try to create another HorizontalPodAutoscaler but, this time, we'll target the StatefulSet that runs our MongoDB. So, let's take a look at yet another YAML definition.
1 cat scaling/go-demo-5-db-hpa.yml
The output is as follows.
apiVersion: autoscaling/v2beta1
kind: HorizontalPodAutoscaler
metadata:
  name: db
  namespace: go-demo-5
spec:
  scaleTargetRef:
    apiVersion: apps/v1
    kind: StatefulSet
    name: db
  minReplicas: 3
  maxReplicas: 5
  metrics:
  - type: Resource
    resource:
      name: cpu
      targetAverageUtilization: 80
  - type: Resource
    resource:
      name: memory
      targetAverageUtilization: 80
That definition is almost the same as the one we used before. The only difference is that this time we're targeting StatefulSet called db and that the minimum number of replicas should be 3.
Let's apply it.
 1  kubectl apply \
 2      -f scaling/go-demo-5-db-hpa.yml \
 3      --record
Let's take another look at the HorizontalPodAutoscaler resources.
1 kubectl -n go-demo-5 get hpa
The output is as follows.
NAME REFERENCE      TARGETS                      MINPODS MAXPODS REPLICAS AGE
api  Deployment/api 41%/80%, 0%/80%              2       5       2        5m
db   StatefulSet/db <unknown>/80%, <unknown>/80% 3       5       0        20s
We can see that the second HPA was created and that the current utilization is unknown. That must be a similar situation as before. Should we give it some time for data to start flowing in? Wait for a few moments and retrieve HPAs again. Are the targets still unknown?
There might be something wrong since the resource utilization continued being unknown. Let's describe the newly created HPA and see whether we'll be able to find the cause behind the issue.
1 kubectl -n go-demo-5 describe hpa db
The output, limited to the event messages, is as follows.
...
Events:
... Message
... -------
... New size: 3; reason: Current number of replicas below Spec.MinReplicas
... missing request for memory on container db-sidecar in pod go-demo-5/db-0
... failed to get memory utilization: missing request for memory on container db-sidecar in pod go-demo-5/db-0
If we focus on the first message, we can see that it started well. HPA detected that the current number of replicas is below the limit and increased them to three. That is the expected behavior, so let's move to the other two messages.
HPA could not calculate the percentage because we did not specify how much memory we are requesting for the db-sidecar container. Without requests, HPA cannot calculate the percentage of the actual memory usage. In other words, we missed specifying resources for the db-sidecar container and HPA could not do its work. We'll fix that by applying go-demo-5-no-hpa.yml.
Let's take a quick look at the new definition.
1 cat scaling/go-demo-5-no-hpa.yml
The output, limited to the relevant parts, is as follows.
...
apiVersion: apps/v1
kind: StatefulSet
metadata:
  name: db
  namespace: go-demo-5
spec:
  ...
  template:
    ...
    spec:
      ...
      - name: db-sidecar
        ...
        resources:
          limits:
            memory: "100Mi"
            cpu: 0.2
          requests:
            memory: "50Mi"
            cpu: 0.1
...
The only noticeable difference, when compared with the initial definition, is that this time we defined the resources for the db-sidecar container. Let's apply it.
 1  kubectl apply \
 2      -f scaling/go-demo-5-no-hpa.yml \
 3      --record
Next, we'll wait for a few moments for the changes to take effect, before we retrieve the HPAs again.
1 kubectl -n go-demo-5 get hpa
This time, the output is more promising.
NAME REFERENCE      TARGETS          MINPODS MAXPODS REPLICAS AGE
api  Deployment/api 66%/80%, 10%/80% 2       5       2        16m
db   StatefulSet/db 60%/80%, 4%/80%  3       5       3        10m
Both HPAs are showing the current and the target resource usage. Neither reached the target values, so HPA is maintaining the minimum number of replicas. We can confirm that by listing all the Pods in the go-demo-5 Namespace.
1 kubectl -n go-demo-5 get pods
The output is as follows.
NAME    READY STATUS  RESTARTS AGE
api-... 1/1   Running 0        42m
api-... 1/1   Running 0        46m
db-0    2/2   Running 0        33m
db-1    2/2   Running 0        33m
db-2    2/2   Running 0        33m
We can see that there are two Pods for the api Deployment and three replicas of the db StatefulSet. Those numbers are equivalent to the spec.minReplicas entries in the HPA definitions.
Let's see what happens when the actual memory usage is above the target value.
We'll modify the definition of one of the HPAs by lowering one of the targets as a way to reproduce the situation in which our Pods are consuming more resources than desired.
Let's take a look at a modified HPA definition.
1 cat scaling/go-demo-5-api-hpa-low-mem.yml
The output, limited to the relevant parts, is as follows.
apiVersion: autoscaling/v2beta1
kind: HorizontalPodAutoscaler
metadata:
  name: api
  namespace: go-demo-5
spec:
  ...
  metrics:
  ...
  - type: Resource
    resource:
      name: memory
      targetAverageUtilization: 10
We decreased targetAverageUtilization to 10. That will surely be below the current memory utilization, and we'll be able to witness HPA in action. Let's apply the new definition.
 1  kubectl apply \
 2      -f scaling/go-demo-5-api-hpa-low-mem.yml \
 3      --record
Please wait a few moments for the next iteration of data gathering to occur, and retrieve the HPAs.
1 kubectl -n go-demo-5 get hpa
The output is as follows.
NAME REFERENCE      TARGETS          MINPODS MAXPODS REPLICAS AGE
api  Deployment/api 49%/10%, 10%/80% 2       5       2        44m
db   StatefulSet/db 64%/80%, 5%/80%  3       5       3        39m
We can see that the actual memory of the api HPA (49%) is way above the threshold (10%). However, the number of replicas is still the same (2). We'll have to wait for a few more minutes before we retrieve HPAs again.
1 kubectl -n go-demo-5 get hpa
This time, the output is slightly different.
NAME REFERENCE      TARGETS          MINPODS MAXPODS REPLICAS AGE
api  Deployment/api 49%/10%, 10%/80% 2       5       4        44m
db   StatefulSet/db 64%/80%, 5%/80%  3       5       3        39m
We can see that the number of replicas increased to 4. HPA changed the Deployment, and that produced the cascading effect that resulted in the increased number of Pods.
Let's describe the api HPA.
1 kubectl -n go-demo-5 describe hpa api
The output, limited to the messages of the events, is as follows.
...
Events:
... Message
... -------
... New size: 2; reason: Current number of replicas below Spec.MinReplicas
... New size: 4; reason: memory resource utilization (percentage of request) above target
We can see that the HPA changed the size to 4 because memory resource utilization (percentage of request) was above target.
Since, in this case, increasing the number of replicas did not reduce memory consumption below the HPA target, we should expect that the HPA will continue scaling up the Deployment until it reaches the limit of 5. We'll confirm that assumption by waiting for a few minutes and describing the HPA one more time.
1 kubectl -n go-demo-5 describe hpa api
The output, limited to the messages of the events, is as follows.
...
Events:
... Message
... -------
... New size: 2; reason: Current number of replicas below Spec.MinReplicas
... New size: 4; reason: memory resource utilization (percentage of request) above target
... New size: 5; reason: memory resource utilization (percentage of request) above target
We got the message stating that the new size is now 5, thus proving that the HPA will continue scaling up until the resources are below the target or, as in our case, it reaches the maximum number of replicas.
We can confirm that scaling indeed worked by listing all the Pods in the go-demo-5 Namespace.
1 kubectl -n go-demo-5 get pods
The output is as follows.
NAME    READY STATUS  RESTARTS AGE
api-... 1/1   Running 0        47m
api-... 1/1   Running 0        51m
api-... 1/1   Running 0        4m
api-... 1/1   Running 0        4m
api-... 1/1   Running 0        24s
db-0    2/2   Running 0        38m
db-1    2/2   Running 0        38m
db-2    2/2   Running 0        38m
As we can see, there are indeed five replicas of the api Deployment.
HPA retrieved data from the Metrics Server, concluded that the actual resource usage is higher than the threshold, and manipulated the Deployment with the new number of replicas.

Next, we'll validate that de-scaling works as well. We'll do that by re-applying the initial definition that has both the memory and the CPU set to eighty percent. Since the actual memory usage is below that, the HPA should start scaling down until it reaches the minimum number of replicas.
 1  kubectl apply \
 2      -f scaling/go-demo-5-api-hpa.yml \
 3      --record
Just as before, we'll wait for a few minutes before we describe the HPA.
1 kubectl -n go-demo-5 describe hpa api
The output, limited to the events messages, is as follows.
...
Events:
... Message
... -------
... New size: 2; reason: Current number of replicas below Spec.MinReplicas
... New size: 4; reason: memory resource utilization (percentage of request) above target
... New size: 5; reason: memory resource utilization (percentage of request) above target
... New size: 3; reason: All metrics below target
As we can see, it changed the size to 3 since all the metrics are below target.
A while later, it will de-scale again to two replicas and stop since that's the limit we set in the HPA definition.
To replicas or not to replicas in Deployments and StatefulSets?
Knowing that HorizontalPodAutoscaler (HPA) manages auto-scaling of our applications, the question might arise regarding replicas. Should we define them in our Deployments and StatefulSets, or should we rely solely on HPA to manage them? Instead of answering that question directly, we'll explore different combinations and, based on results, define the strategy.
First, let's see how many Pods we have in our cluster right now.
1 kubectl -n go-demo-5 get pods
The output is as follows.
NAME    READY STATUS  RESTARTS AGE
api-... 1/1   Running 0        27m
api-... 1/1   Running 2        31m
db-0    2/2   Running 0        20m
db-1    2/2   Running 0        20m
db-2    2/2   Running 0        21m
We can see that there are two replicas of the api Deployment, and three replicas of the db StatefulSets.
Let's say that we want to roll out a new release of our go-demo-5 application. The definition we'll use is as follows.
1 cat scaling/go-demo-5-replicas-10.yml
The output, limited to the relevant parts, is as follows.
...
apiVersion: apps/v1
kind: Deployment
metadata:
  name: api
  namespace: go-demo-5
spec:
  replicas: 10
...

apiVersion: autoscaling/v2beta1
kind: HorizontalPodAutoscaler
metadata:
  name: api
  namespace: go-demo-5
spec:
  scaleTargetRef:
    apiVersion: apps/v1
    kind: Deployment
    name: api
  minReplicas: 2
  maxReplicas: 5
  metrics:
  - type: Resource
    resource:
      name: cpu
      targetAverageUtilization: 80
  - type: Resource
    resource:
      name: memory
      targetAverageUtilization: 80
The important thing to note is that our api Deployment has 10 replicas and that we have the HPA. Everything else is the same as it was before.
What will happen if we apply that definition?
 1  kubectl apply \
 2    -f scaling/go-demo-5-replicas-10.yml
 3
 4  kubectl -n go-demo-5 get pods
We applied the new definition and retrieved all the Pods from the go-demo-5 Namespace. The output of the latter command is as follows.
NAME    READY STATUS            RESTARTS AGE
api-... 1/1   Running           0        9s
api-... 0/1   ContainerCreating 0        9s
api-... 0/1   ContainerCreating 0        9s
api-... 1/1   Running           2        41m
api-... 1/1   Running           0        22s
api-... 0/1   ContainerCreating 0        9s
api-... 0/1   ContainerCreating 0        9s
api-... 1/1   Running           0        9s
api-... 1/1   Running           0        9s
api-... 1/1   Running           0        9s
db-0    2/2   Running           0        31m
db-1    2/2   Running           0        31m
db-2    2/2   Running           0        31m
Kubernetes complied with our desire to have ten replicas of the api and created eight Pods (we had two before). At the first look, it seems that HPA does not have any effect. Let's retrieve the Pods one more time.
1 kubectl -n go-demo-5 get pods
The output is as follows.
NAME    READY STATUS  RESTARTS AGE
api-... 1/1   Running 0        30s
api-... 1/1   Running 2        42m
api-... 1/1   Running 0        43s
api-... 1/1   Running 0        30s
api-... 1/1   Running 0        30s
db-0    2/2   Running 0        31m
db-1    2/2   Running 0        32m
db-2    2/2   Running 0        32m
Our Deployment de-scaled from ten to five replicas. HPA detected that there are more replicas then the maximum threshold and acted accordingly. But what did it do? Did it simply remove five replicas? That could not be the case since that would only have a temporary effect. If HPA removes or adds Pods, Deployment would also remove or add Pods, and the two would be fighting with each other. The number of Pods would be fluctuating indefinitely. Instead, HPA modified the Deployment.
Let's describe the api.
 1  kubectl -n go-demo-5 \
 2    describe deployment api
The output, limited to the relevant parts, is as follows.
...
Replicas: 5 desired | 5 updated | 5 total | 5 available | 0 unavailable
...
Events:
... Message
... -------
...
... Scaled up replica set api-5bbfd85577 to 10
... Scaled down replica set api-5bbfd85577 to 5
The number of replicas is set to 5 desired. HPA modified our Deployment. We can observe that better through the event messages. The second to last states that the number of replicas was scaled up to 10, while the last message indicates that it scaled down to 5. The former is the result of us executing rolling update by applying the new Deployment, while the latter was produced by HPA modifying the Deployment by changing its number of replicas.
So far, we observed that HPA modifies our Deployments. No matter how many replicas we defined in a Deployment (or a StatefulSets), HPA will change it to fit its own thresholds and calculations. In other words, when we update a Deployment, the number of replicas will be temporarily changed to whatever we have defined, only to be modified again by HPA a few moments later. That behavior is unacceptable.
If HPA changed the number of replicas, there is usually a good reason for that. Resetting that number to whatever is set in a Deployment (or a StatetefulSet) can produce serious side-effect.
Let's say that we have three replicas defined in a Deployment and that HPA scaled it to thirty because there is an increased load on that application. If we apply the Deployment because we want to roll out a new release, for a brief period, there will be three replicas, instead of thirty.
As a result, our users would experience slow response times from our application, or some other effect caused by too few replicas serving too much traffic. We must try to avoid such a situation. The number of replicas should be controlled by HPA at all times. That means we'll need to change our strategy.
If specifying the number of replicas in a Deployment does not produce the effect we want, we might just as well remove them altogether. Let's see what happens in that case.
We'll use go-demo-5.yml definition, so let's see how it differs from go-demo-5-replicas-10.yml that we used previously.
 1  diff \
 2    scaling/go-demo-5-replicas-10.yml \
 3    scaling/go-demo-5.yml
The output shows that the only difference is that, this time, we are not specifying the number of replicas.
Let's apply the change and see what happens.
 1  kubectl apply \
 2    -f scaling/go-demo-5.yml
 3
 4  kubectl -n go-demo-5 \
 5    describe deployment api
The output of the latter command, limited to the relevant parts, is as follows.
...
Replicas: 1 desired | 5 updated | 5 total | 5 available | 0 unavailable
...
Events:
... Message
... -------
...
... Scaled down replica set api-5bbfd85577 to 5
... Scaled down replica set api-5bbfd85577 to 1
Applying the Deployment without replicas resulted in 1 desired. Sure, HPA will scale it up to 2 (its minimum) soon enough, but we still failed in our mission to maintain the number of replicas defined by HPA at all times.
What else can we do? No matter whether we define our Deployment with or without replicas, the result is the same. Applying the Deployment always cancels the effect of the HPA, even when we do NOT specify replicas.
Actually, that statement is incorrect. We can accomplish the desired behavior without replicas if we know how the whole process works.
Let's test it out.
1 kubectl delete -f scaling/go-demo-5.yml
We deleted everything related to the go-demo-5 application. Now, let's test how the Deployment behaves if replicas is not defined from the start.
 1  kubectl apply \
 2    -f scaling/go-demo-5.yml
 3
 4  kubectl -n go-demo-5 \
 5    describe deployment api
The output of the latter command, limited to the relevant parts, is as follows.
...
Replicas: 1 desired | 1 updated | 1 total | 0 available | 1 unavailable
...
Seems that we failed. The Deployment did set the number of replicas to 1. But, what you cannot see, is that replicas are not defined internally.
Nevertheless, a few moments later, our Deployment will be scaled up by HPA to two replicas. That is the expected behavior, but we'll confirm it anyway.
 1  kubectl -n go-demo-5 \
 2    describe deployment api
You should see from the output that the number of replicas was changed (by HPA) to 2.
Now comes the final test. If we make a new release of the Deployment, will it scale down to 1 replica, or will it stay on 2?
We'll apply a new definition. The only difference, when compared with the one currently running, is in the tag of the image. That way we'll guarantee that the Deployment will be indeed updated.
 1  kubectl apply \
 2    -f scaling/go-demo-5-2-5.yml
 3
 4  kubectl -n go-demo-5 \
 5    describe deployment api
The output of the latter command, limited to the relevant parts, is as follows.
...
Replicas: 2 desired | 1 updated | 3 total | 2 available | 1 unavailable
...
Events:
... Message
... -------
... Scaled up replica set api-5bbfd85577 to 1
... Scaled up replica set api-5bbfd85577 to 2
... Scaled up replica set api-745bc9fc6d to 1
We can see that the number of replicas, set by the HPA, is preserved.
Don't be alarmed if you see in the events that the number of replicas was scaled to 1. That's the second ReplicaSet spin up by the Deployment. You can see that by observing the name of the ReplicaSet. The Deployment is doing rolling updates by joggling two ReplicaSets in the attempt to roll out the new release without downtime. That is unrelated to auto-scaling, and I assume that you already know how rolling updates work. If you don't, you know where to learn it.
Now comes the critical question. How should we define replicas in Deployments and StatefulSets?
What now?
We explored the simplest way to scale our Deployments and StatefulSets. It's simple because the mechanism is baked into Kubernetes. All we had to do is define a HorizontalPodAutoscaler with target memory and CPU. While this method for auto-scaling is commonly used, it is often not sufficient. Not all applications increase memory or CPU usage when under stress. Even when they do, those two metrics might not be enough.
In one of the following chapters, we'll explore how to extend HorizontalPodAutoscaler to use a custom source of metrics. For now, we'll destroy what we created, and we'll start the next chapter fresh.
If you are planning to keep the cluster running, please execute the commands that follow to remove the resources we created.
 1  # If NOT GKE or AKS
 2  helm delete metrics-server --purge
 3
 4  kubectl delete ns go-demo-5
Otherwise, please delete the whole cluster if you created it only for the purpose of this book and you're not planning to dive into the next chapter right away.
Before you leave, you might want to go over the main points of this chapter.
- HorizontalPodAutoscaler's only function is to automatically scale the number of Pods in a Deployment, a StatefulSet, or a few other types of resources. It accomplishes that by observing CPU and memory consumption of the Pods and acting when they reach pre-defined thresholds.
- Metrics Server collects information about used resources (memory and CPU) of nodes and Pods.
- Metrics Server periodically fetches metrics from Kubeletes running on the nodes.
- If the number of replicas is static and you have no intention to scale (or de-scale) your application over time, set replicas as part of your Deployment or StatefulSet definition. If, on the other hand, you plan to change the number of replicas based on memory, CPU, or other metrics, use HorizontalPodAutoscaler resource instead.
- If replicas is defined for a Deployment, it will be used every time we apply a definition. If we change the definition by removing replicas, the Deployment will think that we want to have one, instead of the number of replicas we had before. But, if we never specify the number of replicas, they will be entirely controlled by HPA.
- If you plan to use HPA with a Deployment or a StatefulSet, do NOT declare replicas. If you do, each rolling update will cancel the effect of the HPA for a while. Define replicas only for the resources that are NOT used in conjunction with HPA.