


In this chapter, we will cover the following recipes:
Connecting to the BI launch pad
Navigating within the BI launch pad
Using the BI launch pad toolbars
Adjusting the preferences
Searching documents
Launching applications
The report menu functionality
Working with different objects of the BI launch pad
SAP BusinessObjects BI Platform is a worldwide leading BI platform that enables organizations and enterprises to improve their entire way of working by getting better business decisions and insights about each and every aspect of the organization's business processes, whether it's sales goals that require tracking, chain management, billing, revenue from sales of products, amount that the organization spends on salaries, measuring net profit, and so on.
In the 21st century—an era of mass data explosion and information that can be pulled from an endless list of data sources, which can be found in social networks, files, multiple databases, and unstructured data—we can say for sure that an organization without a solid BI platform will find it very hard to manage its resources, respond to the rapidly changing financial reality, or even fail to perform common and simple tasks such as reporting to its customers.
The BI launch pad (formerly known as InfoView) is the BI web portal of the SAP BusinessObjects Business Intelligence (BI) platform.
The BI launch pad is the core of the entire SAP BusinessObjects platform since it unifies the following two main aspects of the organizational BI layer:
The BI content is stored here. The content includes reports that are created by the different types of SAP BusinessObjects applications and are published to the BI launch pad environment.
Through the BI launch pad, we can launch various types of SAP BusinessObjects BI applications that are suited for the different tasks of data manipulation, whether it's a simple reporting and analysis report, a fancy dashboard, or a pivot table slicing an OLAP cube.
As a web environment, the BI launch pad can be accessed using a web browser such as Internet Explorer or Google Chrome through a local site that can also be accessed from outside the organization like any other website.
The BI content can also be easily accessed from mobile devices and tablets.
The BI launch pad environment supports various login methods such as Windows Active directory, SAP login, LDAP, and SAP BusinessObjects enterprise, which enables organizations to integrate their existing login method with the BI portal and client applications as well. The entire BI content is secured. Only users with the appropriate rights can access reports; this is one of the most important aspects of the BI environment as reports may display sensitive data such as sales figures, salaries, and data that should be secured like credit card numbers.
The data in the database can be secured as well by what is known as row level security, enabling common data security scenarios such as region managers viewing the sales per region report to retrieve only the relevant data for the region manager.
The rights for the BusinessObjects applications are secured as well, and we will usefully come across the following two main user types:
Report builders: Users who can create new reports and use most of the report functionality such as slice and dice, sorting, and performing calculations and drilling
Report viewers: Business users who mainly refresh exiting reports and use thin report functionality, mainly focusing on getting the most updated results and analyzing the data
The main and core functionalities of the BI launch pad are:
Since data can be defined and analyzed in many different ways and there are different requirements on how to pull and display the data, the SAP BusinessObjects BI platform supplies various different BI tools that are categorized according to the following data requirements:
Reporting: This is the main BI tool in almost every enterprise aiming to establish a self service BI approach. It enables non-IT users to build their own reports, ad hoc querying, and reporting based on various data sources. Under the SAP BI suite, we can find Web Intelligence, which is the core BI product and our book reporting tool, and also Crystal Reports, which enables you to create highly formatted reports.
Dashboards: This is for creating beautiful and visualized interactive dashboards that can display monitored data, KPIs, and mainly aggregative data for the executive board and top managers. Here, we can find the Dashboard Design and Design Studio dashboarding tools; both are covered in separate books.
Analytics: Although there are many tools that can be found under this category, I will focus on two of them that can also be launched from the BI launch pad: SAP BusinessObjects Explorer and SAP BusinessObjects Analysis. While the second tool mainly focuses on analyzing OLAP cubes such as BW, HANA, Essbase, Analysis Services, and other OLAP sources, by using traditional OLAP mutlidimensional slicing and dicing, the first tool enables data exploration by using simple search engines and getting highly visualized answers that also support geographical presentations (maps).
Almost every enterprise is combined with different audiences and different data structures that need to be analyzed in different ways supported by a specific functionality; this answers why we will usually come across at least one BI tool, either web-based or a client one.
This book focuses on the Web Intelligence BI tool, which I call the bread and butter of every BI environment.
Our first practical step will be to log in to the BI launch pad environment using the common Internet Explorer web browser.
We want to access the BI launch pad and view which reports are displayed in our main home screen window.
Open a web browser that is installed on your computer and type the SAP BI4 server URL in the address bar.
Usually, the server URL is http://ServerName:8080/BOE/BI.
On the login page that will appear, we will choose the authentication type Enterprise, as shown in the following screenshot, and enter our username and password that are usually supplied by the SAP BI4 administrator:

After successful login, we will reach the main home screen, which by default displays four main report areas, an application launch bar, and a main home tab.
There is also a general top-right toolbar that enables options such as Log Off, Preferences, search, and running applications, as shown in the following screenshot:

The BI launch pad is a web application being run and hosted on the SAP BI4 server, and it functions as a website that can be accessed through a web browser, allowing the users and the organization to access their BI content using the Internet.
This setup requires configuration at the server side, IT, and security within the organization, but is considered a basic practice that leverages the launch pad accessibility and usability.
The login screen and the home screen can be customized and can be changed so that the look and feel will fit the organizational format and logo as well as the user requirements by using the customization kit.
For further information on how to customize the home screen, refer to the Adjusting the preferences recipe and also Chapter 13, Working with BI Workspaces
The BI launch pad main screen is tab-oriented just like in any Internet browser. The main screen centralizes the most important and relevant views for the user.
We want to navigate from the main home screen and explore the other options as well as understand the main screen options.
The Home tab is the default tab. This screen is divided into the following five major parts and another report navigation tab:
My Recently Viewed Documents: This shows the user their last viewed reports
Messages In My Inbox: This shows the reports that have been sent to the user by other users or by scheduling jobs
My Recently Run Documents: This shows which reports were last run by the user, as shown in the following screenshot:

Unread Alerts: This shows alerts relating to specific trigger results in Crystal Reports
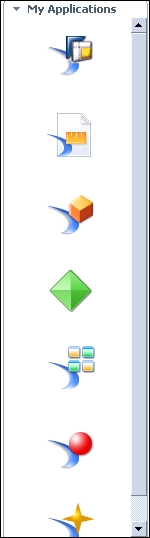
My Applications: This is located at the right-hand side of the main screen, as shown in the following screenshot, and can launch various types of BI tools and special launch pad objects:

By clicking on any report name in any one of the report subareas, the relevant report will open and display its data. The relevancy of the data in the report is dependent on the date and time the report was refreshed and saved. For example, we can open a report that ran on yesterday's data three days ago.
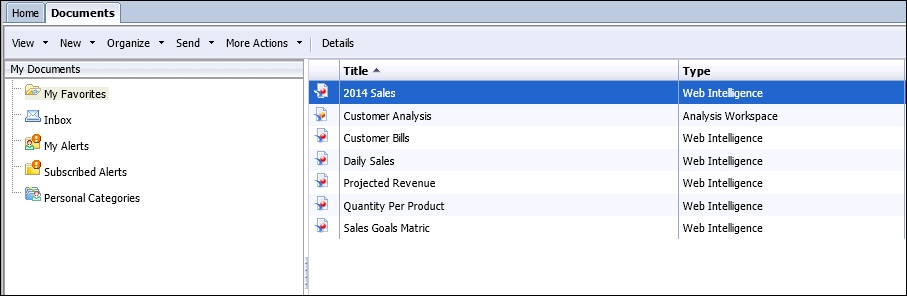
The Documents tab presents the user-personal folder, inbox, and other personal objects such as alerts and subscribed alerts, as shown in the following screenshot.
The main folder is the personal folder where the user can watch all their private reports.

Under the user-private objects, there is an accordion menu that can direct us to the public folder view.
In Public Folders, we will be able to view, depending on the user's security, the organizational/company report tree structure.
In the public folder, all kinds of reports are kept and are ready to be used by the various types of users. This folder also has a structure that corresponds to the departmental divisions of the organization.
Here, the user can simply navigate to the relevant folders that they use, as shown in the following screenshot:

The BI launch pad also enables simple file-folder navigation, allowing the user to switch between their personal data and views and the public and corporate reports, which are organized in a folder structure.
For information on searching, refer to the Searching documents recipe
For information on how to work with different applications, refer to the Launching applications recipe and Chapter 2, Creating New Queries
When we switch to the Documents tab, we will be able to see a toolbar located at the top-left of the screen. This toolbar is used for general functionality that can be applied to the reports and objects hosted in the BI launch pad, as shown in the following screenshot:
This toolbar enables us to perform basic functionalities that will help us to easily manage the reports by using the following options:
View: This enables the user to view a marked report and get the report properties (location, report description, and created and last modified dates)
New: This enables the user to build a new folder under the private folder or under the public folder tree, adding a local Crystal Report and office files and building a new publication (a scheduled report job) and a hyperlink.
The following options are available from the toolbar only if a report is marked:
We can use the BI launch pad toolbars by performing the following steps:
We will mark a specific report in one of the public folders. Click on the Organize button and choose Copy, as shown in the following screenshot:

Go to your private folder and click on it. Go to the toolbar, click on Organize, and choose Paste, as shown in the following screenshot:

The report has been copied.
Tip
Copy is probably the most common action ever in any application we have worked with, but on the other hand, a quite painful one as business users can copy and paste reports to multiple destinations, sometimes for the wrong reasons, causing report inflation and multiple copies of the report. Is it because of a slight change in the report or because you require another version for scheduling? It's best to consult your SAP BI administrator.
The preferences are a set of options that can adjust and configure the BI launch pad default environment's behavior. We can find among the preferences options that can change the user password, define a new look and feel for the Home tab, or even create shortcuts for a preferred public or private folder.
The Preferences button is located in the BI launch pad main bar, as shown in the following screenshot:

By clicking on the Preferences button, a new screen will appear, structured from the following seven main categories:
General: In this tab, the user can adjust the look and feel of the Home and Document tabs, for example, the Document tab can be adjusted in a way that every time the user switches to this tab, a specific public folder that they mainly work with will immediately show its content, as shown in the following screenshot:

In the next frame, the user can adjust the columns that will appear in the Report list view:

The last option in the general category is adjusting the working mode of the Internet browser with the reports. Another option is fixing the number of reports per page, as shown in the following screenshot:

Change Password: In this category, the user can change their password:

Locales and Time Zone: In this category, the user can adjust the product, language, and time zone locales. These definitions are mainly important to maintain the local conventions of date, numbers, and time that will be applied on the viewed objects such as reports, object names, and descriptions, as shown:

Analysis edition for OLAP: This defines the connections to OLAP analysis that will be used to create new workspaces.
Web Intelligence: This category sets several important options. The View and Modify options can be adjusted to thin or rich functionality, but are also fitted to non-Java environments.
If Java runtime is installed and ran through the web browser, then choosing Rich Client Application would be the preferred view and will modify the options to enhance the Web Intelligence functionality.

The Select a default Universe option enables the user to set a default universe for new report creation.
Drill Options control which drill options will take effect:
Prompt when drill requires additional data: In case the drill results in fetching another query, the user will get a prompt notification before the query will run again
Synchronize drill on report blocks: Drill will be applied on all report blocks (tables, charts, and so on)
Hide Drill toolbar on startup: The drill bar will be hidden when starting a new drill
Start a drill session: This will start the drill on a current or new report

Select a priority for saving to MS Excel: This sets the format options of a Web Intelligence document when scheduled and the report output is saved as an Excel file:

BI workspaces: In this category, a workspace's style and grid can be adjusted, as shown in the following screenshot:

Crystal Reports: This category sets the viewing options for crystal reports.
The preferences control the basic settings of the view options, the BI launch pad's look and feel, and enable the user to configure the main screens and panels for their way of working.
For information on working with the drill options, refer to the Scope of analysis recipe of Chapter 2, Creating New Queries, and Chapter 11, Using Drill
Searching across the BI launch pad not only enables us to find reports without knowing their location or entire name, but also enables us to look for reports that are using a specific object or even specific data.
Using the search engine on the top-left bar, we will enter the search words sales revenue.
The results will be presented in a list of relevant objects that correspond to the search results as well as categorized search results in the left panel, such as by type of the report, folder location, and objects, as shown in the following screenshot:

All the objects in the BI launch pad are being indexed, and as a consequence, this allows the user to search reports not just by the report name, but also by the data inside the reports.
The BI launch pad hosts various reporting and analysis tools, and each one serves a different purpose.
In the Applications launch bar, we can find six different applications. The following options are available from the toolbar only if a report is marked:
Module: This is a module created to be used and embedded in BI Workspaces
Analysis edition for OLAP: This can access OLAP cubes from SAP BW and non-SAP data sources such as MS Analysis
Crystal Reports: This is a client reporting tool with enhanced formatting capabilities
BI Workspaces: This creates a BI workspace and can present different reports and BI launch pad parts in one screen
Web Intelligence: This is the main reporting and analysis tool
Explorer: This is a search and navigation tool that can find answers to user business questions
BEx Web Applications: These can be accessed from the BI launch pad once created in the BW environment
We distinguish between two types of applications by their way of launch:
Applications that run through the BI launch pad environment tab and don't require any extra installation (BEx Web Applications, Module, BI Workspaces, Explorer, and Web Intelligence)
Applications that require local client installation and only supply quick and centralized access to those applications that will be opened locally on the user's machine (currently only Crystal Reports)
As we discussed in the Introduction section, the set of different reporting tools handles different aspects of data as well as different functional requirements, for example, an interactive report versus a data presentation that doesn't require drilling or analysis.
As a prerequisite for the successful running of the different web applications, a Java runtime environment is required to be installed on the user's machine or terminal; the installation part of Java is usually done by IT, but can also be downloaded manually by the user the first time they launch an application that uses Java.
To get the exact information about which Java versions are supported by which web browser, you can refer to this official guide at SAP BusinessObjects BI Platform 4.1 Supported Platforms (PAM) at http://www.sdn.sap.com/irj/scn/go/portal/prtroot/docs/library/uuid/507d3365-009b-3010-04b0-e5abc8f00c91?QuickLink=index&overridelayout=true&58879706677981.
In order to create a report using Web Intelligence, we will launch the appropriate application from the home screen and the right-hand side application launch bar, as shown in the following screenshot:
By clicking on the Web Intelligence icon, the Java runtime message will pop up first asking us to enable this application to run.
Once this application is approved, the message won't reoccur and we will be able to launch Web Intelligence and other applications that are using the Java runtime without the following intermediate stage:

The Java runtime activates an applet that enables rich functionality while working with Web Intelligence reports. This option can be configured by changing it in the Web Intelligence category. In order to get a better understanding of what are the differences in terms of functionality between Java and the HTML panel, I suggest you to read: http://scn.sap.com/community/businessobjects-web-intelligence/blog/2013/12/16/feature-differences-between-the-web-intelligence-clients-bi41-sp02. Now, the report interface will be launched and will be ready for the next step of creating the Web Intelligence report, as shown in the following screenshot:

The BI launch pad can access all the report applications from one main toolbar.
The main idea behind the application toolbar is that although you have different types of reporting and analysis tools, you can launch them from one centralized place.
Working with the application launch, we can choose which tools we want to operate and address the relevant type of business question as well as its functional requirements.
The question of which application the organization and the business users should adopt is one of the main questions in Business Intelligence technologies in general, and can easily fill an entire book.
For further reading on this matter, I recommend reading the official SAP article regarding choosing the right SAP BusinessObjects BI client at http://scn.sap.com/docs/DOC-38981, or just search Which BI tool + SAP BI4 on Google.
Another way to interact with the report functionality and other different objects in the folders is by using the right-click menu.
The functions that can be found in the right-click menu are equivalent to the BI launch pad left-hand side toolbar.
We want to explore the right-hand speed menu options, and by right-clicking on any Web Intelligence instance, we will get the following menu:

The report menu has the following options:
View Last Instance: This can be used to view the last report scheduled result
Properties: This can be used to view and edit the report properties such as report name, keywords, and description
History: This is used for viewing the report schedule history
Categories: This is used for attaching the report to a category
New: This is used for creating a new folder, publication (an advanced schedule), hyperlink, or a local file (crystal or office files upload)
Organize: The following are the options available under Organize:
Create Shortcut In My Favorites: This creates a shortcut in the user's favorite folder
Cut: This cuts the report
Copy: This copies the report
Copy Shortcut: This copies the shortcut to a specific destination
Delete: This deletes the report
In order to view a report's schedule history, right-click on the report name. Go to the History option. In the next screen, we can view the report's history data, as shown in the following screenshot:

As we have seen, the right-click menu simply enables us the same functionality as in the main toolbar by speeding up the basic functions that can be applied on a report.
For further information on how to schedule reports, refer to Chapter 12, Scheduling Reports
Working with objects in the BI launch pad can be categorized into two main types:
Reports: Working with the different types of reports created by the various BI applications such as Web Intelligence, Crystal Report, Analysis, and Explorer
Non-report objects or simply BI launch pad objects: Publications (advanced schedule objects), hyperlinks, folders, categories, and local files are used mainly for organizing objects, scheduling, and adding external files such as office files
We want to understand the basic difference between folders and categories.
Folders and categories are both used for report organizing and grouping, while folders can be seen as the physical layer that actually contains the files, and categories are the logical layer enabling report navigation and can be seen as a pointer to a folder.
The basic idea behind categories is that this structure supports multiple locations by using one report file.
The system administrator can give permissions to a folder while organizing the reports in a totally different category structure.
We want to add one of the reports to a category. We will right-click on one of our reports and choose Categories, as shown in the following screenshot:

In the next screen, we will chose the category that we want to add the report to:

After adding the report to the category, we can navigate to the report and confirm that the report is there, as shown in the following screenshot:

As we have seen, the BI launch pad is the heart of the SAP BI environment that contains all kinds of different objects: report file types, scheduled objects, hyperlinks, and other type of objects.
All the objects can be organized in a folder structure and can be grouped in a category structure as well.
Once we have the basic structure of the report's folders, we can allow users from the entire organization to access, share, send, edit, and create reports in one secured and easily accessed environment.
By enabling different types of objects to be hosted at the same environment, the organization can adopt a centralized approach towards its BI content, and can manage and run the reports, automatic scheduled jobs, users, and other standard repository objects that can be accessed through workstations, laptops, mobile devices, and tablets.