


Congratulations on your decision to start learning QlikView development! You are now well on your way to building and delivering analytical applications which will help you and your organization quickly gain new insights and make fact-based decisions.
Before we dive in and start building all sorts of wonderful things, we first need to review some of the basics. This first chapter introduces us to the business end of QlikView. We will discover what QlikView is, how it's different from other tools, and how we can explore and interact with our data within a QlikView document. Of course, this being a technical book, we will also be looking at the various technical components that QlikView consists of. This chapter concludes with an introduction to HighCloud Airlines, the case we will be working on throughout the book.
In this chapter, specifically, we will look at:
What is QlikView?
Exploring data with QlikView
The technology and components behind QlikView
HighCloud Airlines, and why QlikView might be just the tool they need
First, let's look at what QlikView is, what we can do with it, and how it differs from other solutions that are available on the market.
QlikView is developed by QlikTech, a company that was founded in Sweden in 1993, but has since moved its headquarters to the US. QlikView is a tool used for Business Intelligence, often shortened to BI. Business Intelligence is defined by Gartner, a leading industry analyst firm, as:
An umbrella term that includes the application, infrastructure and tools, and best practices that enable access to and analysis of information to improve and optimize decisions and performance.
Following this definition, QlikView is a tool that enables access to information in order to analyze this information, which in turn improves and optimizes business decisions and performance.
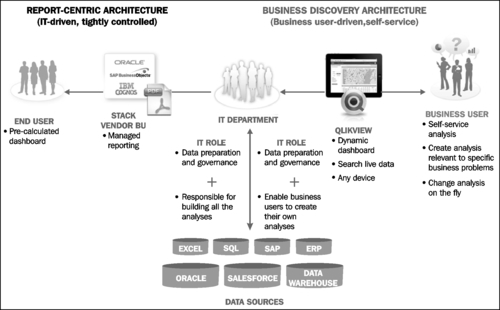
Historically, BI has been very much IT-driven. IT departments were responsible for the entire Business Intelligence life cycle, from extracting the data to delivering the final reports, analyses, and dashboards. While this model works very well for delivering predefined static reports, most businesses find that it does not meet the needs of their business users. As IT tightly controls the data and tools, users often experience long lead-times whenever new questions arise that cannot be answered with the standard reports.
QlikTech prides itself in taking an approach to Business Intelligence that is different from what companies such as Oracle, SAP, and IBM—described by QlikTech as traditional BI vendors—are delivering. They aim to put the tools in the hands of business users, allowing them to become self-sufficient because they can perform their own analyses.
Independent industry analyst firms have noticed this different approach as well. In 2011, Gartner created a subcategory for Data Discovery tools in its yearly market evaluation, the Magic Quadrant Business Intelligence platform. QlikView was named the poster child for this new category of BI tools.
QlikTech chooses to describe itself as a Business Discovery enterprise instead of Data Discovery enterprise. It believes that discovering business insights is much more important than discovering data. The following diagram outlines this paradigm:
Besides the difference in who uses the tool—IT users versus business users—there are a few other key features that differentiate QlikView from other solutions.
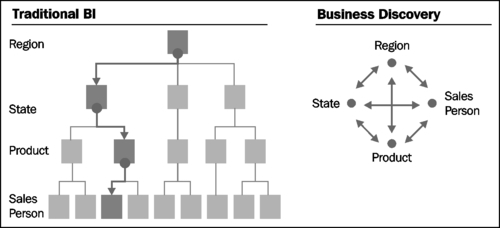
The main difference between QlikView and other BI solutions is the associative user experience. Where traditional BI solutions use predefined paths to navigate and explore data, QlikView allows users to take whatever route they want. This is a far more intuitive way to explore data. QlikTech describes this as "working the way your mind works."
An example is shown in the following image. While in a typical BI solution, we would need to start by selecting a Region and then drill down step-by-step through the defined drill path, in QlikView we can choose whatever entry point we like—Region, State, Product, or Sales Person. We are then shown only the data related to that selection, and in our next selection we can go wherever we want. It is infinitely flexible.
Additionally, the QlikView user interface allows us to see which data is associated with our selection.
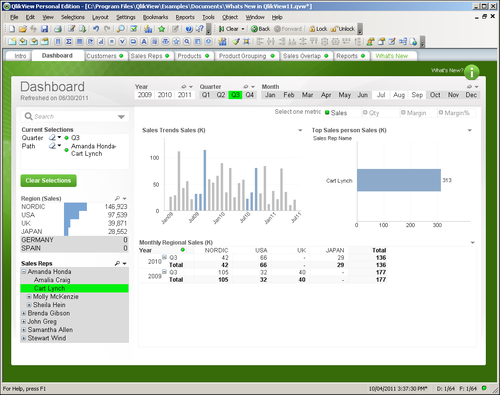
For example, the following screenshot (from QlikTech's What's New in QlikView 11 demo document) shows a QlikView Dashboard in which two values are selected. In the Quarter field, Q3 is selected, and in the Sales Reps field, Cart Lynch is selected. We can see this because these values are green, which in QlikView means that they have been selected. When a selection is made, the interface automatically updates to not only show which data is associated with that selection, but also which data is not associated with the selection. Associated data has a white background, while non-associated data has a gray background. Sometimes the associations can be pretty obvious; it is no surprise that the third quarter is associated with the months July, August, and September. However, at other times, some not-so-obvious insights surface, such as the information that Cart Lynch has not sold any products in Germany or Spain. This extra information, not featured in traditional BI tools, can be of great value, as it offers a new starting point for investigation.
QlikView's core technological differentiator is that it uses an in-memory data model, which stores all of its data in RAM instead of using disk. As RAM is much faster than disk, this allows for very fast response times, resulting in a very smooth user-experience.
In a later part of this chapter, we will go a bit deeper into the technology behind QlikView.
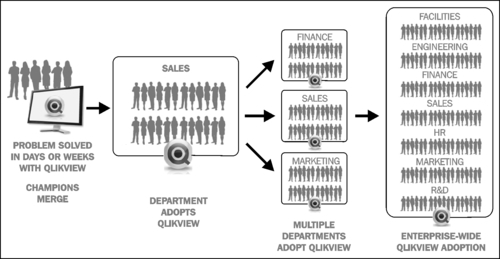
There is also a difference between QlikView and traditional BI solutions in the way it is typically rolled out within a company. Where traditional BI suites are often implemented top-down—by IT selecting a BI tool for the entire company—QlikView often takes a bottom-up adoption path. Business users in a single department adopt it, and its use spreads out from there.
Note
QlikView is free of charge for single-user use. This is called the Personal Edition or PE. Documents created in Personal Edition can be opened by fully-licensed users or deployed on a QlikView server. The limitation is that, with the exception of some documents enabled for PE by QlikTech, you cannot open documents created elsewhere, or even your own documents if they have been opened and saved by another user or server instance.
Often, a business user will decide to download QlikView to see if he can solve a business problem. When other users within the department see the software, they get enthusiastic about it, so they too download a copy. To be able to share documents, they decide to purchase a few licenses for the department. Then other departments start to take notice too, and QlikView gains traction within the organization. Before long, IT and senior management also take notice, eventually leading to enterprise-wide adoption of QlikView.
QlikView facilitates every step in this process, scaling from single laptop deployments to full enterprise-wide deployments with thousands of users. The following graphic demonstrates this growth within an organization:
As the popularity and track record of QlikView have grown, it has gotten more and more visibility at the enterprise level. While the adoption path described before is still probably the most common adoption path, it is not uncommon nowadays for a company to do a top-down, company-wide rollout of QlikView.
Now that we know what QlikView is and how it is different from traditional BI offerings, we will learn how we can explore data within QlikView.
Of course, before we can start exploring, we need to install QlikView. You can download QlikView's Personal Edition from http://www.qlikview.com/download. You will be asked to register on the website, or log in if you have registered before.
Note
Registering not only gives you access to the QlikView software, but you can also use it to read and post on the QlikCommunity (http://community.qlikview.com) which is the QlikTech's user forum. This forum is very active and many questions can be answered by either a quick search or by posting a question.
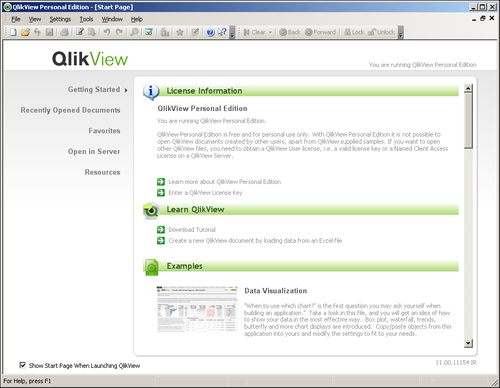
Installing QlikView is very straightforward, simply double-click on the executable file and accept all default options offered. After you are done installing it, launch the QlikView application. QlikView will open with the start page set to the Getting Started tab, as seen in the following screenshot:
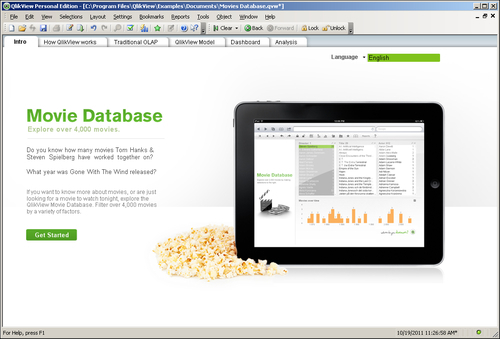
The example we will be using is the Movie Database, which is an example document that is supplied with QlikView. Find this document by scrolling down the Examples list (it is around halfway down the list) and click to open it. The opening screen of the document will now be displayed:
Most QlikView documents are organized into multiple sheets. These sheets often display different viewpoints on the same data, or display the same information aggregated to suit the needs of different types of users. An example of the first type of grouping might be a customer or marketing view of the data, an example of the second type of grouping might be a KPI dashboard for executives, with a more in-depth sheet for analysts.
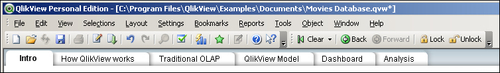
Navigating the different sheets in a QlikView document is typically done by using the tabs at the top of the sheet, as shown in the following screenshot. More sophisticated designs may opt to hide the tab row and use buttons to switch between the different sheets.
The tabs in the Movie Database document also follow a logical order. An introduction is shown on the Intro tab, followed by a demonstration of the key concept of QlikView on the How QlikView works tab. After the contrast with Traditional OLAP is shown, the associative QlikView Model is introduced. The last two tabs show how this can be leveraged by showing a concrete Dashboard and Analysis:
As we saw when we learned about the associative user experience, any selections made in QlikView are automatically applied to the entire data model. As we will see in the next section, slicing and dicing your data really is as easy as clicking and viewing!
But where should we click? QlikView lets us select data in a number of ways. A common method is to select a value from a list-box. This is done by clicking in the list-box.
Let's switch to the How QlikView works tab to see how this works. We can do this by either clicking on the How QlikView works tab on the top of the sheet, or by clicking on the Get Started button.
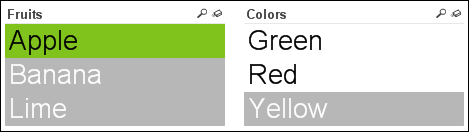
The selected tab shows two list boxes, one containing Fruits and the other containing Colors. When we select Apple in the Fruits list-box, the screen automatically updates to show the associated data in the Colors list-box: Green and Red. The color Yellow is shown with a gray background to indicate that it is not associated, as seen below, since there are no yellow apples. To select multiple values, all we need to do is hold down Ctrl while we are making our selection.
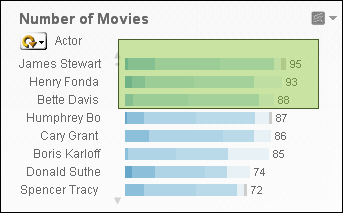
Besides selections in list-boxes, we can also directly select data in charts. Let's jump to the Dashboard tab and see how this is done. The Dashboard tab contains a chart labeled Number of Movies, which lists the number of movies by a particular actor. If we wish to select only the top three actors, we can simply drag the pointer to select them in the chart, instead of selecting them from a list-box:
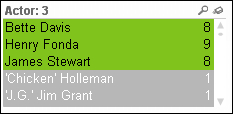
Because the selection automatically cascades to the rest of the model, this also results in the Actor list-box being updated to reflect the new selection:
Of course, if we want to select only a single value in a chart, we don't necessarily need to lasso it. Instead, we can just click on the data point to select it. For example, clicking on James Stewart leads to only that actor being selected.
While list-boxes and lassoing are both very convenient ways of selecting data, sometimes we may not want to scroll down a big list looking for a value that may or may not be there. This is where the search option comes in handy.
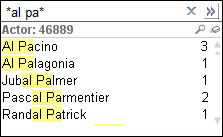
For example, we may want to run a search for the actor Al Pacino. To do this, we first activate the corresponding list-box by clicking on it. Next, we simply start typing and the list-box will automatically be updated to show all values that match the search string. When we've found the actor we're looking for, Al Pacino in this case, we can click on that value to select it:
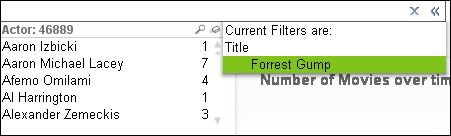
Sometimes, we may want to select data based on associated values. For example, we may want to select all of the actors that starred in the movie Forrest Gump. While we could just use the Title list-box, there is also another option: associated search.
To use associated search, we click on the chevron on the right-hand side of the search box. This expands the search box and any search term we enter will not only be checked against the Actor list-box, but also against the contents of the entire data model. When we type in Forrest Gump, the search box will show that there is a movie with that title, as seen in the screenshot below. If we select that movie and click on Return, all actors which star in the movie will be selected.
Inevitably, when exploring data in QlikView, there comes a point where we want to save our current selections to be able to return to them later. This is facilitated by the bookmark option. Bookmarks are used to store a selection for later retrieval.
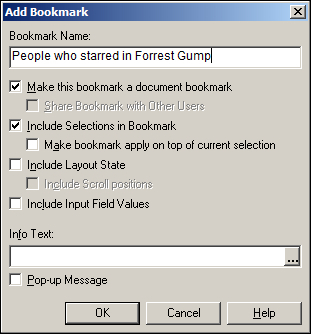
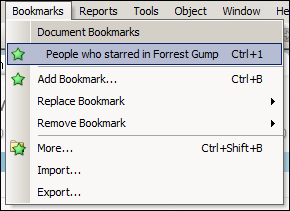
To create a new bookmark, we need to open the Add Bookmark dialog. This is done by either pressing Ctrl + B or by selecting Bookmark | Add Bookmark from the menu.
In the Add Bookmark dialog, seen in the screenshot below, we can add a descriptive name for the bookmark. Other options allow us to change how the selection is applied (as either a new selection or on top of the existing selection) and if the view should switch to the sheet that was open at the time of creating the bookmark. The Info Text allows for a longer description to be entered that can be shown in a pop-up when the bookmark is selected.
Fortunately, if we end up making a wrong selection, QlikView is very forgiving. Using the Clear, Back, and Forward buttons in the toolbar, we can easily clear the entire selection, go back to what we had in our previous selections, or go forward again. Just like in our Internet browser, the Back button in QlikView can take us back multiple steps:

Besides filtering data, QlikView also lets us change the information being displayed. We'll see how this is done in the following sections.
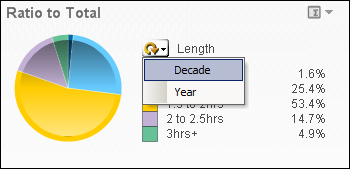
Cyclic Groups are defined by developers as a list of dimensions that can be switched between users. On the frontend, they are indicated with a circular arrow. For an example of how this works, let's look at the Ratio to Total chart, seen in the following image. By default, this chart shows movies grouped by duration. If we click on the little downward arrow next to the circular arrow, we will see a list of alternative groupings. Click on Decade to switch to the view to movies grouped by decade.
Drill down Groups are defined by the developer as a hierarchical list of dimensions which allows users to drill down to more detailed levels of the data. For example, a very common drill down path is Year | Quarter | Month | Day. On the frontend, drill down groups are indicated with an upward arrow.
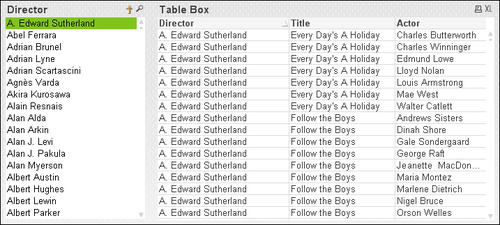
In the Movies Database document, a drill down can be found on the tab labeled Traditional OLAP. Let's go there.
This drill down follows the path Director | Title | Actor. Click on the Director A. Edward Sutherland to drill down to all movies that he directed, shown in the following screenshot. Next, click on Every Day's A Holiday to see which actors starred in that movie. When drilling down, we can always go back to the previous level by clicking on the upward arrow, located at the top of the list-box in this example.
Containers are used to alternate between the display of different objects in the same screen space. We can select the individual objects by selecting the corresponding tab within the container. Our Movies Database example includes a container on the Analysis sheet.
The container contains two objects, a chart showing Average length of Movies over time and a table showing the Movie List, shown in the following screenshot. The chart is shown by default, you can switch to the Movie List by clicking on the corresponding tab at the top of the object.
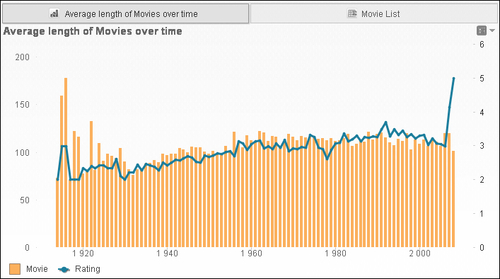
On the time chart, we can switch between Average length of Movies and Movie List by using the tabs at the top of the container object.
After all of the slicing, dicing, drilling, and view-switching we've done, there is still the question on our minds: how can we export our selected data to Excel? Fortunately, QlikView is very flexible when it comes to this, we can simply right-click on any object and choose Send to Excel, or, if it has been enabled by the developer, we can click on the XL icon in an object's header.
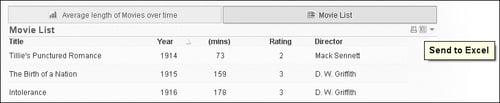
Click on the XL icon in the Movie List table to export the list of currently selected movies to Excel.
Tip
A word of warning when exporting data
When viewing tables with a large number of rows, QlikView is very good at only rendering those rows that are presently visible on the screen. When Export values to Excel is selected, all values must be pulled down into an Excel file. For large data sets, this can take a considerable amount of time and may cause QlikView to become unresponsive while it provides the data.
Now that we have seen how QlikView works from the point of view of a business user, it is time to get a little more technical. Let's take an in-depth look at the various components that QlikView consists of.
One of the key elements of QlikView is that it utilizes an in-memory database. Compared with a disk-based database, this offers a great advantage when it comes to performance. While disk-access time is measured in milliseconds, RAM access time is measured in nanoseconds, making it many orders of magnitude faster.
"But hold on—" you may say, "my hard disk has much more space than I have RAM in my PC; won't that mean that I can only load limited amounts of data into memory?"
This is a very valid question. Fortunately, there are two factors which counter this potential problem:
Cheap memory and the advancement of 64-bit processors and operating systems: While 1 megabyte of memory, in 1957, would have cost a staggering US$ 411 million, nowadays, a gigabyte can be had for less than US$ 5 (source: http://www.jcmit.com/memoryprice.htm). Coupled with 64-bit operating systems, which can address much larger amounts of RAM than 32-bit systems (up to 2 terabyte on Windows 2008 R2), it is feasible and (relatively) affordable to load huge amounts of data into RAM.
Clever compression: QlikView utilizes some sophisticated compression algorithms (and some common sense, such as de-duplicating data) to significantly reduce the amount of memory that is required to store data. Typically, on-disk data is compressed to 10 percent of its original size when it is loaded into QlikView.
These two factors make it possible to create QlikView applications that contain hundreds of millions—even billions—of records.
While the in-memory database is excellent technology, it cannot function on its own. Functionally, data flows through QlikView in the following manner (also shown in the following image):
It starts with the source data. QlikView can load data from a large variety of sources, including ODBC, OLEDB, Flat Files (Excel, CSV, and so on), and XML. There are also many different connectors, ranging from big enterprise applications such as SAP, to social networks such as Twitter.
The data is loaded into QlikView using a load script. This script can be used to extract, transform, and load data into the in-memory data model or to store it to the disk in intermediary data files called QVD files.
Data in the in-memory database is stored in an unaggregated format, meaning all aggregations are calculated on the fly. This simplifies data modeling in QlikView, as there is no need for separate aggregation tables.
Selections made by the user automatically cascade throughout the entire data model and these changes are shown by QlikView's presentation engine.
QlikView applications can be presented in multiple clients. The Windows application we used earlier is an example of a client; other similar examples will be covered in the next section.

While QlikView deployments within an organization often start with a single (or few) local installations, they often do not stay that way. As the use of QlikView expands, keeping track of different versions, dealing with huge amounts of data, reloading and distributing applications, and making sure that only the right people have access to applications becomes increasingly hard when using only the Windows client.
Fortunately, QlikTech offers a large range of components which ensure that QlikView can scale from a local deployment on a laptop all the way to an enterprise-wide solution. These components can be classified into three classes (also shown in the following screenshot):

The Windows application we used earlier to navigate and analyse the data in Movies Database can not only be used to consume content, but it is also the main tool with which to create QlikView documents. As this book is focused on developers, this will be the main focus for the remaining chapters.
When QlikView deployments expand, it becomes impractical to update and distribute files manually. Also, data is loaded into RAM when using a local Windows application to open QlikView files. When working with huge amounts of data, each PC would also need a huge amount of RAM. This might work for developer PCs, but it is hardly a cost-effective solution to outfit each user in the organization with large amounts of RAM.
Fortunately, QlikView has three components to mitigate these potential roadblocks to broader adoption:
QlikView Publisher: This component can take care of reloading, reducing, and distributing the QlikView documents. Jobs can be scheduled or triggered by external events. When QlikView Publisher has not been licensed, QlikView Server can handle the task of reloading QlikView documents.
QlikView Server: This is a centralized server which can load QlikView documents into memory and allows clients to interact with these documents remotely by using one of the QlikView clients. In addition to providing a central place where documents are stored, this also has the advantage of clients not needing huge amounts of RAM and CPU cores. The clients do not need to load all of the data locally and the processing power of the server is used for calculating and aggregating data.
QlikView Access Point: This is a portal through which users can access their documents.
QlikView documents can be consumed in multiple ways. While this book mainly focuses on the QlikView Desktop Windows application, it is interesting to take note of the other possibilities for deployment:
Web browser—plugin or AJAX client: There are two options for consumption of QlikView documents via a web browser. The first option is an ActiveX plugin. While this plugin offers an experience that is closest to the native Windows application, it only works in Internet Explorer and requires the QlikView plugin software to be installed on each client PC. Because rolling out software to each client PC might not be practical, and because there are web browsers other than Internet Explorer, there is also a second option: the AJAX client. This client does not require any software to be installed and works with most modern browsers.
iPad and other tablets: Tablets can access QlikView by using the AJAX client in their browser. The AJAX client automatically detects when a tablet is being used and switches to a touch-enabled interface. This makes it possible to develop a single QlikView document which can then be rolled out to both regular computers and mobile devices.
iPhone, Android, and BlackBerry: Mobile devices with a smaller screen, such as most smartphones, can use a special version of the AJAX client: the Small Device version. Instead of displaying complete worksheets, which would be unreadable on a small screen, this client shows each of the objects (chart, table, and so on.) one by one.
QlikView Workbench and SharePoint Web Parts: Using QlikView Workbench, objects from QlikView documents can be embedded within .NET-based web solutions. The SharePoint Web Parts can be used to embed objects from QlikView documents into SharePoint sites.
PDF: In addition to all clients that allow interaction with the QlikView documents, and with an additional license, there is also an option to distribute static PDF reports from QlikView Publisher.
When going through this list of clients, you probably noticed that the AJAX client is the most versatile of all clients. While it hasn't always been that way, nowadays, the visual and functional differences between the AJAX client and the ActiveX client are small enough for the AJAX client to be considered the preferred client for consumption of QlikView documents by users.
It's a typical Monday morning at the office. Sara, an executive at HighCloud Airlines, arrives early to begin a busy week. Work has been hectic lately.
Ever since the start of the Euro crisis, the market for air travel and cargo in HighCloud's home market in Europe has been steadily declining. As a result, HighCloud's financial results have also been sloping downward.
A few weeks ago, in an effort to turn the company around, Steve, the CEO, launched an initiative to investigate the company's expansion into other markets. Sara and her team have been tasked with investigating the US airline market. It's a project that, if done well, might really raise the profile of Sara and the team.
Unfortunately, data from many different sources, complicated query tools, and dozens of spreadsheets have made progress slow so far. Even worse, each presentation of preliminary results has triggered a wave of new questions which cannot be answered by the existing reports and analyses. Morale within the team has been steadily dropping and Sara has noticed that Steve is increasingly annoyed by the lack of results.
Unlike the rest of the team, Sara is in an exceptionally good mood this morning. After hearing good things about QlikView, she decided to download a copy of the Personal Edition last weekend. Experimenting with it, she managed to load some data into QlikView and has even created a few charts and tables.
With her laptop under her arm and a smile on her face, she walks confidently into the CEO's office and announces, "Steve, you have to see this."
In this book, we will be following Sara and her team. We will see how they apply QlikView to their business requirements, and how their knowledge and skills, along with your own, evolve throughout the chapters. Each chapter builds on the result of the previous chapter and contains hands-on exercises, along with explanations, background theory, and examples of practical applications.
This concludes our first chapter. In this chapter, we've learned what QlikView is and how it differs from traditional BI solutions. We've also seen how QlikView works from the perspective of a business user, and have had a peek at the various technical components that QlikView consists of. We concluded this chapter with an introduction to Sara and her team, and their task—to investigate if expanding to the US market might help the struggling HighCloud Airlines make a recovery.
To sum it all up, in this chapter, we have learned:
That QlikView is a Business Intelligence solution that is different from traditional BI solutions because of its associative user experience, its underlying technology, and its typical bottom-up adoption path.
How to make sense of our data: by selecting, filtering, searching, bookmarking, cycling, and drilling.
How the technology behind QlikView works, how it is deployed, and the various ways in which applications can be consumed.
What HighCloud's current problems are and how Sara and her team hope to help resolve them using QlikView.
Now that we've been introduced to QlikView, in the next chapter we will get hands-on and will develop a small proof of concept document.

