


 Download code from GitHub
In this chapter, we will cover the basic tasks related to importing data into a Qlik Sense application:
- Extracting data from databases and data files
- Extracting data from web files
- Extracting data from the FTP server
- Extracting data from web services with Rest Connector
- Activating the legacy mode in Qlik Sense® desktop
- Previewing data in the Data model viewer
- Creating a master library from the Data model viewer
- Using a master library in Edit mode
- Using visual data preparation on the data manager model viewer
Data is the core aspect of any Business Intelligence (BI) application. It provides information that helps organizations to make decisions.
A Qlik Sense application is based on the data extracted from various sources, such as relational databases, CRM systems, ERP systems, and data files.
This chapter introduces the user to various methods of extracting data into a Qlik Sense application effectively. It is assumed that the reader is already acquainted with the concepts of ODBC, OLE DB, and relational databases. The chapter also provides essential recipes to extract data from web services with the REST connector and FTP data sources with the native Web File connector.
The latter part of the chapter focuses on a few recipes regarding the creation of a library and content and the new features of visual data transformation available in the data manager.
The data within an organization is usually stored in relational databases and data files. Extracting data is the first step toward creating a data model. This section demonstrates the steps to extract data from an MS Access database and a delimited (.CSV) file. The procedure to extract data from other relational databases is the same as the process for extracting data from MS Access.
The dataset that we will use is available publicly and covers information about routes and fares for various transport systems in Hong Kong. The original data files have been downloaded from the https://data.gov.hk/ website. This dataset can also be obtained from the Packt Publishing website.
The data connections in the Qlik Sense Data load editor save shortcuts leading to commonly used data sources, such as databases and data files. The following types of connections exist in Qlik Sense:
- ODBC database connection
- OLE DB database connection
- Folder connection
- Web file connection
- Qlik Essbase Connector
- Qlik ODBC Connector Package
- Qlik REST Connector
- Qlik Salesforce Connector
- Qlik GeoAnalytics Connector
- Web Storage Provider Connector
This recipe deals with the ODBC, OLE DB, and Folder connections. The web file connection and REST Connector will be dealt with in a separate recipe.
For the following connections, here is a short description, but we don't have recipes for them in this book:
- Qlik Essbase Connector allows data extraction from Hyperion Essbase cubes
- Qlik ODBC Connector Package allows data-extraction from several data sources, such as Google Big Query, Amazon Redshift, Hive, Cloudera Impala, IBM DB2, MS SQL Server, My SQL Enterprise Edition, Oracle, PostgreSQL, Sybase ASE, and Teradata
- Qlik Salesforce Connector allows data extraction from Salesforce reports with SOAP or the Bulk API
- Qlik GeoAnalytics Connector is a new service to make geo-analytics calculations, such as calculating the distance between points, clusters, and merging shapes
- Web Storage Provider Connector allows a connection to storage services, such as DropBox, to retrieve data from files, such as XlSX or CSV
With the exception of Qlik GeoAnalytics Connector, all connectors are free to use. GeoAnalytics Connector requires the purchase or subscription of a separate license from Qlik.
The dataset required for this recipe that is downloaded from the Packt Publishing website (https://www.packtpub.com/big-data-and-business-intelligence/qlik-sense-cookbook-second-edition) comes in a zipped folder called QlikSenseData. Extract all the files from this zipped folder and save them on your hard drive at the desired location.
If you are connecting to the database using Open Database Connectivity (ODBC):
- Install the relevant ODBC drivers on your system.
Note
For the sake of this exercise, we need the MS Access drivers. The system DSN connection can be set up through the ODBC administrator under Administrative Tools in Control Panel.
- While setting up the ODBC connection, select the
ROUTE_BUS.mdbfile as the data source from theQlikSenseDatafolder. - Name the ODBC DSN connection as
HongKong Buses. - Create a new Qlik Sense application and open the
Data load editor. - Click on the
Create New Connectionand selectODBC. - Select
HongKong BusesunderSystem DSN.
- Name the data connection as
Qlik Sense CookBook ODBC. - The following screenshot shows the details we enter in the
Create new connection (ODBC)window:

If you are connecting to the database using OLE DB connectivity, we can directly set this up through the editor:
- Open the
Data load editorin Qlik Sense. - Click on the
Create new connectionand selectOLE DB. - Select the
Microsoft Jet 4.0 OLE DB Provider (32-bit)driver from the provider drop-down list. - Insert the
Data Sourcefile path, which, in our case, will be the path for theROUTE_BUS.mdbfile in theQlikSenseDatafolder. - Name the data connection as
QlikSense CookBook OLE DB. - The following screenshot shows the details we enter in the
Create new connection (OLE DB)window:

If you are extracting the data from a data file, such as .CSV, perform the following steps:
- Open the
Data load editorin Qlik Sense. - Click on
Create new connectionand selectFolder. - Select the location of the
QlikSenseDatafolder, which contains our data files. Alternatively, you can enter the path of the source folder directly underPath. - Name the data connection as
Qlik Sense CookBook Data.
- The following screenshot shows the details we enter in the
Create new connection (folder)window:

- Once the connections are created in the Qlik Sense library, they will be seen
as a list under
Data connectionsin theData load editor, as shown in the following screenshot:

If you are working with an ODBC or an OLE DB data connection, follow these steps:
- Insert the relevant data connection string to the script by clicking on
Insert connection string, as shown in the following screenshot:

- Click on Select data under
Data connectionsto view and extract data from theROUTEtable in the MS Access database, as shown:


- Click on
Insert scriptin thePreviewwindow. This will insert the connection string as well as load the statement to the script. Make sure that you delete the duplicateLIB CONNECT TO 'Qlik Sense CookBook ODBC';statement from your script. - Load the data in your application by clicking on the button.
Keep the Close when successfully finished option checked in the data load progress window. If the data is loaded successfully, the window automatically closes or else the error encountered is highlighted.
On a similar note, in order to test the Qlik Sense data files:
- Click on the
Select dataoption under theQlik Sense CookBook Dataconnection. - Select the
ROUTE_GMB.csvfile from theQlikSenseDatafolder and load it in the application. - The preview of the
ROUTE_GMB.csvtable will look like the following screenshot. Make sure that you selectEmbedded field namesunderField names. Note that theDelimiter, in this case, is automatically set toComma:

- Insert the script and then save and load it.
The LIB CONNECT TO statement connects to a database using a stored data connection from the Qlik Sense library, thus acting as a bridge between our application and the data source.
Often, the data required for the purpose of reporting is not stored in a database, but instead needs to be fetched from a website. For example, customer location information, specifically the geographic coordinates used in mapping analysis, is not available internally within an organization. This information may be available on the web and can be extracted from there.
When extracting the data from a web file:
- Open an existing Qlik Sense application or create a new one.
- Open the
Data load editor. - Click on
Create new connectionand selectWebfile. - The
Select web filewindow will open. - Insert the following URL from which you can fetch the data: http://www.csgnetwork.com/llinfotable.html.
- Name the connection as
QlikSense Cookbook Webfile, as shown in the following screenshot:

- In the list under
Data connections, selectQlikSense Cookbook Webfileand click on Select data. This will open up a preview window listing all the tables from the web page. When you carefully examine the table contents, you realize that it is the second table,@2, that contains the location information. - Check the box next to
@2and ensure that it is selected, so that the correct table is shown in the preview. The user will need to change the value underField namestoEmbedded field names. - The preview of the table will look like the following screenshot:

- Select all the fields from the table in the preview window. Click on
Insert scriptto load the web data in the application. - Name the table as
Country_Locationand the script will read as follows:
Country_Location:
LOAD
Country,
Capital,
Latitude,
Longitude
FROM [lib://QlikSense Cookbook Webfile]
(html, codepage is 1252, embedded labels, table is @2);
- Save and load the data. Once the script is successfully loaded, the
Data model viewerwill show the loaded table.
Qlik Sense connects to the web file using the stored data connection. Once connected, it identifies the tables in the HTML source and lists them in the preview window.
Certain external websites require authentication in order to be accessed and Qlik Sense is unable to cope with websites that are secured in this manner. In order to get over this issue, we can use a third-party data-extraction tool. The extracted data can be stored in a data file, such as a QVD. The .qvd file can then be used as a data source in the Qlik Sense application.
Qlik Sense can also extract data from other data formats, such as XML. The underlying principles remain the same as explained in the preceding recipes.
In the last recipe, you learned how to fetch data from a website using the web file connection. With the same connection type, we can extract data from files available in an FTP server.
To demonstrate this recipe, I'm using a local FTP server with user authentication. My server is localhost, my userid is qlik, and my password is pwd.
As a general rule, you must use the following parameters in the URL if the server requires authentication to retrieve data from a file ftp://<userid>:<password>@<servername>/path/filename.qvd.ftp://%3Cuserid%3E:%3Cpassword%3E@%3Cservername%3E/path/filename.qvd
When extracting the data from the FTP server:
- Open your web browser to check whether the URL is correct and whether you have access to the server (I prefer Firefox for this task).
- Insert the following URL from which you can see a list of folders and files from a local FTP server: ftp://qlik:pwd@localhost(change the URL with your credentials and server name):

- Navigate to the folder with the files you need:

- Right-click on the file and select
Copy Link Location:

In my example, I chose ROUTE_BUS.csv:
- Open an existing Qlik Sense application or create a new one.
- Open the
Data load editor. - Click on
Create new connectionand selectWebfile. - The
Select web filewindow will open. - Insert the URL copied from the web page to set a connection with the file to extract data:
ftp://qlik:pwd@localhost/chapter%201/QlikSenseData/ROUTE_BUS.csv. - Name the connection as
QlikSense Cookbook FTP ROUTE_BUS, as shown in the following screenshot:
- In the list under
Data connections, selectQlikSense CookbookFTP ROUTE_BUSand click on Select data. This will open up a preview window listing the contents of the file. - If the file is large, more than one megabyte, the preview can take a long time to open because of low internet speed and bandwidth when connecting to the remote FTP server.
- Change the value under
Field namestoEmbedded field names.
- The preview of the table will look like the following screenshot:

- Select all the fields from the table in the preview window. Click on
Insert scriptto load the web data in the application. - Name the table as
ROUTE_BUSand the script will read as follows:
ROUTE_BUS:
LOAD
    Route_id,
    CHANGE
FROM [lib://QlikSense Cookbook FTP ROUTE_BUS]
(txt, codepage is 28592, embedded labels, delimiter is ',', msq); - Save and load the data. Once the script is successfully loaded, the
Data model viewerwill show the loaded table.
Qlik Sense connects to the FTP source file using the stored data connection. Once connected, it identifies the content of the source folders and lists them in the preview window.
If the file is large, the preview will take a long time to open.
For each file, you must create an FTP connection, so this recipe is used in very specific use cases.
If you need to read several files, files that are large in size or both, I recommend using an FTP client to download the files beforehand to a local folder.
You can perform the FTP download using the Windows FTP command. The LOAD script can trigger the FTP command using EXECUTE if legacy mode is enabled.
Qlik Sense provides connectivity to several data sources, such as SQL databases, Excel files, and text files, but we also have an increasing need to connect to web services that provide data in the JSON or XML format. This recipe shows you how to configure a REST connection to retrieve data in the JSON format from a public web service with data related to the Star Trek Series.
For this recipe, we will use a URL to extract all the Star Trek movies. When extracting the data from a REST data source:
- Open an existing Qlik Sense application or create a new one.
- Open the
Data load editor. - Click on
Create new connectionand select QlikRESTConnector. - The Qlik
RESTConnector configuration window will open. - Insert the following URL from which you can fetch the data: http://stapi.co/api/v1/rest/movie/search.
- Set up
Authentication SchemaasAnonymous.
- Name the connection as
QlikSense Cookbook REST, as shown:

- Click
Test Connectionto check whether the parameters are OK. - Click
Createto create the connection and close the configuration panel.
- In the list under
Data connections, selectQlikSense Cookbook RESTand click on Select data. This will open a preview window listing the tables found in the JSON response from the web service. When you carefully examine the table contents, you realize that it is a root node, and when you expand the node, you find a movies node. - Check the box next to
moviesand ensure that it is selected, so that the correct table is shown in the preview (when working with JSON data sources, we always have to expand the nodes to find the right table to be extracted).
- The preview of the table will look like the following screenshot:

- Save and load the data. Once the script is successfully loaded, the
Data model viewerwill show the loaded tables. - Click on
Insert scriptto load the JSON data in the application. - Several commands have been inserted in the script.
- The main one has a name of
RestConnectorMasterTable. This table contains the JSON data in a flattened format. - Two more tables are created by a resident load from the
mainDirectormain table andmovies. In the end, theRestConnectorMasterTablemain table is dropped from memory.
Qlik Sense connects to the REST service using the stored data connection. Once connected,
it identifies the source formats and lists them in the preview window.
JSON data sources contains nested data with several children records. Qlik Sense creates a multi-table schema when the source contains nested data.
Qlik Sense REST Connector can also extract data from other data formats, such as XML and CSV. The underlying principles remain the same as explained in the preceding recipes. You can also extract data using authentication methods, the POST method for SOAP web services, or the pagination method to retrieve a large amount of data.
Qlik Sense is a developing product; hence, certain features are not active when running the Desktop version in its standard mode. A prime example of this is running Windows command-line statements or external programs, such as the 7zip file compressor. Both these activities are not possible if Qlik Sense runs in its standard mode. In order to get these functionalities to run, we need to activate the legacy mode. However, you must be aware that enabling the legacy mode has security implications, if the application is deployed on the Sense server. You do not have control over the data connections in QMC (if the legacy mode is activated). The library security features may also be lost; moreover, the user has access to the entire filesystem on Qlik Sense Server because the account running the Qlik Sense Engine Service has administrative privileges. Activating the legacy mode requires changing a parameter value in the settings.ini file for Qlik Sense Desktop. In the Qlik Sense Server, you must have an Administration Role to access the QMC.
The recipe is only valid for Qlik Sense Desktop:
- Make sure that Qlik Sense Desktop is closed before opening the
settings.inifile. - Open the
settings.inifile that is, by default, stored underC:\Users\{user}\Documents\Qlik\Sense\Settings.ini, as shown in the following screenshot:

- Change
StandardReload=1toStandardReload=0. - Save the file and start Qlik Sense Desktop in order to run it in a legacy mode.
Changing the value for the StandardReload parameter in the settings.ini file enables the legacy mode in Qlik Sense. When running in legacy mode, any of the scripts in Qlik View can be directly used in Qlik Sense. This will also allow us to use the library connections.
Qlik Sense has the ability to use the same script that is found in any QlikView file. You can also use a binary load statement in Qlik Sense in order to load the entire data model from an existing QlikView file. We can also run Windows command-line statements.
- The Executing command line programs within the script recipe in Chapter 3, Scripting
As any experienced Qlik developer will tell you, the Data model viewer is a key component you will undoubtedly use on your Qlik journey. Qlik Sense has brought with it some nice new features. We will also delve into the different insights that can be gleaned from the Data model viewer:
For this recipe, we will make use of the Data model viewer.qvf application. This file is available for download on the Packt Publishing website.
- Open the
Data model viewer.qvfapplication that has been downloaded from the resource library. - Click on
Data model viewerin the Navigation drop-down on the toolbar.
In this section, we will see how the different types of data are viewed.
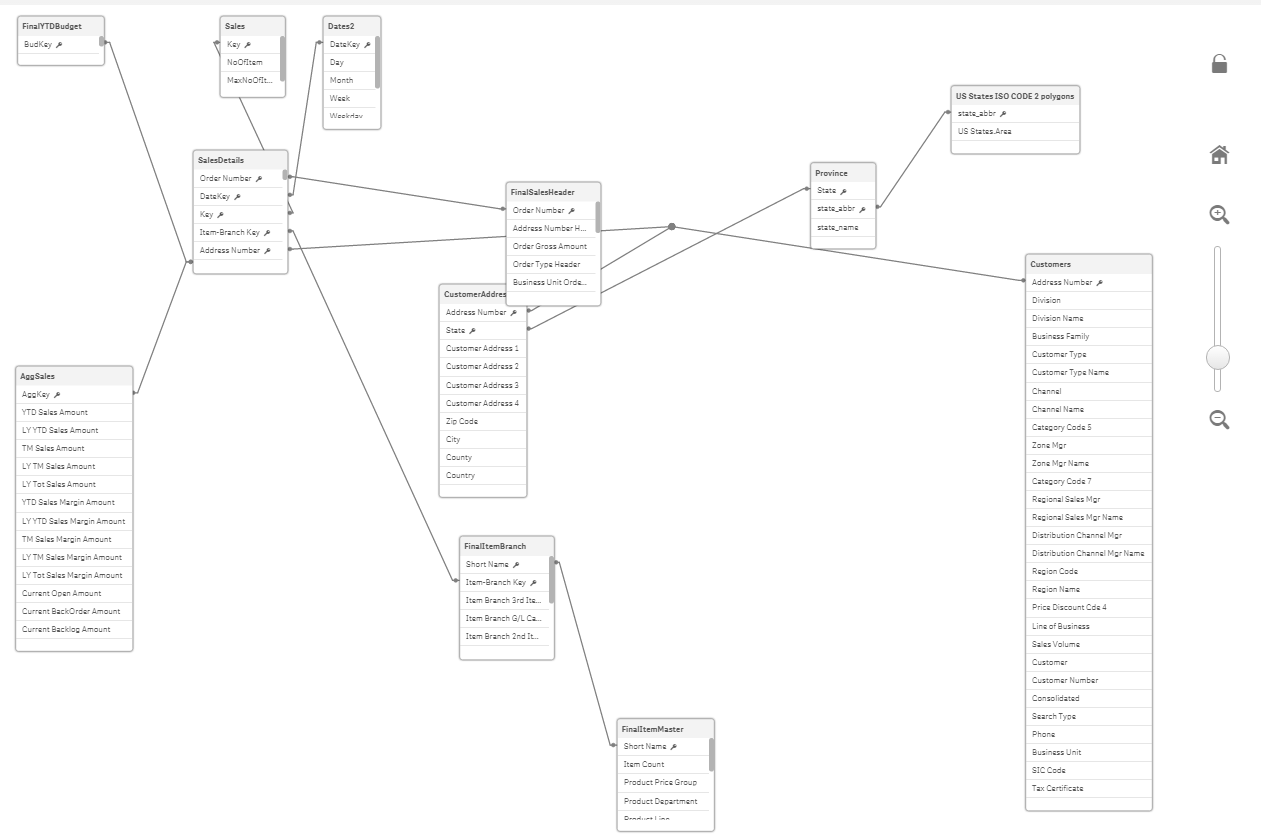
The data model consists of a number of tables joined by the key fields. The following screenshot contains functions that can be used to manipulate the layout of the data model:
The details of the available keys (from right to left) are given as follows:
- Collapse all: This reduces the tables to just their headers, thus hiding all the fields
- Show linked fields: Expands the tables enough to only display the key fields in each
- Expand all: Displays all the fields for each table
- Internal table viewer: Shows the internal representation of the data model
- Layout: Provides options to auto-align the table grid or space out across the screen
- Show preview: Toggles the data preview screen to either on or off
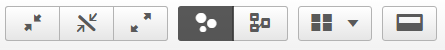
Clicking on a table will highlight its associated tables in orange. The customer's table is selected in the following screenshot and the shared key here is Address Number:
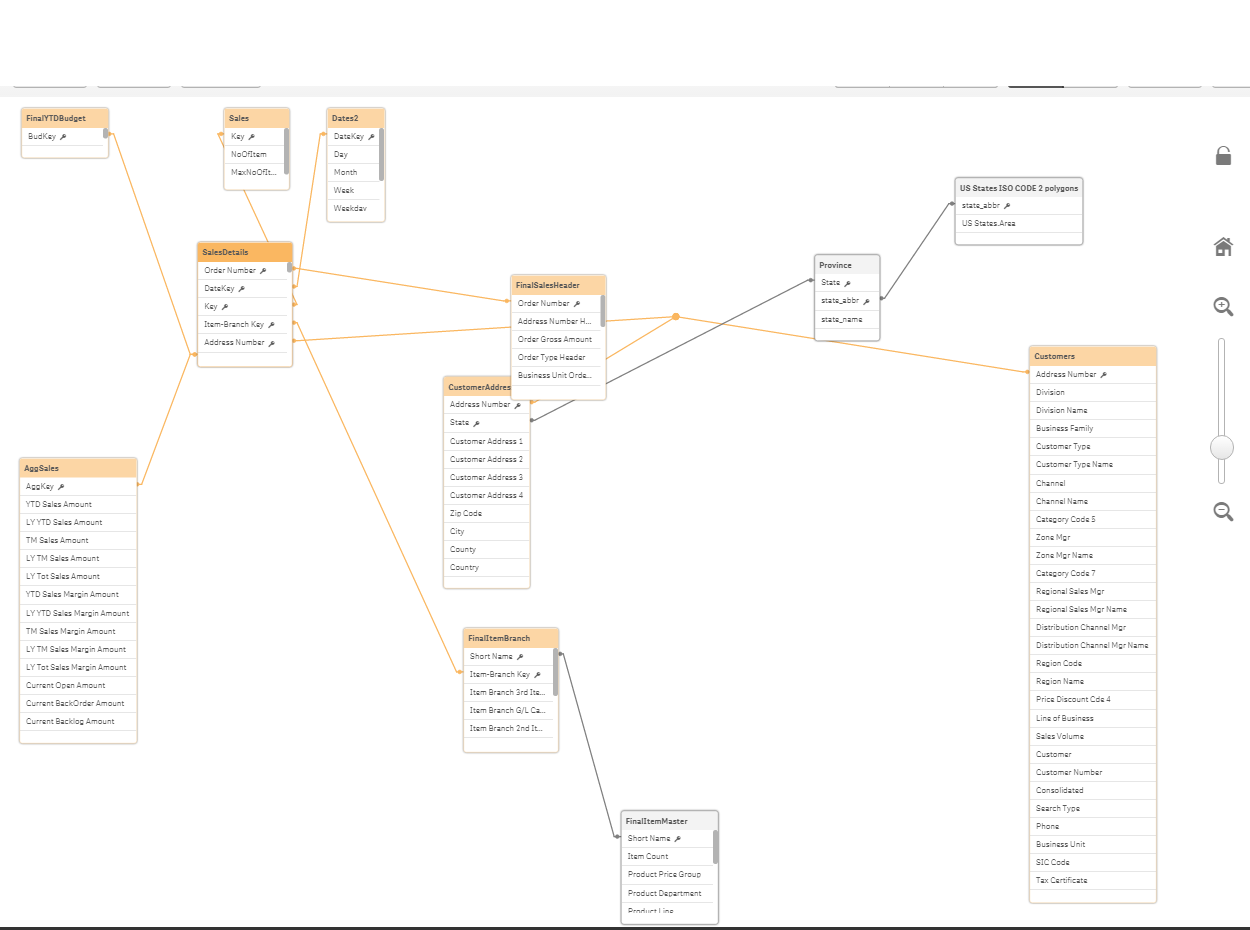
Click on the CustomerAddress table to see a highlighted expansion, via the state key, as shown:
The Data model viewer also provides information on the contents of each table.
Click the header of the customer address table, and then open the Preview pane by clicking the Preview button in the bottom-left corner.
The following preview will be displayed at the bottom of the screen:
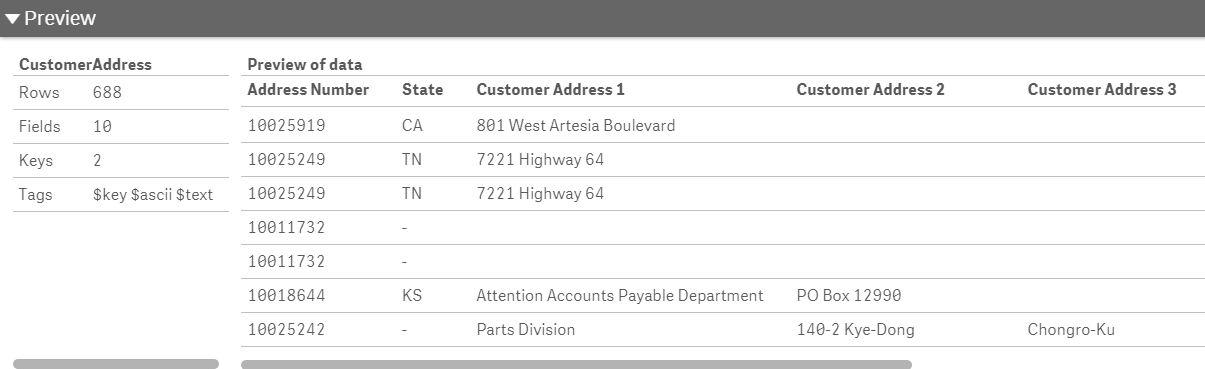
Along with a small snippet of the table's contents, the far-left table also provides some high-level table information about the number of rows, fields, keys, and any tags.
Next, click the Address Number field from the Customers table in the Data model viewer.
You can now see more detailed information about the individual field.
These are:
- Density
- Subset ratio
- Has duplicates
- Total distinct values
- Present distinct values
- Non-null values
- Tags
This information is very helpful when we are debugging issues. If a count does not return the expected result, you may want to ensure that there are no duplicates.
If a selection is not filtered correctly, you may want to check the subset ratio of the key and so on.
To help reduce the repetition and developer error, Qlik has introduced a master library where we can store reusable items, such as dimensions, measures, and even whole visualizations. For people experienced with Qlik's other products, such as QlikView, just think, "No more linked objects and storing expressions in variables!"
It is easy to think of library items in a self-service context. Don't get me wrong; ultimately, you will have to decide what will be published – from your data model to the world for their own analysis purposes. Having said that, the secret sauce of this recipe is in saving your own time.
It is a productivity hack that implies, "Automation is to your time what compound interest is to money." While it is not an exact parallel, this is a nice concept to frame the usefulness of time-saving functions in Qlik Sense. The effective use of the library saves time spent on scrolling downfield lists, rewriting expressions over and over, and applying a single change in multiple places.
Once you have saved enough time to eclipse the setup investment, the value of taking this approach can only compound with continuous development.
- Create a new Qlik Sense application and name it
Master Library. - Open the
Data load editor.
- Enter the following script and load the data by clicking on the button (the script is available in a separate text file that can be downloaded from the Packt Publishing website):
Data:
LOAD * INLINE [
    Name, Region, Country, City, OrderId, Sales, Company,
     OrderDate
    Wooten, C, Mozambique, Carmen, 1, 45.55, Est Nunc
     Laoreet LLC, 22/12/14
    Blankenship, Delta, Cayman Islands, Sapele, 2, 95.76,
     Lorem Donec Inc., 17/01/15
    Sheppard, Wyoming, Vatican City State, Cheyenne, 3,
     38.31, Lobortis, 07/08/14
    Goddard, H, Curaçao, San Francisco, 4, 86.33, Non Inc.,
     07/09/14
    Galloway, Aragón, Trinidad & Tobago, Zaragoza, 5,
     85.80, Diam Proin., 21/01/15
    Kirsten, Tamil Nadu, Wallis & Futuna, Neyveli, 6,
     28.47, Mollis Non Limited, 03/05/14
    Holland, Cartago, Falkland Islands, San Diego, 7, 1.34,
     Ullamcorper Inc., 17/07/14
    Thaddeus, BC, Canada, Oliver, 8, 59.04, Ante Nunc
     Mauris Ltd, 17/02/15
    Lareina, CA, Spain, San Diego, 9, 4.55, Pellentesque
     Tincidunt Limited, 29/07/14
    Jescie, Vienna, Monaco, Vienna, 10, 54.20, Ultricies
     Ligula Consulting, 16/06/14
    Logan, IL, Saint Barthélemy, Paris, 11, 91.31, Mi
     Foundation, 13/12/14
    Shannon, CG, Nepal, Aberystwyth, 12, 80.86, Auctor Non
     LLC, 03/05/14
    Andrew, SO, Argentina, Sokoto, 13, 88.78, Scelerisque
     Mollis Associates, 12/12/14
    Jocelyn, WP, Tanzania, Konin, 14, 15.91, Ligula Tortor
     Dictum Ltd, 22/08/14
    Gordon, FL, Hong Kong, Miami, 15, 93.97, Suscipit Inc.,
     12/05/14
];Once the data has been loaded, you can check the results by opening the Data model viewer through the Navigation dropdown () in the top corner on the left-hand side of the toolbar, as shown in the following screenshot:
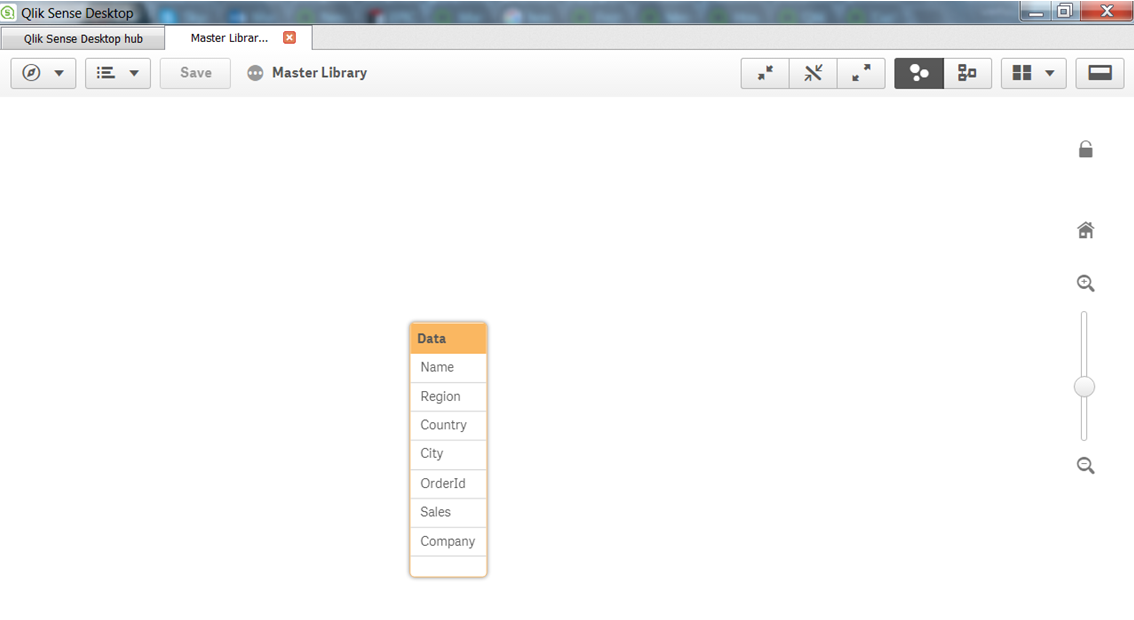
You can find the Preview button at the bottom-left of the screen. There are several other places in Qlik Sense where you can create master library items, but the data model preview screen is the best, as it also lets you see the data first. Take a minute to browse the data you have loaded in the Data model viewer:
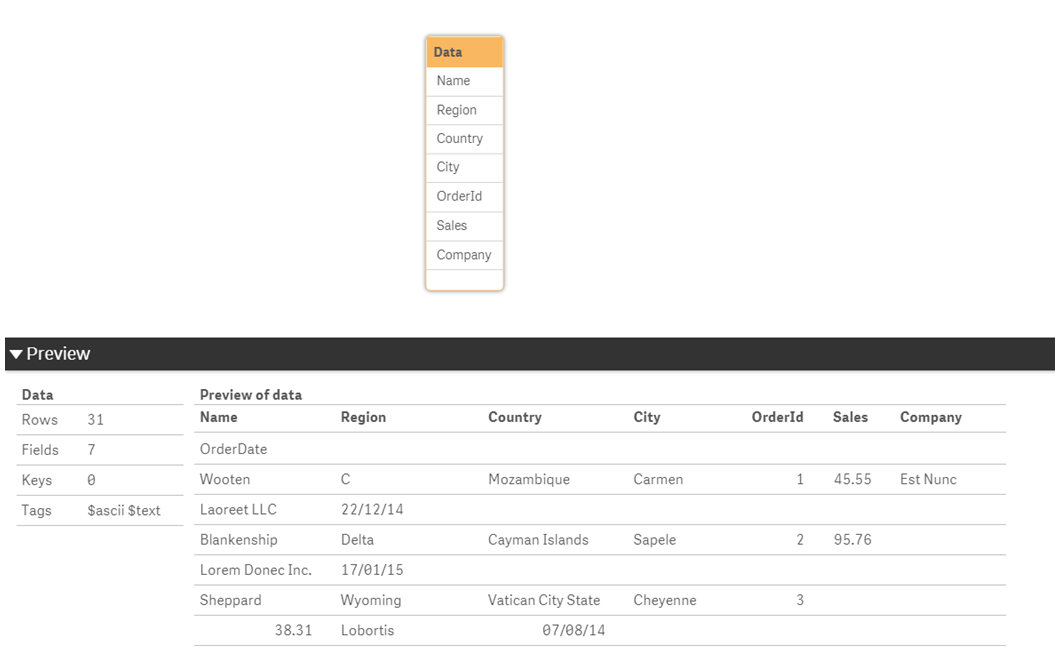
- In the
Data model viewer, select theDatatable by clicking on its header and then click thePreviewbutton to view the fields and the field values loaded from theDatatable.
- The
Previewwindow will appear, as shown in the following screenshot:
- Select the
Regionfield from the table to get the preview, as shown in the following screenshot:
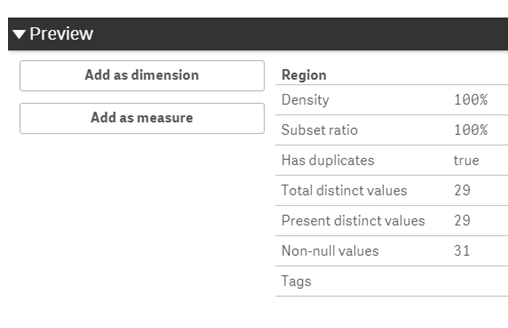
- Click the
Add as dimensionbutton. - The following window appears. If you are likely to publish this dimension for consumption by users, you can enter a description here:
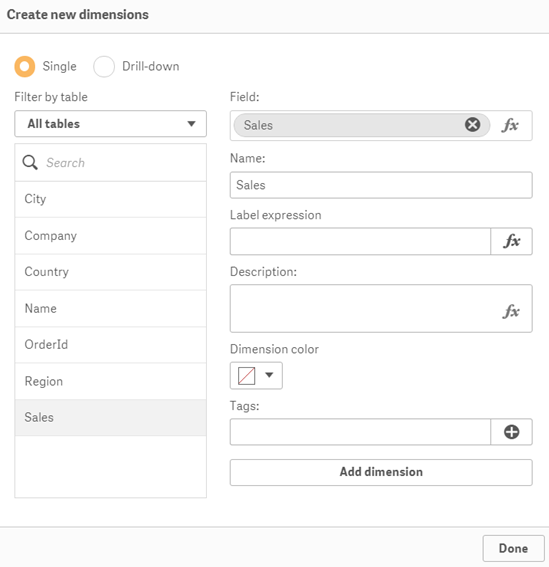
- It is advised to use tags to make our life easier. Add the
Geotag and click on
- Click on the
Add dimensionbutton to create a master dimension in the library. - Repeat this process for the
CountryandCityfields.
- Click on
Doneto go back to theData model viewer. - It's time to create a measure. Select the
Salesfield from theDatatable in theData model viewer. - Click the
Add as measurebutton. When we create a Master measure, we need to make sure we use an aggregation function, such asSumorAvg, along with the selected field. - In the
Create new measurewindow, typeSUMin front of (Sales), as shown in the following screenshot:
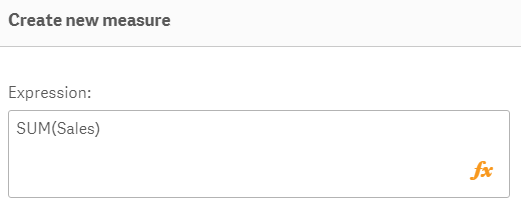
- Click on
Create. - Save the changes made in the master library by clicking on the button on the toolbar in the table preview. Exit the table preview by going to
App overview. - Open (or create) a sheet and enter the edit mode by clicking on the Edit sheet button.
- Once you are in edit mode, click the chain () icon on the left-hand side of the asset panel to open the

Master itemsmenu. - To add visualizations, first create them in the user interface and then drag them into the library.
While the Master items menu panel is very useful to speed up the development when defining the content, it is easier to do it from the filters pane. In short, you can browse the entire content of your data model and right-click on the most important fields to add the ones that will be frequently used.
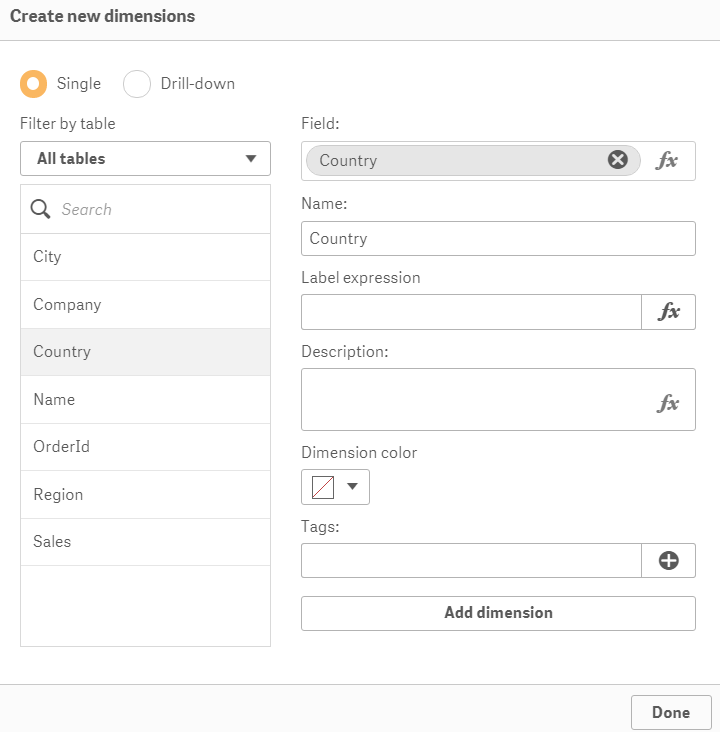
- Right-click on a field from the field's pane that you want to add to the master library:
- Click on
Create Dimension, enter aDescriptionand any relevantTags, and clickDoneonce finished:

As mentioned in the Creating a master library from the Data model viewer recipe, a great benefit of creating a master library is to save you time and reduce the complexity by applying global changes to your visualizations.
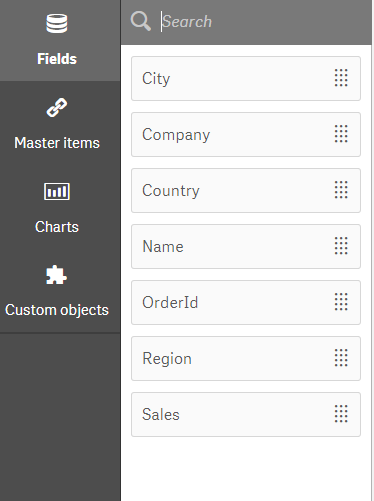
There are three main areas in the asset panel when editing a Qlik Sense sheet (Charts, Custom objects, Master items, and Fields). Clicking the chain button (

) opens the Master items pane.
From here, you can manage every aspect of the Master items, such as renaming, replacing, deleting, and editing.
You can continue to use the application from the Creating a Master Library from the Data model viewer recipe:
- If you have not completed the Creating a Master Library from the Data model viewer recipe, load the following in your
Data load editor:
LOAD * INLINE [
Country, Area, Quantity
USA, North, 1000
USA, North, 1200
USA, South, 2500
USA, South, 2500
UK, North, 1000
UK, North, 2500
UK, South, 2000
UK, South, 1900
 ];
- Add
CountryandAreaas Master dimensions, both with theGeotag. - Add
Quantityas a Master measure.
- Open the
App overviewscreen by clicking on the navigation dropdown on the toolbar at the top. - Create a new sheet or open an existing one.
- Enter the edit mode by clicking on the button.

- Click on the object pane button () and double-click on the
 button. The chart will be added to the main content area automatically.
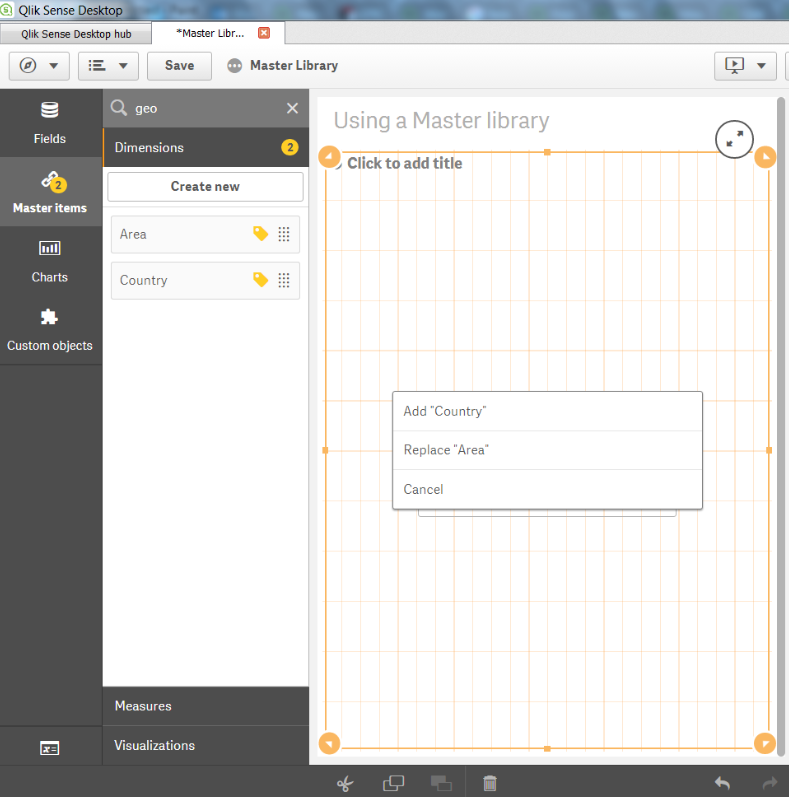
- Type
Geoin the search box of the asset panel on the left of your screen. While there are no charts called Geo, the search has flagged up our two tagged dimensions in the master library pane with a yellow circle. - Drag the
Areafield to where it saysAdd dimension. Repeat the steps where theCountryfield selectsAdd "Country"when prompted, as shown in the following screenshot:
- Clear your search on
Geoby pressing thebutton.
- Click on
Measures.
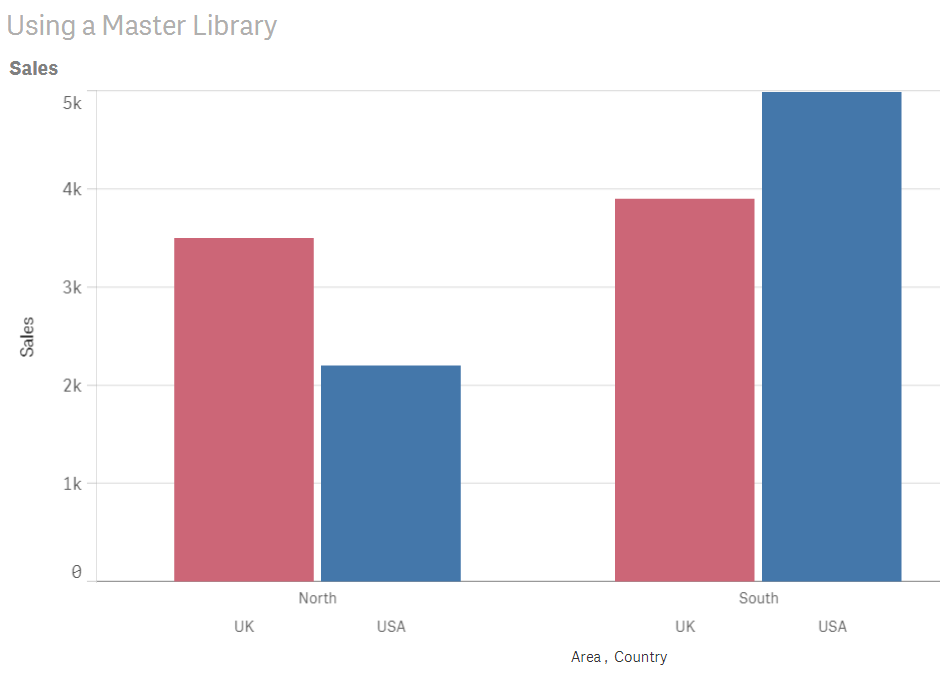
- Drag the
Salesmeasure from the asset panel over to the add measure area of the chart. Voila! You have created your first visualization using Master dimensions and measures:
- You can now drag this chart into the asset panel and it will become a master visualization.
If you delete a Master dimension or Master measure, the visualizations that use the deleted Master item will not work unless you replace it with a new dimension or measure. The same applies to delete a field from the data model; the reference will remain part of the Master item pane until it's updated from the edit screen.
Creating master measures replaces the need to write expressions as variables for reuse. Another piece of QlikView functionality that has been replicated and expanded upon is the concept of linked objects. Any updates you make in the Master visualization area will be applied globally.
If you rename a field in your script without moving the position, it will be applied automatically to all the objects.
If you are a QlikView developer beginning to use Qlik Sense, you are very familiar with the load-script editor and the powerful commands available there, but most business users are not familiar with coding, so Qlik Sense provides Data manager, a visual data preparation tool tailored for non-technical users. It's a great tool even for experienced QlikView developers.
With data manager, you can create table associations using drag and drop, concatenate tables, and synchronize scripted tables within the data manager.
You can also create table fields that calculate values, create calendar fields, use the data profiling cards to create numeric buckets, and handle string fields with the Replace, Set nulls, Order, and Split functions.
The data manager can detect geographical data in your table if it have columns with country and city names. It can detect geopoint data (latitude, longitude) for a single location, such as a city or a customer site. It can also detect area data (polygons) to represent regions or countries when loading this information from flat files like TXT or XLS.
Our recipe focuses on some of these functionalities, such as visual data association, concatenation, calculated field, and string replace.
The dataset required for this recipe that is downloaded from the Packt Publishing website (https://www.packtpub.com/big-data-and-business-intelligence/qlik-sense-cookbook-second-edition) comes in a zipped folder called QlikSenseData. Extract all the files from this zipped folder and save them on your hard drive at the desired location.
The files used in this recipe are Sales Data.xlsx and Sales Data 2017.xlsx.
- Create a new Qlik Sense application and name it
Qlik Sense Cookbook Visual Data Peparation. - When starting a new application, Qlik Sense always asks to choose between the
Data managerand the load script editor. ChooseAdd data from files and other sources:

- Click on
My computerin the file location section on the left, and navigate to the folder with theSales Data.xlsxfile and click in the file:

- After selecting the file, we can see a list with all sheets in the Excel file. Select all sheets, as in the following screenshot:


- Click on
Add data:
We also have a fourth table with data from 2017, so we need to import that too.
- Click on the Plus circle in the top-left corner to insert another table:
- Open
My computerand selectSales Data 2017.xlsx. It only has one sheet with data related to 2017. - In the preview windows, select the
Orderssheet and click onAdd Data. - Once the connection is created, we can start to model and prepare our data with the associations and table editors:
- Open

When we added the data, Qlik sense created a bubble for each table. After inserting a new table with data from 2017, it automatically created a table concatenation between the Orders table from Sales Data.xlsx and Sales Data 2017.xlsx. Note the multi-circle at the top of the table name; it's an indicator for a table created by file concatenation:

To associate the tables and create connections between them, follow these steps:
- Click on the
Customerstable. - Check whether any other table has a green bar. The green bar shows which table has the stronger match for the association. The more it is filled, the stronger a candidate it is for the association:

- Drag the
Customertable over theOrderstable to create the association between them. - Click on the association to review which field was used:


Now we must review the data in the Sales table. Perform the following steps:
- Click on the
Tablesbutton at the top-right of the screen to open the table editor. You will see the following screen:

- Move the mouse pointer over the Order box and click on the pencil to edit the table:

- In the table editor, click on the
Ship Modecolumn header to select the field. A profiler window at the bottom shows the distribution of values for each category of data, and the data profiling card on the left. It looks like the following screenshot:

- There are some data mismatches in the column that we need to fix using the replace card. Select
Standard ClassandStd Class(note that the replacement value is the first value selected). - Click on
Replace. The card will be updated and show only the replaced value mergingStd ClasswithStandard Class. - Repeat the steps to merge
First Classand1st ClassasFirst Class.
- Repeat the steps to merge
Second Class,2nd Class, andSecond ClasasSecond Class. - We have replaced several values to keep with only four distinct values, as in the following screenshot:

Add a calculated field:
- In the same table, click on
Add fieldand selectCalculated field. It will show the calculated field panel editor on the right of the screen. - In the
Namefield, writeDiscount Value. - In the
Expressionbox, writeSales * Discount. The panel provides a preview box showing the result of the expression for each line of the table.
- Click on
Create. Now you see a new column at the end of the table with the calculated field. An example is shown in the following screenshot:

- Click on
Load datato reload data in the application.
When we create a table association, Qlik Sense profiles your data help you create associations between tables, irrespective of the name of the column on each table. When adding several tables with the same name and column, the data manager creates an automatic concatenation. In all fields of the table, it's possible to transform the data: if the data is a numeric value, you can create buckets. If the column contains string data, you can perform Replace, Set Nulls, Order, or Split operations. You can create calculated columns as well, but the calculation can only reference columns in the same table.
When doing all this data preparation, the data doesn't load in the memory; you need to click on Load data (the green button) to reload the app with all changes into memory and to start creating visualizations with new tables and fields.
If you are aware of the data you are loading, you can disable data profiling to speed up the load processing in the data manager, especially if you have memory constraints and huge datasets with millions of rows.
When disabling data profiling, Qlik Sense can't recognize location data using city and country names, so you will not be able to visualize data with maps in your app.
The editor also can handle tables with different columns, and you can force the concatenation during column pairing. To do this, click on More options (the button with three dots) at the bottom of the screen in the associations or table editor, and select Concatenate Tables.


