


 Download code from GitHub
No matter which industry you work in, IT, fashion, food, or finance, there is no doubt that data affects your life and work. At some point in this week, you will either have or hear a conversation about data. News outlets are covering more and more stories about data leaks, cybercrimes, and how data can give us a glimpse into our lives. But why now? What makes this era such a hotbed for data-related industries?
In the 19th century, the world was in the grip of the industrial age. Mankind was exploring its place in industry alongside giant mechanical inventions. Captains of industry, such as Henry Ford, recognized major market opportunities at the hands of these machines, and were able to achieve previously unimaginable profits. Of course the industrial age had its pros and cons. While mass production placed goods in the hands of more consumers, our battle with pollution also began around this time.
By the 20th century, we were quite skilled at making huge machines; the goal now was to make them smaller and faster. The industrial age was over and was replaced by what we refer to as the information age. We started using machines to gather and store information (data) about ourselves and our environment for the purpose of understanding our universe.
Beginning in the 1940s, machines like ENIAC (considered one of, if not the first, computer) were computing math equations and running models and simulations like never before.

The ENIAC, http://ftp.arl.mil/ftp/historic-computers/
We finally had a decent lab assistant who could run the numbers better than we could! As with the industrial age, the information age brought us both the good and the bad. The good was the extraordinary pieces of technology, including mobile phones and televisions. The bad in this case was not as bad as worldwide pollution, but still left us with a problem in the 21st century, so much data.
That's right, the information age, in its quest to procure data, has exploded the production of electronic data. Estimates show that we created about 1.8 trillion gigabytes of data in 2011 (take a moment to just think about how much that is). Just one year later, in 2012, we created over 2.8 trillion gigabytes of data! This number is only going to explode further to hit an estimated 40 trillion gigabytes of data creation in just one year by 2020. People contribute to this every time they tweet, post on Facebook, save a new resume on Microsoft Word, or just send their mom a picture through text message.
Not only are we creating data at an unprecedented rate, we are consuming it at an accelerated pace as well. Just three years ago, in 2013, the average cell phone user used under 1 GB of data a month. Today, that number is estimated to be well over 2 GB a month. We aren't just looking for the next personality quiz, what we are looking for is insight. All of this data out there, some of it has to be useful to me! And it can be!
So we, in the 21st century, are left with a problem. We have so much data and we keep making more. We have built insanely tiny machines that collect data 24/7, and it's our job to make sense of it all. Enter the data age. This is the age when we take machines dreamed up by our 19th century ancestors and the data created by our 20th century counterparts and create insights and sources of knowledge that every human on Earth can benefit from. The United States created an entire new role in the government for the chief data scientist. Tech companies, such as Reddit, who up until now did not have a data scientist on their team, are now hiring them left and right. The benefit is quite obvious—using data to make accurate predictions and simulations gives us a look into our world like never before.
Sounds great, but what's the catch?
This chapter will explore the terminology and vocabulary of the modern data scientist. We will see key words and phrases that are essential in our discussion on data science throughout this book. We will also look at why we use data science and the three key domains data science is derived from before we begin to look at code in Python, the primary language used in this book:
Basic terminology of data science
The three domains of data science
The basic Python syntax
Before we go any further, let's look at some basic definitions that we will use throughout this book. The great/awful thing about this field is that it is so young that these definitions can differ from textbook to newspaper to whitepaper.
The definitions that follow are general enough to be used in daily conversations and work to serve the purpose of the book, an introduction to the principles of data science.
Let's start by defining what data is. This might seem like a silly first definition to have, but it is very important. Whenever we use the word "data", we refer to a collection of information in either an organized or unorganized format:
Organized data: This refers to data that is sorted into a row/column structure, where every row represents a single observation and the columns represent the characteristics of that observation.
Unorganized data: This is the type of data that is in the free form, usually text or raw audio/signals that must be parsed further to become organized.
Whenever you open Excel (or any other spreadsheet program), you are looking at a blank row/column structure waiting for organized data. These programs don't do well with unorganized data. For the most part, we will deal with organized data as it is the easiest to glean insight from, but we will not shy away from looking at raw text and methods of processing unorganized forms of data.
Data science is the art and science of acquiring knowledge through data.
What a small definition for such a big topic, and rightfully so! Data science covers so many things that it would take pages to list it all out (I should know, I tried and got edited down).
Data science is all about how we take data, use it to acquire knowledge, and then use that knowledge to do the following:
Make decisions
Predict the future
Understand the past/present
Create new industries/products
This book is all about the methods of data science, including how to process data, gather insights, and use those insights to make informed decisions and predictions.
Data science is about using data in order to gain new insights that you would otherwise have missed.
As an example, imagine you are sitting around a table with three other people. The four of you have to make a decision based on some data. There are four opinions to consider. You would use data science to bring a fifth, sixth, and even seventh opinion to the table.
That's why data science won't replace the human brain, but complement it, work alongside it. Data science should not be thought of as an end-all solution to our data woes; it is merely an opinion, a very informed opinion, but an opinion nonetheless. It deserves a seat at the table.
In this data age, it's clear that we have a surplus of data. But why should that necessitate an entire new set of vocabulary? What was wrong with our previous forms of analysis? For one, the sheer volume of data makes it literally impossible for a human to parse it in a reasonable time. Data is collected in various forms and from different sources, and often comes in very unorganized.
Data can be missing, incomplete, or just flat out wrong. Often, we have data on very different scales and that makes it tough to compare it. Consider that we are looking at data in relation to pricing used cars. One characteristic of a car being the year it was made and another might be the number of miles on that car. Once we clean our data (which we spend a great deal of time looking at in this book), the relationships between the data become more obvious, and the knowledge that was once buried deep in millions of rows of data simply pops out. One of the main goals of data science is to make explicit practices and procedures to discover and apply these relationships in the data.
Earlier, we looked at data science in a more historical perspective, but let's take a minute to discuss its role in business today, through a very simple example.
Ben Runkle, CEO, Sigma Technologies, is trying to resolve a huge problem. The company is consistently losing long-time customers. He does not know why they are leaving, but he must do something fast. He is convinced that in order to reduce his churn, he must create new products and features, and consolidate existing technologies. To be safe, he calls in his chief data scientist, Dr. Jessie Hughan. However, she is not convinced that new products and features alone will save the company. Instead, she turns to the transcripts of recent customer service tickets. She shows Runkle the most recent transcripts and finds something surprising:
"…. Not sure how to export this; are you?"
"Where is the button that makes a new list?"
"Wait, do you even know where the slider is?"
"If I can't figure this out today, it's a real problem..."
It is clear that customers were having problems with the existing UI/UX, and weren't upset due to a lack of features. Runkle and Hughan organized a mass UI/UX overhaul and their sales have never been better.
Of course, the science used in the last example was minimal, but it makes a point. We tend to call people like Runkle, a driver. Today's common stick-to-your-gut CEO wants to make all decisions quickly and iterate over solutions until something works. Dr. Haghun is much more analytical. She wants to solve the problem just as much as Runkle, but she turns to user-generated data instead of her gut feeling for answers. Data science is about applying the skills of the analytical mind and using them as a driver would.
Both of these mentalities have their place in today's enterprises; however, it is Hagun's way of thinking that dominates the ideas of data science—using data generated by the company as her source of information rather than just picking up a solution and going with it.
It is a common misconception that only those with a PhD or geniuses can understand the math/programming behind data science. This is absolutely false. Understanding data science begins with three basic areas:
The following Venn diagram provides a visual representation of how the three areas of data science intersect:
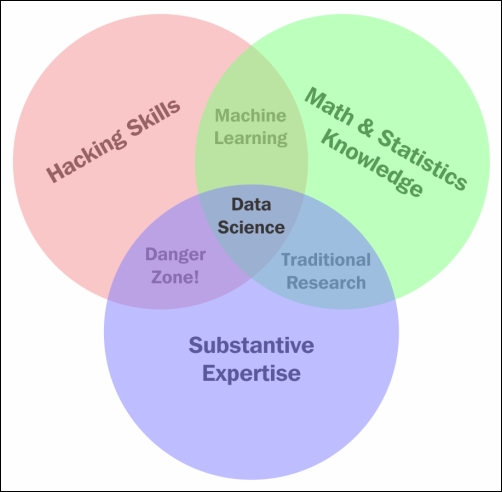
The Venn diagram of data science
Those with hacking skills can conceptualize and program complicated algorithms using computer languages. Having a Math & Statistics Knowledge base allows you to theorize and evaluate algorithms and tweak the existing procedures to fit specific situations. Having Substantive Expertise (domain expertise) allows you to apply concepts and results in a meaningful and effective way.
While having only two of these three qualities can make you intelligent, it will also leave a gap. Consider that you are very skilled in coding and have formal training in day trading. You might create an automated system to trade in your place but lack the math skills to evaluate your algorithms and, therefore, end up losing money in the long run. It is only when you can boast skills in coding, math, and domain knowledge that you can truly perform data science.
The one that was probably a surprise for you was Domain Knowledge. It is really just knowledge of the area you are working in. If a financial analyst started analyzing data about heart attacks, they might need the help of a cardiologist to make sense of a lot of the numbers.
Data Science is the intersection of the three key areas mentioned earlier. In order to gain knowledge from data, we must be able to utilize computer programming to access the data, understand the mathematics behind the models we derive, and above all, understand our analyses' place in the domain we are in. This includes the presentation of data. If we are creating a model to predict heart attacks in patients, is it better to create a PDF of information or an app where you can type in numbers and get a quick prediction? All these decisions must be made by the data scientist.
Note
Also, note that the intersection of math and coding is machine learning. This book will look at machine learning in great detail later on but it is important to note that without the explicit ability to generalize any models or results to a domain, machine learning algorithms remain just that, algorithms sitting on your computer. You might have the best algorithm to predict cancer. You could be able to predict cancer with over 99% accuracy based on past cancer patient data but if you don't understand how to apply this model in a practical sense such that doctors and nurses can easily use it, your model might be useless.
Both computer programming and math are covered extensively in this book. Domain knowledge comes with both practice of data science and reading examples of other people's analyses.
Most people stop listening once someone says the word math. They'll nod along in an attempt to hide their utter disdain for the topic. This book will guide you through the math needed for data science, specifically statistics and probability. We will use these subdomains of mathematics to create what are called models.
A data model refers to an organized and formal relationship between elements of data, usually meant to simulate a real-world phenomenon.
Essentially, we will use math in order to formalize relationships between variables. As a former pure mathematician and current math teacher, I know how difficult this can be. I will do my best to explain everything as clearly as I can. Between the three areas of data science, math is what allows us to move from domain to domain. Understanding the theory allows us to apply a model that we built for the fashion industry to a financial model.
The math covered in this book ranges from basic algebra to advanced probabilistic and statistical modeling. Do not skip over these chapters, even if you already know it or you're afraid of it. Every mathematical concept I introduce, I do so with care, examples, and purpose. The math in this book is essential for data scientists.
In biology, we use, among many others, a model known as the spawner-recruit model to judge the biological health of a species. It is a basic relationship between the number of healthy parental units of a species and the number of new units in the group of animals. In a public dataset of the number of salmon spawners and recruits, the following graph was formed to visualize the relationship between the two. We can see that there definitely is some sort of positive relationship (as one goes up, so does the other). But how can we formalize this relationship? For example, if we knew the number of spawners in a population, could we predict the number of recruits that group would obtain, and vice versa?
Essentially, models allow us to plug in one variable to get the other. Consider the following example:

In this example, let's say we knew that a group of salmons had 1.15 (in thousands) of spawners. Then, we would have the following:

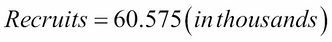
This result can be very beneficial to estimate how the health of a population is changing. If we can create these models, we can visually observe how the relationship between the two variables can change.
There are many types of data models, including probabilistic and statistical models. Both of these are subsets of a larger paradigm, called machine learning. The essential idea behind these three topics is that we use data in order to come up with the best model possible. We no longer rely on human instincts, rather, we rely on data.
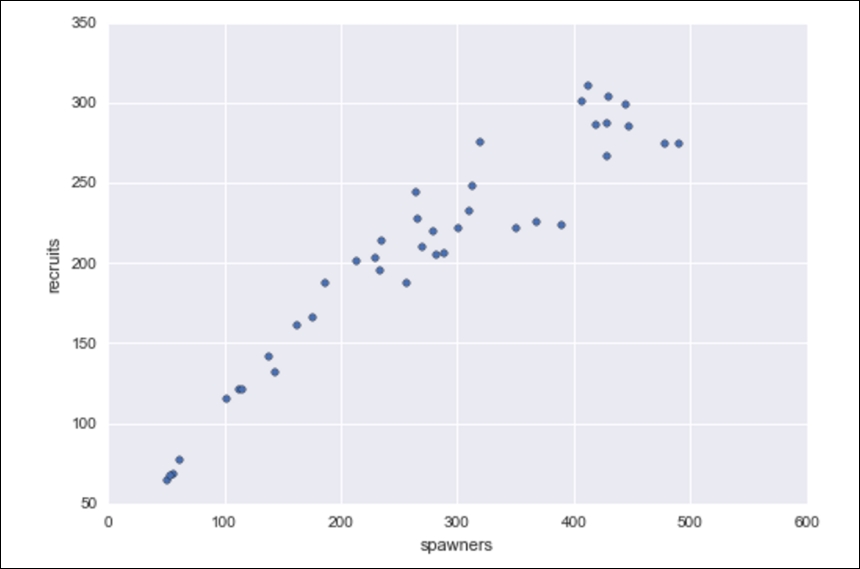
The spawner-recruit model visualized
The purpose of this example is to show how we can define relationships between data elements using mathematical equations. The fact that I used salmon health data was irrelevant! Throughout this book, we will look at relationships involving marketing dollars, sentiment data, restaurant reviews, and much more. The main reason for this is that I would like you (the reader) to be exposed to as many domains as possible.
Math and coding are vehicles that allow data scientists to step back and apply their skills virtually anywhere.
Let's be honest. You probably think computer science is way cooler than math. That's ok, I don't blame you. The news isn't filled with math news like it is with news on the technological front. You don't turn on the TV to see a new theory on primes, rather, you will see investigative reports on how the latest smartphone can take photos of cats better or something. Computer languages are how we communicate with the machine and tell it to do our bidding. A computer speaks many languages and, like a book, can be written in many languages; similarly, data science can also be done in many languages. Python, Julia, and R are some of the many languages available to us. This book will focus exclusively on using Python.
We will use Python for a variety of reasons:
Python is an extremely simple language to read and write, even if you've never coded before, which will make future examples easy to ingest and read later on, even after you have read this book
It is one of the most common languages, both in production and in the academic setting (one of the fastest growing, as a matter of fact)
The language's online community is vast and friendly. This means that a quick Google search should yield multiple results of people who have faced and solved similar (if not exactly the same) situations
Python has prebuilt data science modules that both the novice and the veteran data scientist can utilize
The last is probably the biggest reason we will focus on Python. These prebuilt modules are not only powerful, but also easy to pick up. By the end of the first few chapters, you will be very comfortable with these modules. Some of these modules are as follows:
pandassci-kit learnseabornnumpy/scipyrequests(to mine data from the Web)BeautifulSoup(for the Web-HTML parsing)
Before we move on, it is important to formalize many of the requisite coding skills in Python.
In Python, we have variables that are placeholders for objects. We will focus on only a few types of basic objects at first:
int(an integer)Examples: 3, 6, 99, -34, 34, 11111111
float(a decimal):Examples: 3.14159, 2.71, -0.34567
boolean(eitherTrueorFalse)The statement, Sunday is a weekend, is
TrueThe statement, Friday is a weekend, is
FalseThe statement, pi is exactly the ratio of a circle's circumference to its diameter, is
True(crazy, right?)
string(text or words made up of characters)"I love hamburgers" (by the way, who doesn't?)
"Matt is awesome"
A Tweet is a string
list(a collection of objects)Example: [1, 5.4, True, "apple"]
We will also have to understand some basic logistical operators. For these operators, keep the boolean datatype in mind. Every operator will evaluate to either True or False. Let's take a look at the following illustrations:
==evaluates toTrueif both sides are equal; otherwise it evaluates toFalse3 + 4 == 7 (will evaluate to
True)3 – 2 == 7 (will evaluate to
False)
<(less than)3 < 5 (
True)5 < 3 (
False)
<=(less than or equal to)3 <= 3 (
True)5 <= 3 (
False)
>(greater than)3 > 5 (
False)5 > 3 (
True)
>=(greater than or equal to)3 >= 3 (
True)5 >= 3 (
False)
When coding in Python, I will use a pound sign (#) to create a "comment," which will not be processed as code but is merely there to communicate with the reader. Anything to the right of a # sign is a comment on the code being executed.
In Python, we use spaces/tabs to denote operations that belong to other lines of code.
Tip
Note the use of the if statement. It means exactly what you think it means. When the statement after the if statement is True, then the tabbed part under it will be executed, as shown in the following code:
X = 5.8
Y = 9.5

X + Y == 15.3  # This is True!

X - Y == 15.3  # This is False!
5if x + y == 15.3:   # If the statement is true:
  print "True!"     # print something!
The print "True!" statement belongs to the if x + y == 15.3: line preceding it because it is tabbed right under it. This means that the print statement will be executed if and only if x + y equals 15.3.
Note that the following list variable, my_list, can hold multiple types of objects. This one has an int, a float, boolean, and string inputs (in that order):
my_list = [1, 5.7, True, "apples"]

len(my_list) == 4  # 4 objects in the list

my_list[0] == 1    # the first object


my_list[1] == 5.7    # the second object
In the preceding code:
I used the
lencommand to get the length of the list (which was four).Note the zero-indexing of Python. Most computer languages start counting at zero instead of one. So if I want the first element, I call the index zero, and if I want the 95th element, I call the index 94.
Here is some more Python code. In this example, I will be parsing some tweets about stock prices (one of the important case studies in this book will be trying to predict market movements based on popular sentiment regarding stocks on social media):
tweet = "RT @j_o_n_dnger: $TWTR now top holding for
             Andor, unseating $AAPL"

words_in_tweet = first_tweet.split(' ') # list of words in tweet

for word in words_in_tweet:             # for each word in list
  if "$" in word:                       # if word has a "cashtag"
  print "THIS TWEET IS ABOUT", word  # alert the user
I will point out a few things about this code snippet, line by line, as follows:
We set a variable to hold some text (known as a string in Python). In this example, the tweet in question is "
RT @robdv: $TWTR now top holding for Andor, unseating $AAPL"The
words_in_tweetvariable tokenizes the tweet (separates it by word). If you were to print this variable, you would see the following:['RT', '@robdv:', '$TWTR', 'now', 'top', 'holding', 'for', 'Andor,', 'unseating', '$AAPL']
We iterate through this list of words. This is called a
forloop. It just means that we go through a list one by one.Here, we have another
ifstatement. For each word in this tweet, if the word contains the$character (this is how people reference stock tickers on Twitter).If the preceding if statement is
true(that is, if the tweet contains a cashtag), print it and show it to the user.
The output of this code will be as follows:

We get this output as these are the only words in the tweet that use the cashtag. Whenever I use Python in this book, I will ensure that I am as explicit as possible about what I am doing in each line of code.
As I mentioned earlier, this category focuses mainly on having knowledge about the particular topic you are working on. For example, if you are a financial analyst working on stock market data, you have a lot of domain knowledge. If you are a journalist looking at worldwide adoption rates, you might benefit from consulting an expert in the field. This book will attempt to show examples from several problem domains, including medicine, marketing, finance, and even UFO sightings!
Does that mean that if you're not a doctor, you can't work with medical data? Of course not! Great data scientists can apply their skills to any area, even if they aren't fluent in it. Data scientists can adapt to the field and contribute meaningfully when their analysis is complete.
A big part of domain knowledge is presentation. Depending on your audience, it can greatly matter how you present your findings. Your results are only as good as your vehicle of communication. You can predict the movement of the market with 99.99% accuracy, but if your program is impossible to execute, your results will go unused. Likewise, if your vehicle is inappropriate for the field, your results will go equally unused.
This is a good time to define some more vocabulary. By this point, you're probably excitedly looking up a lot of data science material and seeing words and phrases I haven't used yet. Here are some common terminologies you are likely to come across:
Machine learning: This refers to giving computers the ability to learn from data without explicit "rules" being given by a programmer.
We have seen the concept of machine learning earlier in this chapter as the union of someone who has both coding and math skills. Here, we are attempting to formalize this definition. Machine learning combines the power of computers with intelligent learning algorithms in order to automate the discovery of relationships in data and create of powerful data models. Speaking of data models, we will concern ourselves with the following two basic types of data models:
Probabilistic model: This refers to using probability to find a relationship between elements that includes a degree of randomness.
Statistical model: This refers to taking advantage of statistical theorems to formalize relationships between data elements in a (usually) simple mathematical formula.
While both the statistical and probabilistic models can be run on computers and might be considered machine learning in that regard, we will keep these definitions separate as machine learning algorithms generally attempt to learn relationships in different ways.
We will take a look at the statistical and probabilistic models in the later chapters.
Exploratory data analysis (EDA) refers to preparing data in order to standardize results and gain quick insights.
EDA is concerned with data visualization and preparation. This is where we turn unorganized data into organized data and also clean up missing/incorrect data points. During EDA, we will create many types of plots and use these plots to identify key features and relationships to exploit in our data models.
Data mining is the process of finding relationships between elements of data.
Data mining is the part of data science where we try to find relationships between variables (think spawn-recruit model).
I tried pretty hard not to use the term big data up until now. This is because I think this term is misused, a lot. While the definition of this word varies from person, big data. Big Data is data that is too large to be processed by a single machine (if your laptop crashed, it might be suffering from a case of big data).

The state of data science (so far). This diagram is incomplete and is meant for visualization purposes only.
The combination of math, computer programming, and domain knowledge is what makes data science so powerful. Often, it is difficult for a single person to master all three of these areas. That's why it's very common for companies to hire teams of data scientists instead of a single person. Let's look at a few powerful examples of data science in action and their outcome.
Social security claims are known to be a major hassle for both the agent reading it and for the person who wrote the claim. Some claims take over 2 years to get resolved in their entirety, and that's absurd! Let's look at what goes into a claim:

Sample social security form
Not bad. It's mostly just text, though. Fill this in, then that, then this, and so on. You can see how it would be difficult for an agent to read these all day, form after form. There must be a better way!
Well, there is. Elder Research Inc. parsed this unorganized data and was able to automate 20% of all disability social security forms. This means that a computer could look at 20% of these written forms and give its opinion on the approval.
Not only that, the third-party company that is hired to rate the approvals of the forms actually gave the machine-graded forms a higher grade than the human forms. So, not only did the computer handle 20% of the load, it, on average, did better than a human.
Before I get a load of angry e-mails claiming that data science is bringing about the end of human workers, keep in mind that the computer was only able to handle 20% of the load. That means it probably performed terribly for 80% of the forms! This is because the computer was probably great at simple forms. The claims that would have taken a human minutes took the computer seconds to compute. But these minutes add up, and before you know it, each human is being saved over an hour a day!
Forms that might be easy for a human to read are also likely easy for the computer. It's when the form becomes very terse or when the writer starts deviating from usual grammar that the computer starts to fail. This model is great because it lets the humans spend more time on those difficult claims and gives them more attention without getting distracted by the sheer volume of papers.
A dataset shows the relationship between the money spent in the categories of TV, radio, and newspaper. The goal is to analyze the relationship between the three different marketing mediums and how it affects the sale of a product. Our data is in the form of a row and column structure. Each row represents a sales region and the columns tell us how much money was spent on each medium and the profit achieved in that region.
Note
Usually, the data scientist must ask for units and scale. In this case, I will tell you that TV, radio, and newspaper are measured in "thousands of dollars" and sales in "thousands of widgets sold". This means that in the first region, $230,100 was spent on TV advertising, $37,800 on radio advertising, and $69,200 on newspaper advertising. In the same region, 22,100 items were sold.

Advertising budgets
For example, in the third region, we spent $17,200 on TV advertising and sold 9,300 widgets.
If we plot each variable against sales, we get the following graphs:
import seaborn as sns
sns.pairplot(data, x_vars=['TV','Radio','Newspaper'], y_vars='Sales')

Graphs of advertising budgets
Note how none of these variables form a very strong line and, therefore, might not work well to predict sales (on their own). TV comes closest in forming an obvious relationship, but still even that isn't great. In this case, we will have to form a more complex model than the one we used in the spawner-recruiter model and combine all three variables in order to model sales.
This type of problem is very common in data science. In this example, we are attempting to identify key features that are associated with the sales of a product. If we can isolate these key features, then we can exploit these relationships and change how much we spend on advertising in different places with the hopes of increasing our sales.
Looking for a job in data science? Great, let me help. In this case study, I have "scraped" (taken from the Web) 1,000 job descriptions for companies actively hiring data scientists (as of January 2016). The goal here is to look at some of the most common keywords people use in their job descriptions.

An example of data scientist job listings.
(Note the second one asking for core Python libraries; we talk about these later on in this book)
import requests
# used to grab data from the web

from BeautifulSoup import BeautifulSoup
# used to parse HTML

from sklearn.feature_extraction.text import CountVectorizer
# used to count number of words and phrases (we will be using this module a lot)
The first two imports are used to grab web data from the website, Indeed.com, and the third import is meant to simply count the number of times a word or phrase appears.
texts = []
# hold our job descriptions in this list

for index in range(0,1000,10): # go through 100 pages of indeed
  page = 'indeed.com/jobs?q=data+scientist&start='+str(index)
  # identify the url of the job listings

  web_result = requests.get(page).text
  # use requests to actually visit the url

  soup  BeautifulSoup(web_result)
  # parse the html of the resulting page

  for listing in soup.findAll('span', {'class':'summary'}:
    # for each listing on the page

    texts.append(listing.text)
 # append the text of the listing to our list
Okay, before I lose you, all that this loop is doing is going through 100 pages of job descriptions, and for each page, grabbing each job description. The important variable here is texts, which is a list of over 1,000 job descriptions:
type(texts) # == list

vect = CountVectorizer(ngram_range=(1,2), stop_words='english')
# Get basic counts of one and two word phrases

matrix = vect.fit_transform(texts)
# fit and learn to the vocabulary in the corpus

print len(vect.get_feature_names())  # how many features are there
# There are 11,293 total one and two words phrases in my case!!
I have omitted some code here, but it exists in the GitHub repository for this book. The results are as follows (represented as the phrase, and then the number of of times it occurred):
experience 320
machine 306
learning 305
machine learning 294
techniques 266
statistical 215
team 197
analytics 173
business 167
statistics 159
algorithms 152
datamining 149
software 144
applied 141
programming 132
understanding 127
world 127
research 125
datascience 123
methods 122
join 122
quantitative 122
group 121
real 120
large 120
Notable things:
Machine learning and experience are at the top of the list. Experience comes with practice. A basic idea of machine learning comes with this book.
These words are followed closely by statistical words implying knowledge of math and theory.
The word
teamis very high up, implying that you will need to work with a team of data scientists; you won't be a lone wolf.Computer science words such as
algorithmsandprogrammingare prevalent.The words
techniques,understanding, andmethodsimply a more theoretical approach, ambivalent to any single domain.The word
businessimplies a particular problem domain.
There are many interesting things to note about this case study but the biggest take away is that there are many key words and phrases that make up a data science role. It isn't just math, coding, or domain knowledge; it truly is the combination of these three ideas (whether exemplified in a single person or across a multiperson team) that makes data science possible and powerful.
At the beginning of this chapter, I posed a simple question, what's the catch of data science? Well there is one. It isn't all fun, games and modelling. There must be a price to our quest for ever smarter machines and algorithms. As we seek new and innovative ways to discover data trends, a beast lurks in the shadows. I'm not talking about the learning curve of mathematics or programming nor am I referring to the surplus of data. The industrial age left us with an ongoing battle against pollution. The subsequent information age left behind a trail of big data. So, what dangers might the data age bring us?
The data age can lead to something much more sinister—the dehumanization of the individual through mass data.
More and more people are jumping headfirst into the field of data science, most with no prior experience in math or CS, which on the surface is great. Average data scientists have access to millions of dating profiles' data, tweets, online reviews, and much more in order to jumpstart their education.
However, if you jump into data science without the proper exposure to theory or coding practices and without respect of the domain you are working in, you face the risk of oversimplifying the very phenomenon you are trying to model.
For example, let's say you want to automate your sales pipeline by building a simplistic program that looks at LinkedIn for very specific keywords in a person's LinkedIn profile.
keywords = ["Saas", "Sales", "Enterprise"]
Great, now you can scan LinkedIn quickly to find people who match your criteria. But what about that person who spells out "Software as a Service" instead of "Saas" or misspells "enterprise" (it happens to the best of us; I bet someone will find a typo in my book). How will your model figure out that these people are also a good match? They should not be left behind just because the cut corners data scientist has overgeneralized people in such an easy way.
The programmer chose to simplify their search for another human by looking for three basic keywords and ended up with a lot of missed opportunities left on the table.
In the next chapter, we will explore the different types of data that exist in the world, ranging from free-form text to highly structured row/column files. We will also look at the mathematical operations that are allowed for different types of data, as well as deduce insights based on the form the data that comes in.

