


 Download code from GitHub
The goal of this chapter is to take you through the Machine learning landscape and lay out the basic concepts upfront for the chapters that follow. More importantly, the focus is to help you explore various learning strategies and take a deep dive into the different subfields of Machine learning. The techniques and algorithms under each subfield, and the overall architecture that forms the core for any Machine learning project implementation, are covered in depth.
There are many publications on Machine learning, and a lot of work has been done in past in this field. Further to the concepts of Machine learning, the focus will be primarily on specific practical implementation aspects through real-world examples. It is important that you already have a relatively high degree of knowledge in basic programming techniques and algorithmic paradigms; although for every programming section, the required primers are in place.
The following topics listed are covered in depth in this chapter:
Introduction to Machine learning
A basic definition and the usage context
The differences and similarities between Machine learning and data mining, Artificial Intelligence (AI), statistics, and data science
The relationship with big data
The terminology and mechanics: model, accuracy, data, features, complexity, and evaluation measures
Machine learning subfields: supervised learning, unsupervised learning, semi-supervised learning, reinforcement learning, and deep learning. Specific Machine learning techniques and algorithms are also covered under each of the machine learning subfields
Machine learning problem categories: Classification, Regression, Forecasting, and Optimization
Machine learning architecture, process lifecycle, and practical problems
Machine learning technologies, tools, and frameworks
Machine learning has been around for many years now and all social media users, at some point in time, have been consumers of Machine learning technology. One of the common examples is face recognition software, which is the capability to identify whether a digital photograph includes a given person. Today, Facebook users can see automatic suggestions to tag their friends in the digital photographs that are uploaded. Some cameras and software such as iPhoto also have this capability. There are many examples and use cases that will be discussed in more detail later in this chapter.
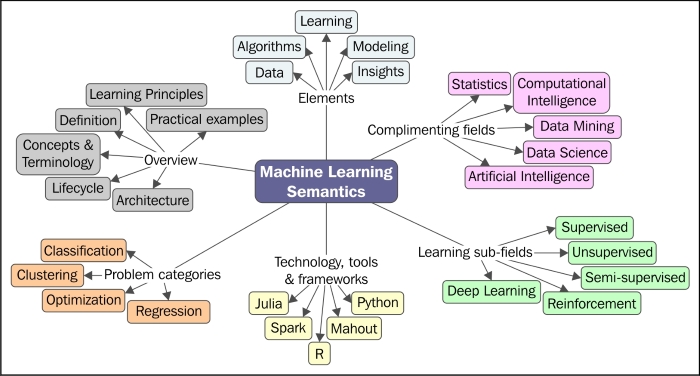
The following concept map represents the key aspects and semantics of Machine learning that will be covered throughout this chapter:
Let's start with defining what Machine learning is. There are many technical and functional definitions for Machine learning, and some of them are as follows:
"A computer program is said to learn from experience E with respect to some class of tasks T and performance measure P, if its performance at tasks in T, as measured by P, improves with experience E." | ||
| --Tom M. Mitchell | ||
"Machine learning is the training of a model from data that generalizes a decision against a performance measure." | ||
| --Jason Brownlee | ||
"A branch of artificial intelligence in which a computer generates rules underlying or based on raw data that has been fed into it." | ||
| --Dictionary.com | ||
"Machine learning is a scientific discipline that is concerned with the design and development of algorithms that allow computers to evolve behaviors based on empirical data, such as from sensor data or databases." | ||
| --Wikipedia | ||
The preceding definitions are fascinating and relevant. They either have an algorithmic, statistical, or mathematical perspective.
Beyond these definitions, a single term or definition for Machine learning is the key to facilitating the definition of a problem-solving platform. Basically, it is a mechanism for pattern search and building intelligence into a machine to be able to learn, implying that it will be able to do better in the future from its own experience.
Drilling down a little more into what a pattern typically is, pattern search or pattern recognition is essentially the study of how machines perceive the environment, learn to discriminate behavior of interest from the rest, and be able to take reasonable decisions about categorizing the behavior. This is more often performed by humans. The goal is to foster accuracy, speed, and avoid the possibility of inappropriate use of the system.
Machine learning algorithms that are constructed this way handle building intelligence. Essentially, machines make sense of data in much the same way that humans do.
The primary goal of a Machine learning implementation is to develop a general purpose algorithm that solves a practical and focused problem. Some of the aspects that are important and need to be considered in this process include data, time, and space requirements. Most importantly, with the ability to be applied to a broad class of learning problems, the goal of a learning algorithm is to produce a result that is a rule and is as accurate as possible.
Another important aspect is the big data context; that is, Machine learning methods are known to be effective even in cases where insights need to be uncovered from datasets that are large, diverse, and rapidly changing. More on the large scale data aspect of Machine learning will be covered in Chapter 2, Machine Learning and Large-scale Datasets.
At the heart of Machine learning is knowing and using the data appropriately. This includes collecting the right data, cleansing the data, and processing the data using learning algorithms iteratively to build models using certain key features of data, and based on the hypotheses from these models, making predictions.
In this section, we will cover the standard nomenclature or terminology used in machine learning, starting from how to describe data, learning, modeling, algorithms, and specific machine learning tasks.
Now, let us look at the definition of "learning" in the context of Machine learning. In simple terms, historical data or observations are used to predict or derive actionable tasks. Very clearly, one mandate for an intelligent system is its ability to learn. The following are some considerations to define a learning problem:
Provide a definition of what the learner should learn and the need for learning.
Define the data requirements and the sources of the data.
Define if the learner should operate on the dataset in entirety or a subset will do.
Before we plunge into understanding the internals of each learning type in the following sections, you need to understand the simple process that is followed to solve a learning problem, which involves building and validating models that solve a problem with maximum accuracy.
Tip
A model is nothing but an output from applying an algorithm to a dataset, and it is usually a representation of the data. We cover more on models in the later sections.
In general, for performing Machine learning, there are primarily two types of datasets required. The first dataset is usually manually prepared, where the input data and the expected output data are available and prepared. It is important that every piece of input data has an expected output data point available as this will be used in a supervised manner to build the rule. The second dataset is where we have the input data, and we are interested in predicting the expected output.
As a first step, the given data is segregated into three datasets: training, validation, and testing. There is no one hard rule on what percentage of data should be training, validation, and testing datasets. It can be 70-10-20, 60-30-10, 50-25-25, or any other values.
The training dataset refers to the data examples that are used to learn or build a classifier, for example. The validation dataset refers to the data examples that are verified against the built classifier and can help tune the accuracy of the output. The testing dataset refers to the data examples that help assess the performance of the classifier.
There are typically three phases for performing Machine learning:
Phase 1—Training Phase: This is the phase where training data is used to train the model by pairing the given input with the expected output. The output of this phase is the learning model itself.
Phase 2—Validation and Test Phase: This phase is to measure how good the learning model that has been trained is and estimate the model properties, such as error measures, recall, precision, and others. This phase uses a validation dataset, and the output is a sophisticated learning model.
Phase 3—Application Phase: In this phase, the model is subject to the real-world data for which the results need to be derived.
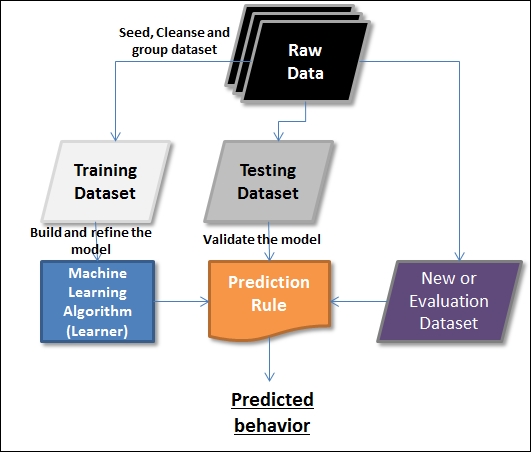
The following figure depicts how learning can be applied to predict the behavior:
Data forms the main source of learning in Machine learning. The data that is being referenced here can be in any format, can be received at any frequency, and can be of any size. When it comes to handling large datasets in the Machine learning context, there are some new techniques that have evolved and are being experimented with. There are also more big data aspects, including parallel processing, distributed storage, and execution. More on the large-scale aspects of data will be covered in the next chapter, including some unique differentiators.
When we think of data, dimensions come to mind. To start with, we have rows and columns when it comes to structured and unstructured data. This book will cover handling both structured and unstructured data in the machine learning context. In this section, we will cover the terminology related to data within the Machine learning context.
Data in the Machine learning context can either be labeled or unlabeled. Before we go deeper into the Machine learning basics, you need to understand this categorization, and what data is used when, as this terminology will be used throughout this book.
Unlabeled data is usually the raw form of the data. It consists of samples of natural or human-created artifacts. This category of data is easily available in abundance. For example, video streams, audio, photos, and tweets among others. This form of data usually has no explanation of the meaning attached.
The unlabeled data becomes labeled data the moment a meaning is attached. Here, we are talking about attaching a "tag" or "label" that is required, and is mandatory, to interpret and define the relevance. For example, labels for a photo can be the details of what it contains, such as animal, tree, college, and so on, or, in the context of an audio file, a political meeting, a farewell party, and so on. More often, the labels are mapped or defined by humans and are significantly more expensive to obtain than the unlabeled raw data.
The learning models can be applied to both labeled and unlabeled data. We can derive more accurate models using a combination of labeled and unlabeled datasets. The following diagram represents labeled and unlabeled data. Both triangles and bigger circles represent labeled data and small circles represent unlabeled data.
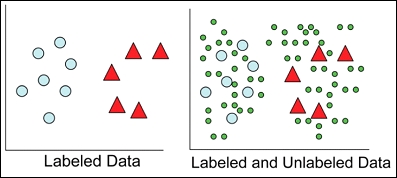
The application of labeled and unlabeled data is discussed in more detail in the following sections. You will see that supervised learning adopts labeled data and unsupervised learning adopts unlabeled data. Semi-supervised learning and deep learning techniques apply a combination of labeled and unlabeled data in a variety of ways to build accurate models.
A task is a problem that the Machine learning algorithm is built to solve. It is important that we measure the performance on a task. The term "performance" in this context is nothing but the extent or confidence with which the problem is solved. Different algorithms when run on different datasets produce a different model. It is important that the models thus generated are not compared, and instead, the consistency of the results with different datasets and different models is measured.
After getting a clear understanding of the Machine learning problem at hand, the focus is on what data and algorithms are relevant or applicable. There are several algorithms available. These algorithms are either grouped by the learning subfields (such as supervised, unsupervised, reinforcement, semi-supervised, or deep) or the problem categories (such as Classification, Regression, Clustering or Optimization). These algorithms are applied iteratively on different datasets, and output models that evolve with new data are captured.
Models are central to any Machine learning implementation. A model describes data that is observed in a system. Models are the output of algorithms applied to a dataset. In many cases, these models are applied to new datasets that help the models learn new behavior and also predict them. There is a vast range of machine learning algorithms that can be applied to a given problem. At a very high level, models are categorized as the following:
Logical models
Geometric models
Probabilistic models
Logical models are more algorithmic in nature and help us derive a set of rules by running the algorithms iteratively. A Decision tree is one such example:
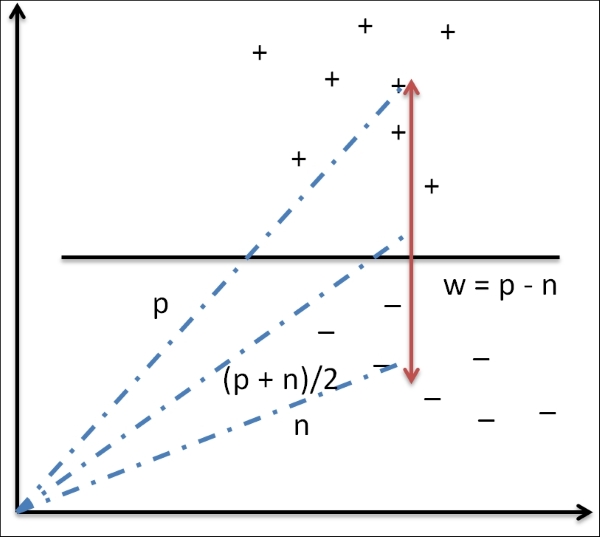
Geometric models use geometric concepts such as lines, planes, and distances. These models usually operate, or can operate, on high volumes of data. Usually, linear transformations help compare different Machine learning methods:
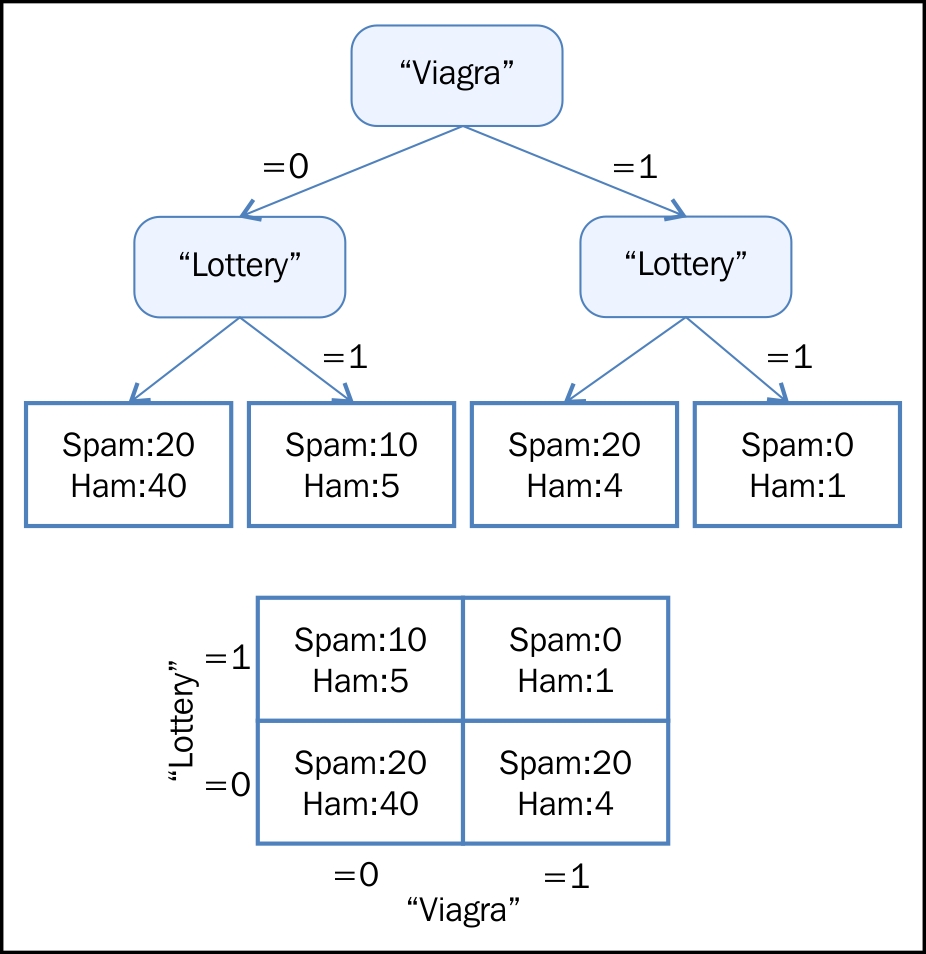
Probabilistic models are statistical models that employ statistical techniques. These models are based on a strategy that defines the relationship between two variables. This relationship can be derived for sure as this involves using a random background process. In most cases, a subset of the overall data can be considered for processing:
|
Viagra |
Lottery |
P(Y= Spam (Viagra, lottery)) |
P(Y= ham (Viagra, lottery)) |
|---|---|---|---|
|
0 |
0 |
0.31 |
0.69 |
|
0 |
1 |
0.65 |
0.35 |
|
1 |
0 |
0.80 |
0.20 |
|
1 |
1 |
0.40 |
0.60 |
This section details all the possible data inconsistencies that may be encountered while implementing Machine learning projects, such as:
Under-fitting
Over-fitting
Data instability
Unpredictable future
Fortunately, there are some established processes in place today to address these inconsistencies. The following sections cover these inconsistencies.
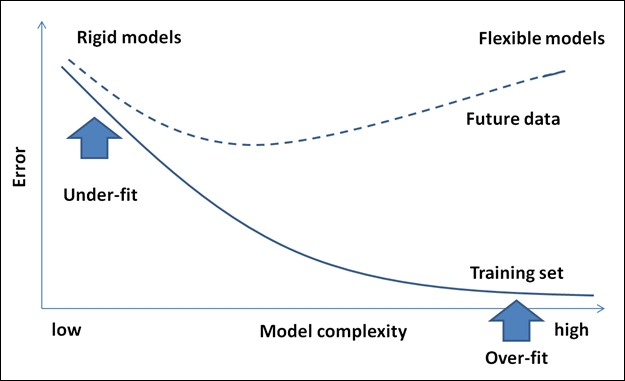
A model is said to be under-fitting when it doesn't take into consideration enough information to accurately model the actual data. For example, if only two points on an exponential curve are mapped, this possibly becomes a linear representation, but there could be a case where a pattern does not exist. In cases like these, we will see increasing errors and subsequently an inaccurate model. Also, in cases where the classifier is too rigid or is not complex enough, under-fitting is caused not just due to a lack of data, but can also be a result of incorrect modeling. For example, if the two classes form concentric circles and we try to fit a linear model, assuming they were linearly separable, this could potentially result in under-fitting.
The accuracy of the model is determined by a measure called "power" in the statistical world. If the dataset size is too small, we can never target an optimal solution.
This case is just the opposite of the under-fitting case explained before. While too small a sample is not appropriate to define an optimal solution, a large dataset also runs the risk of having the model over-fit the data. Over-fitting usually occurs when the statistical model describes noise instead of describing the relationships. Elaborating on the preceding example in this context, let's say we have 500,000 data points. If the model ends up catering to accommodate all 500,000 data points, this becomes over-fitting. This will in effect mean that the model is memorizing the data. This model works well as long as the dataset does not have points outside the curve. A model that is over-fit demonstrates poor performance as minor fluctuations in data tend to be exaggerated. The primary reason for over-fitting also could be that the criterion used to train the model is different from the criterion used to judge the efficacy of the model. In simple terms, if the model memorizes the training data rather than learning, this situation is seen to occur more often.
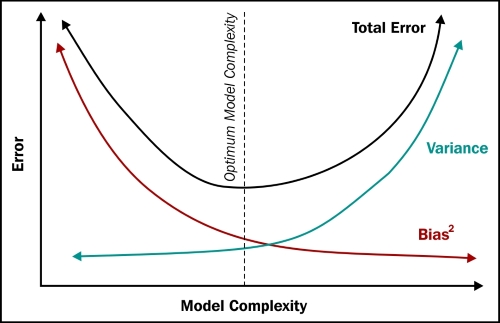
Now, in the process of mitigating the problem of under-fitting the data, by giving it more data, this can in itself be a risk and end up in over-fitting. Considering that more data can mean more complexity and noise, we could potentially end up with a solution model that fits the current data at hand and nothing else, which makes it unusable. In the following graph, with the increasing model complexity and errors, the conditions for over-fit and under-fit are pointed out:
Machine learning algorithms are usually robust to noise within the data. A problem will occur if the outliers are due to manual error or misinterpretation of the relevant data. This will result in a skewing of the data, which will ultimately end up in an incorrect model.
Therefore, there is a strong need to have a process to correct or handle human errors that can result in building an incorrect model.
Machine learning is meant to work with new data constantly coming into the system and learning from that data. Complexity will creep in when the new data entering the system comes in formats that are not supported by the machine learning system. It is now difficult to say if our models work well for the new data given the instability in the formats that we receive the data, unless there is a mechanism built to handle this.
In this section, let's explore some real-world machine learning applications. We covered various examples within the introductory section of this chapter and we will now cover some domain-specific examples with a brief description of each problem.
For online and offline applications, some of the following examples can easily be guessed. In the chapters to follow, a subset of these examples will be picked to demonstrate the practical implementation aspects using suitable Machine learning algorithms.
This section focuses on elaborating different learning problem categories. Machine learning algorithms are also classified under these learning problems. The following figure depicts various types of learning problems:
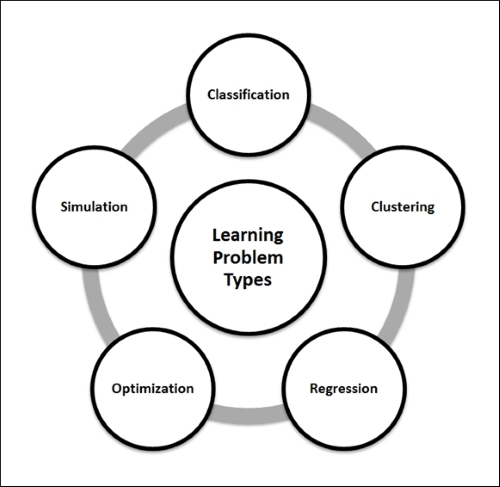
Classification is a way to identify a grouping technique for a given dataset in such a way that depending on a value of the target or output attribute, the entire dataset can be qualified to belong to a class. This technique helps in identifying the data behavior patterns. This is, in short, a discrimination mechanism.
For example, a sales manager needs help in identifying a prospective customer and wants to determine whether it is worth spending the effort and time the customer demands. The key input for the manager is the customer's data, and this case is commonly referred to as Total Lifetime Value (TLV).
We take the data and start plotting blindly on a graph (as shown in the following graph) with the x axis representing the total items purchased and the y axis representing the total money spent (in multiples of hundreds of dollars). Now we define the criteria to determine, for example, whether a customer is good or bad. In the following graph, all the customers who spend more than 800 dollars in a single purchase are categorized as good customers (note that this is a hypothetical example or analysis).
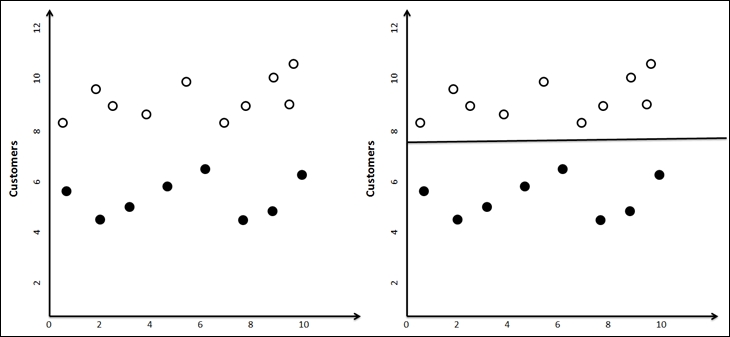
Now when new customer data comes in, the sales manager can plot the new customers on this graph and based on which side they fall, predict whether the customer is likely to be good or bad.
In many cases, the data analyst is just given some data and is expected to unearth interesting patterns that may help derive intelligence. The main difference between this task and that of a classification is that in the classification problem, the business user specifies what he/she is looking for (a good customer or a bad customer, a success or a failure, and so on).
Let's now expand on the same example considered in the classification section. Here the patterns to classify the customers are identified without any target in mind or any prior classification, and unlike running a classification, the results may always not be the same (for example, depending on how the initial centroids are picked). An example modeling method for clustering is k-means clustering. More details on k-means clustering is covered in the next section and in detail in the following chapters.
In short, clustering is a classification analysis that does not start with a specific target in mind (good/bad, will buy/will not buy).
Similar to classification, forecasting or prediction is also about identifying the way things would happen in the future. This information is derived from past experience or knowledge. In some cases, there is not enough data, and there is a need to define the future through regression. Forecasting and prediction results are always presented along with the degree of uncertainty or probability. This classification of the problem type is also called rule extraction.
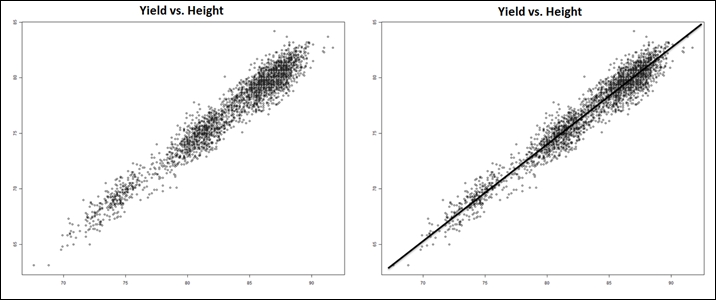
Let's take an example here, an agricultural scientist working on a new crop that she developed. As a trial, this seed was planted at various altitudes and the yield was computed. The requirement here is to predict the yield of the crop given the altitude details (and some more related data points). The relationship between yield gained and the altitude is determined by plotting a graph between the parameters. An equation is noted that fits most of the data points, and in cases where data does not fit the curve, we can get rid of the data. This technique is called regression.
In addition to all the techniques we defined until now, there might be situations where the data in context itself has many uncertainty. For example, an outsourcing manager is given a task and can estimate with experience that the task can be done by an identified team with certain skills in 2-4 hours.
Let's say the cost of input material may vary between $100-120 and the number of employees who come to work on any given day may be between 6 and 9. An analyst then estimates how much time the project might take. Solving such problems requires the simulation of a vast amount of alternatives.
Typically in forecasting, classification, and unsupervised learning, we are given data and we really do not know how the data is interconnected. There is no equation to describe one variable as a function of others.
Essentially, data scientists combine one or more of the preceding techniques to solve challenging problems, which are:
Optimization, in simple terms, is a mechanism to make something better or define a context for a solution that makes it the best.
Considering a production scenario, let's assume there are two machines that produce the desired product but one machine requires more energy for high speed in production and lower raw materials while the other requires higher raw materials and less energy to produce the same output in the same time. It is important to understand the patterns in the output based on the variation in inputs; a combination that gives the highest profits would probably be the one the production manager would want to know. You, as an analyst, need to identify the best possible way to distribute the production between the machines that gives him the highest profit.
The following image shows the point of highest profit when a graph was plotted for various distribution options between the two machines. Identifying this point is the goal of this technique.
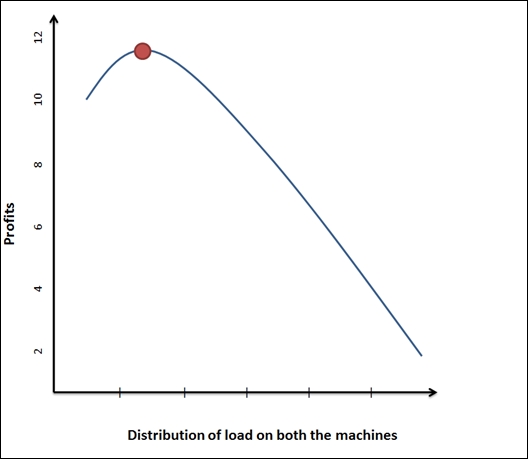
Unlike the case of simulations where there is uncertainty associated with the input data, in optimization we not only have access to data, but also have the information on the dependencies and relationships between data attributes.
One of the key concepts in Machine learning is a process called induction. The following learning subfields use the induction process to build models. Inductive learning is a reasoning process that uses the results of one experiment to run the next set of experiments and iteratively evolve a model from specific information.
The following figure depicts various subfields of Machine learning. These subfields are one of the ways the machine learning algorithms are classified.
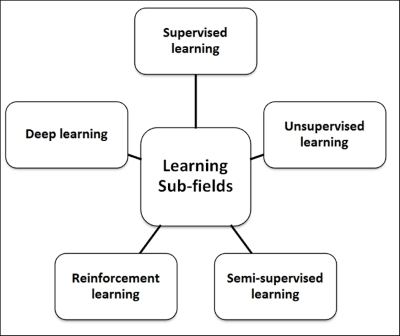
Supervised learning is all about operating to a known expectation and in this case, what needs to be analyzed from the data being defined. The input datasets in this context are also referred to as "labeled" datasets. Algorithms classified under this category focus on establishing a relationship between the input and output attributes, and use this relationship speculatively to generate an output for new input data points. In the preceding section, the example defined for the classification problem is also an example of supervised learning. Labeled data helps build reliable models but is usually expensive and limited.
When the input and output attributes of the data are known, the key in supervised learning is the mapping between the inputs to outputs. There are quite a few examples of these mappings, but the complicated function that links up the input and output attributes is not known. A supervised learning algorithm takes care of this linking, and given a large dataset of input/output pairs, these functions help predict the output for any new input value.
In some of the learning problems, we do not have any specific target in mind to solve. In the earlier section, we discussed clustering, which is a classification analyses where we do not start with a specific target in mind (good/bad, will buy/will not buy) and is hence referred to as unsupervised analyses or learning. The goal in this case is to decipher the structure in the data against the build mapping between input and output attributes of data and, in fact, the output attributes are not defined. These learning algorithms operate on an "unlabeled" dataset for this reason.
Semi-supervised learning is about using both labeled and unlabeled data to learn models better. It is important that there are appropriate assumptions for the unlabeled data and any inappropriate assumptions can invalidate the model. Semi-supervised learning gets its motivation from the human way of learning.
Reinforcement learning is learning that focuses on maximizing the rewards from the result. For example, while teaching toddlers new habits, rewarding them every time they follow instructions works very well. In fact, they figure out what behavior helps them earn rewards. This is reinforcement learning, and it is also called credit assessment learning.
The most important thing is that in reinforcement learning the model is additionally responsible for making decisions for which a periodic reward is received. The results in this case, unlike supervised learning, are not immediate and may require a sequence of steps to be executed before the final result is seen. Ideally, the algorithm will generate a sequence of decisions that helps achieve the highest reward or utility.
The goal in this learning technique is to measure the trade-offs effectively by exploring and exploiting the data. For example, when a person has to travel from a point A to point B, there will be many ways that include travelling by air, water, road or by walking, and there is significant value in considering this data by measuring the trade-offs for each of these options. Another important aspect is the significance of a delay in the rewards. How would this affect learning? For example, in games like chess, any delay in reward identification may change the result.
Deep learning is an area of Machine learning that focuses on unifying Machine learning with artificial intelligence. In terms of the relationship with artificial neural networks, this field is more of an advancement to artificial neural networks that work on large amounts of common data to derive practical insights. It deals with building more complex neural networks to solve problems classified under semi-supervised learning and operates on datasets that have little labeled data. Some Deep learning techniques are listed as follows:
Performance measures are used to evaluate learning algorithms and form an important aspect of machine learning. In some cases, these measures are also used as heuristics to build learning models.
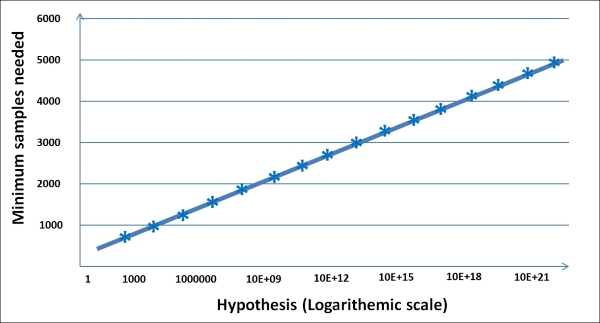
Now let's explore the concept of the Probably Approximately Correct (PAC) theory. While we describe the accuracy of hypothesis, we usually talk about two types of uncertainties as per the PAC theory:
The following graph shows how the number of samples grow with error, probability, and hypothesis:
The error measures for a classification and prediction problem are different. In this section, we will cover some of these error measures followed by how they can be addressed.
In a classification problem, you can have two different types of errors, which can be elegantly represented using the "confusion matrix". Let's say in our target marketing problem, we work on 10,000 customer records to predict which customers are likely to respond to our marketing effort.
After analyzing the campaign, you can construct the following table, where the columns are your predictions and the rows are the real observations:
|
Action |
Predicted (that there will be a buy) |
Predicted (that there will be no buy) |
|---|---|---|
|
Actually bought |
TP: 500 |
FN: 400 |
|
Actually did not buy |
FP: 100 |
TN: 9000 |
In the principal diagonal, we have buyers and non-buyers for whom the prediction matched with reality. These are correct predictions. They are called true positive and true negative respectively. In the upper right-hand side, we have those who we predicted are non-buyers, but in reality are buyers. This is an error known as a false negative error. In the lower left-hand side, we have those we predicted as buyers, but are non-buyers. This is another error known as false positive.
Are both errors equally expensive for the customers? Actually no! If we predict that someone is a buyer and they turn out to be a non-buyer, the company at most would have lost money spent on a mail or a call. However, if we predicted that someone would not buy and they were in fact buyers, the company would not have called them based on this prediction and lost a customer. So, in this case, a false negative is much more expensive than a false positive error.
The Machine learning community uses three different error measures for classification problems:
Measure 1: Accuracy is the percent of predictions that were correct.
Example: The "accuracy" was (9,000+500) out of 10,000 = 95%
Measure 2: Recall is the percent of positives cases that you were able to catch. If false positives are low, recall will be high.
Example: The "recall" was 500 out of 600 = 83.33%
Measure 3: Precision is the percent of positive predictions that were correct. If false negatives are low, precision is high.
Example: The "precision" was 500 out of 900 = 55.55%
In forecasting, you are predicting a continuous variable. So, the error measures are fairly different here. As usual, the error metrics are obtained by comparing the predictions of the models with the real values of the target variables and calculating the average error. Here are a few metrics.
To compute the MSE, we first take the square of the difference between the actual and predicted values of every record. We then take the average value of these squared errors. If the predicted value of the ith record is Pi and the actual value is Ai, then the MSE is:
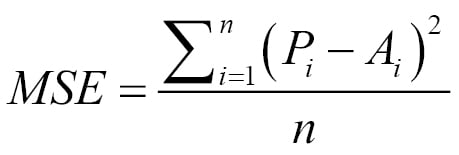
It is also common to use the square root of this quantity called root mean square error (RMSE).
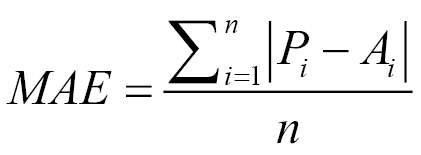
To compute the MAE, we take the absolute difference between the predicted and actual values of every record. We then take the average of those absolute differences. The choice of performance metric depends on the application. The MSE is a good performance metric for many applications as it has more statistical grounding with variance. On the other hand, the MAE is more intuitive and less sensitive to outliers. Looking at the MAE and RMSE gives us additional information about the distribution of the errors. In regression, if the RMSE is close to the MAE, the model makes many relatively small errors. If the RMSE is close to the MAE2, the model makes a few but large errors.
Both the MSE and MAE do not indicate how big the error is as they are numeric values depending on the scale of the target variable. Comparing with a benchmarking index provides a better insight. The common practice is to take the mean of the primary attribute we are predicting and assume that our naïve prediction model is just the mean. Then we compute the MSE based on the naïve model and the original model. The ratio provides an insight into how good or bad our model is compared to the naïve model.
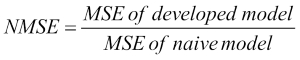
A similar definition can also be used for the MAE.
This trap of building highly customized higher order models is called over-fitting and is a critical concept. The resulting error is known as the variance of the model. Essentially, if we had taken a different training set, we would have obtained a very different model. Variance is a measure of the dependency of model on the training set. By the way, the model you see on the right most side (linear fit) is called under-fitting and the error caused due to under-fitting is called bias. In an under-fitting or high bias situation, the model does not explain the relationship between the data. Essentially, we're trying to fit an overly simplistic hypothesis, for example, linear where we should be looking for a higher order polynomial.
To avoid the trap of over-fitting and under-fitting, data scientists build the model on a training set and then find the error on a test set. They refine the model until the error in the test set comes down. As the model starts getting customized to the training data, the error on the test set starts going up. They stop refining the model after that point.
Let's analyze bias and variance a bit more in this chapter and learn a few practical ways of dealing with them. The error in any model can be represented as a combination of bias, variance, and random error. With Err(x)=Bias2+Variance+Irreducible Error in less complex models, the bias term is high, and in models with higher complexity, the variance term is high, as shown in the following figure:
To reduce bias or variance, let's first ask this question. If a model has a high bias, how does its error vary as a function of the amount of data?
At a very low data size, any model can fit the data well (any model fits a single point, any linear model can fit two points, a quadratic can fit three points, and so on). So, the error of a high bias model on a training set starts minuscule and goes up with increasing data points. However, on the test set, the error remains high initially as the model is highly customized to the training set. As the model gets more and more refined, the error reduces and becomes equal to that of the training set.
The following graph depicts the situation clearly:
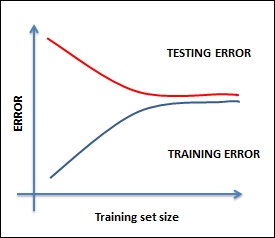
The remedy for this situation could be one of the following:
Most likely, you are working with very few features, so you must find more features
Increase the complexity of the model by increasing polynomials and depth
Increasing the data size will not be of much help if the model has a high bias
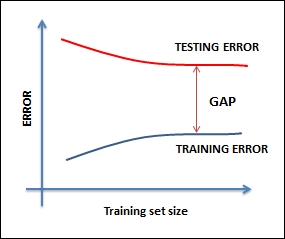
When you face such situations, you can try the following remedies (the reverse of the previous ones):
Most likely, you are working with too many features, so, you must reduce the features
Decrease the complexity of the model
Increasing the data size will be some help
Machine learning has a close relationship to many related fields including artificial intelligence, data mining, statistics, data science, and others listed shortly. In fact, Machine learning is in that way a multi-disciplinary field, and in some ways is linked to all of these fields.
In this section, we will define some of these fields, draw parallels to how they correlate to Machine learning, and understand the similarities and dissimilarities, if any. Overall, we will start with the core Machine learning definition as a field of science that includes developing self-learning algorithms. Most of the fields we are going to discuss now either use machine learning techniques or a superset or subset of machine learning techniques.
Data mining is a process of analyzing data and deriving insights from a (large) dataset by applying business rules to it. The focus here is on the data and the domain of the data. Machine learning techniques are adopted in the process of identifying which rules are relevant and which aren't.
Artificial intelligence focuses on building systems that can mimic human behavior. It has been around for a while now and the modern AI has been continuously evolving, now includes specialized data requirements. Among many other capabilities, AI should demonstrate the following:
Knowledge storage and representation to hold all the data that is subject to interrogation and investigation
Natural Language Processing (NLP) capabilities to be able to process text
Reasoning capabilities to be able to answer questions and facilitate conclusions
The ability to plan, schedule, and automate
Machine learning to be able to build self-learning algorithms
Robotics and more
Machine learning is a subfield of artificial intelligence.
In statistical learning, the predictive functions are arrived at and primarily derived from samples of data. It is of great importance how the data is collected, cleansed, and managed in this process. Statistics is pretty close to mathematics, as it is about quantifying data and operating on numbers.
Data science is all about turning data into products. It is analytics and machine learning put into action to draw inferences and insights out of data. Data science is perceived to be a first step from traditional data analysis and knowledge systems, such as Data Warehouses (DW) and Business Intelligence (BI), which considers all aspects of big data.
The data science lifecycle includes steps from data availability/loading to deriving and communicating data insights up to operationalizing the process, and Machine learning often forms a subset of this process.
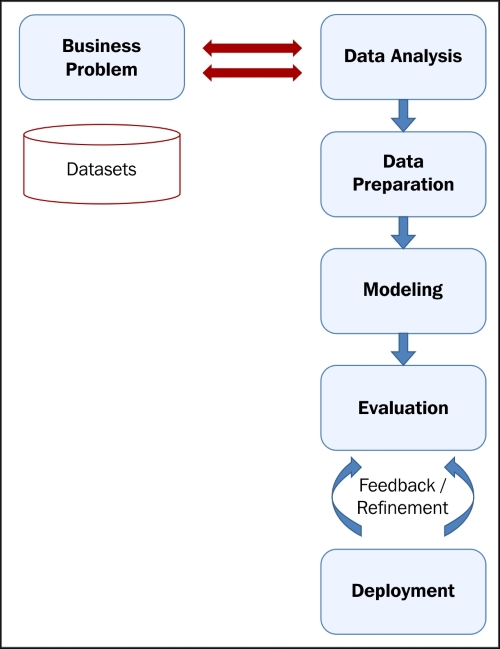
In this section, we will discuss the machine learning implementation process and solution architecture:
The first step toward defining the solution architecture is defining the problem statement, which includes defining the goal, process, and assumptions.
Determine what problem type is this problem classified under? Whether it is a classification, regression, or optimization problem?
Choose a metric that will be used to measure the accuracy of the model.
In order to ensure the model works well with the unseen data:
Build the model using training data.
Tweak the model using test data.
Declare an accuracy based on the final version.
The following figure explains the flow and architecture of the underlying system:
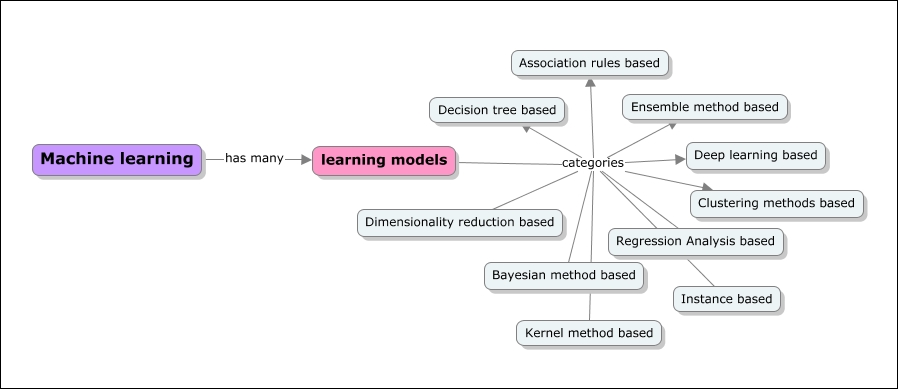
Now, let's look at the important machine learning algorithms and some brief details about each of them. In-depth implementation aspects for each of the algorithms will be covered in later chapters. These algorithms are either classified under the problem type or the learning type. There is a simple classification of the algorithms given but it is intuitive and not necessarily exhaustive.
There are many ways of classifying or grouping machine learning algorithms, and in this book we will use the learning model based grouping. In each chapter, starting from Chapter 5, Decision Tree based learning, we will cover one or more learning models and associated algorithms. The following concept model depicts a listing of learning models:
Decision tree based algorithms define models that are iteratively or recursively constructed based on the data provided. The goal of Decision tree based algorithms is to predict the value of a target variable given a set of input variables. Decision trees help solve classification and regression problems using tree based methods. Decisions fork in tree structures until a prediction decision is made for a given record. Some of the algorithms are as follows:
Bayesian methods are those that explicitly apply the Bayesian inference theorem and again solve classification and regression problems. Bayesian methods facilitate subjective probability in modeling. The following are some of the Bayesian based algorithms:
When we hear about kernel methods, the first thing that comes to mind is Support Vector Machines (SVM). These methods are usually a group of methods in themselves. kernel methods are concerned with pattern analysis and as explained in the preceding sections, that crux of pattern analysis includes various mapping techniques. Here, the mapping datasets include vector spaces. Some examples of kernel method based learning algorithms are listed as follows:
SVM
Linear discriminant analysis (LDA)
Clustering, like regression, describes a class of problems and a class of methods. Clustering methods are typically organized by the modeling approaches such as centroid-based and hierarchical. These methods organize data into groups by assessing the similarity in the structure of input data:
Similar to kernel methods, artificial neural networks are again a class of pattern matching techniques, but these models are inspired by the structure of biological neural networks. These methods are again used to solve classifications and regression problems. They relate to Deep learning modeling and have many subfields of algorithms that help solve specific problems in context.
Like clustering methods, dimensionality reduction methods work iteratively and on the data structure in an unsupervised manner. Given the dataset and the dimensions, more dimensions would mean more work in the Machine learning implementation. The idea is to iteratively reduce the dimensions and bring more relevant dimensions forward. This technique is usually used to simplify high-dimensional data and then apply a supervised learning technique. Some example dimensionality reduction methods are listed as follows:
As the name suggests, ensemble methods encompass multiple models that are built independently and the results of these models are combined and responsible for overall predictions. It is critical to identify what independent models are to be combined or included, how the results need to be combined, and in what way to achieve the required result. The subset of models that are combined is sometimes referred to as weaker models as the results of these models need not completely fulfill the expected outcome in isolation. This is a very powerful and widely adopted class of techniques. The following are some of the Ensemble method algorithms:
Instances are nothing but subsets of datasets, and instance based learning models work on an identified instance or groups of instances that are critical to the problem. The results across instances are compared, which can include an instance of new data as well. This comparison uses a particular similarity measure to find the best match and predict. Instance based methods are also called case-based or memory-based learning. Here the focus is on the representation of the instances and similarity measures for comparison between instances. Some of the instance based learning algorithms are listed as follows:
Regression is a process of refining the model iteratively based on the error generated by the model. Regression also is used to define a machine learning problem type. Some example algorithms in regression are:
Given the variables, association rule based learning algorithms extract and define rules that can be applied on a dataset and demonstrate experienced-based learning, and thus prediction. These rules when associated in a multi-dimensional data context can be useful in a commercial context as well. Some of the examples of Association rule based algorithms are given as follows:
Machine learning adoption is rapidly increasing among technology and business organizations. Every organization is actively strategizing on how to capitalize on their data and use it to augment their client's experiences and build new businesses. When it comes to tools or frameworks for Machine learning, there are many open source and commercial options on the market. The new age tools are all built to support big data, distributed storage, and parallel processing. In the next chapter, we will cover some aspects of handling large scale data in the context of Machine learning.
At a very high level, there are three generations of Machine learning tools.
The first generation of Machine learning tools is focused on providing a richness of the Machine learning algorithms and supporting deep analytics. These tools haven't been built to focus on handling large scale data or for supporting distributed storage and parallel processing. Some of them still handle volumes as a result of their support for vertical scalability. Some of the tools that come under this category are SAS, SPSS, Weka, R, and more. Having said that, most of these tools are now being upgraded to support big data requirements too.
The second generation tools are focused on supporting big data requirements, most of them work on the Hadoop platform, and they provide capabilities to run machine learning algorithms in a MapReduce paradigm. Some of the tools that are categorized here are Mahout, RapidMiner, Pentaho, and MADlib. Some of these tools do not support all the machine learning algorithms.
The third generations tools are the smart kids on the road, breaking the traditional norms of operating in batch mode, supporting real-time analytics, providing support for advanced data types of big data, and at the same time supporting deeper analytics. Some of the tools that are categorized under this are Spark, HaLoop, and Pregel.
In Chapter 4, Machine Learning Tools, Libraries, and Frameworks, we will cover some of the key machine learning tools and demonstrate how they can be used based on the problem's context. Implementation details for tools such as R, Julia, Python, Mahout, and Spark will be covered in depth. Required technology primers and installation or setup-related guidance will be provided.
In this chapter, which forms the basis for the rest of the chapters of this book, we covered the basics of Machine learning and the landscape of Machine learning semantics. We started by defining Machine learning in simple terms and introduced Machine learning jargon or the commonly used terms.
There are many competing and complementing fields of Machine learning. We have thoroughly explained the similarities, dissimilarities, and the relationship of Machine learning with fields such as artificial intelligence, data mining, data science, and statistics. Overall, all these fields are very similar and have overlapping goals. In most cases, the practitioners of these fields were different. Even in terms of the tools being used, there were many common points.
We have also looked at some of the latest and best-of-breed tools that can be employed in Machine learning. Some of these tools will be demonstrated in the chapters using practical examples.
In the next chapter, we will cover a unique aspect of Machine learning that has pretty much changed the way Machine learning implementations have been looked at. We will explore how the big data, or large dataset, aspect of Machine learning has impacted the choice of tools and implementation approaches.