


 Download code from GitHub
Configuring Power BI Development Tools
In this chapter, we will cover the following recipes:
- Configuring Power BI Desktop options and settings
- Installing the On-Premises Data Gateway
- Installing Power BI Publisher for Excel
- Installing and configuring DAX Studio
Introduction
Power BI is a suite of business analytics tools and services that work together to access data sources, shape, analyze and visualize data, and share insights. Although not all tools are required for all projects or deployments of Power BI, synergies are available by utilizing the unique features of multiple tools as part of integrated solutions encompassing diverse data sources and visualization types.
In this chapter, we walk through the installation and configuration of the primary tools and services BI professionals utilize to design and develop Power BI content including Power BI Desktop, the On-Premises Data Gateway, DAX Studio, and the Power BI Publisher for Excel. Additionally, as Power BI tools and services are regularly updated with new features and enhancements, resources are identified to stay up-to-date and to best take advantage of these tools for your projects.
It's assumed that the reader has access to a Power BI Pro license, rights to download and install (or allow installation) the development tools on their machine, and has the necessary access and rights to deploy and manage content in the Power BI Service and utilize the Power BI mobile applications. Power BI licensing options and assigning and managing these rights is outside the scope of this book.
Configuring Power BI Desktop options and settings
Power BI Desktop is the primary tool used to develop the visual and analytical content which can then be deployed and collaborated on in the Power BI Service and optionally embedded in other applications and portals or even shared on the public internet. Although Power BI Desktop runs as a single application, it includes three tightly integrated components with their own options and settings:
- The Get Data and Query Editor experience, with its underlying M language and data mashup engine
- The SQL Server Analysis Services (SSAS) tabular data modeling engine and its DAX analytical language
- The interactive reporting and visualization engine formerly known as Power View
Configuring and leveraging these capabilities, in addition to advanced analytics and customization features such as R, mobile layout, and natural language queries, makes it possible to build robust and elegant BI and analytics solutions.
Getting ready
Most organizations set policies restricting downloads of software from the internet and many choose to centrally distribute a specific version of Power BI Desktop. For example, the March 2017 version of Power BI Desktop would be available on a corporate IT portal and it would be the approved version for 1-2 months while the April 2017 version is internally evaluated. Additionally, BI organizations may define policies restricting the use of native queries, custom visualizations, and establishing source privacy level settings.
How to do it...
Power BI Desktop is a relatively large download at 110 MB but can be installed simply and provides an intuitive Options and Settings interface for configuration.
Installing and running Power BI Desktop
- Download the Power BI Desktop installer package. The Windows installer package (.msi) can be downloaded from the Power BI Service or from the Power BI downloads page (https://powerbi.microsoft.com/en-us/downloads/).
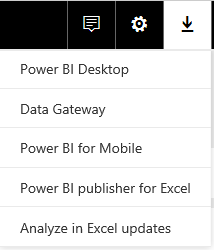
The Download dropdown, along with Settings and Notifications, is available in the upper-right corner of the Power BI Service window. The On-Premises Data Gateway and Power BI Publisher for Excel described later this chapter are also available for download.

The web service will determine whether the 64-bit (x64) or 32-bit version of Power BI Desktop is appropriate for your machine's operating system. If Power BI Desktop has already been installed on your machine and notifications of new versions are enabled, you will have the option to initiate the download of the latest Power BI Desktop version when it's available. Notifications of new versions are enabled by default and available under Global Options | Updates.
- Install Power BI Desktop. Launch the installation wizard from the .msi package and complete the installation after accepting the license agreement and choosing the file directory.

Configuring Power BI Desktop options
Developers of Power BI content should become familiar with the settings available in Power BI options and data source settings as these configurations determine available functionality, user interface options, default behaviors, performance, and the security of the data being accessed.
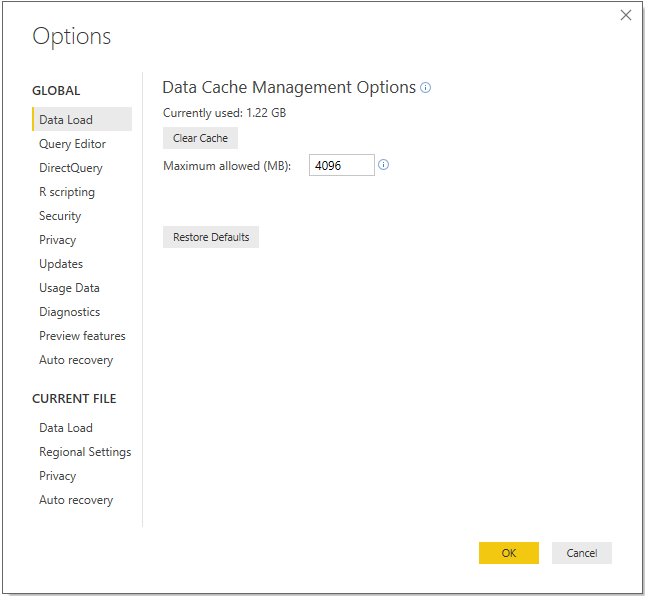
GLOBAL options are applied to all Power BI Desktop files created or accessed by the user, while CURRENT FILE options must be defined for each Power BI Desktop file. The following steps are recommended for GLOBAL options.
- On the Data Load tab, confirm that the currently used data cache is below the Maximum allowed (MB) setting. If it is near the limit and local disk space is available, increase the value of the Maximum allowed (MB). Do not clear the cache unless local disk space is unavailable as this will require additional, often unnecessary, queries to be executed at design time.

- On the Query Editor tab, display both the query settings pane and the formula bar. This will allow for greater visibility to the structure and specific M functions utilized by individual queries.

- On the DirectQuery tab, enable the Allow unrestricted measures in DirectQuery mode setting.

- On the Security tab, select the option to require user approval for new native database queries. Native queries are the user-specified SQL statements passed to data sources as opposed to the queries Power BI generates internally.

- Optionally, set Show security warning when adding a custom visual to a report as well.
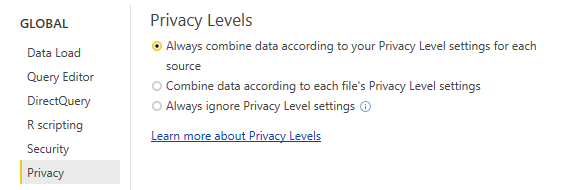
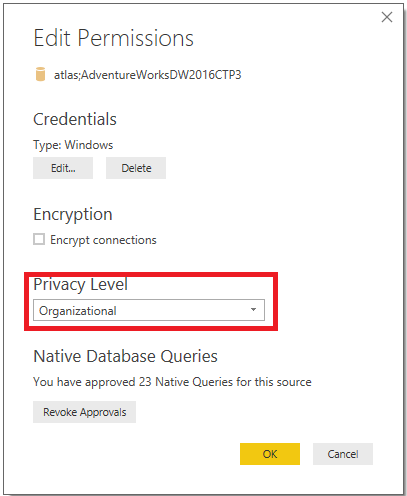
- On the privacy tab, configure the privacy levels for all data sources and enable the option to Always combine data according to your Privacy Level settings for each source. See How it Works... for details on these settings.
- From the Data Source settings, select an individual source and choose Edit Permissions to configure the privacy level:
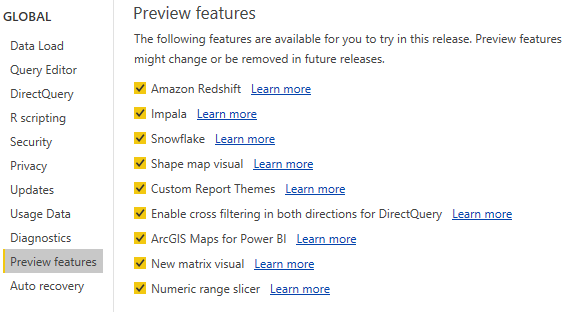
- Enable Preview features for evaluation purposes:
- On the Data Load tab for the CURRENT FILE, disable the automatic detection of column types and relationships. These model design decisions should be implemented explicitly by the Power BI developer with knowledge of the source data.
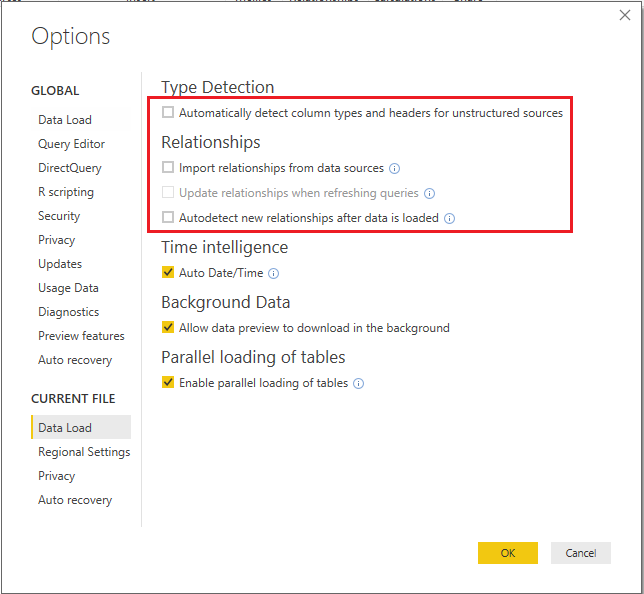
- As the current file options, it's necessary to apply these settings with each Power BI Desktop file to avoid default behaviors.
How it works...
Defining data source privacy levels such as Organizational or Private prevents the data from these sources being exposed to external or inappropriate data sources during data retrieval processes. For example, if a query calls for merging a Private data source with a Public data source, the join operation will be executed locally--the private data will not be sent to the public source. In the absence of Privacy Level settings set for data sources, the M query engine will look to optimize for performance by utilizing source system resources.
The options under Preview features change with new versions as some previous options become generally available and new preview features are introduced. The monthly Power BI Desktop update video and blog post provides details and examples of these new features. Usually a restart of the Power BI Desktop application is required once a new preview option has been activated, and tooltips and dialogs in Power BI Desktop will advise you if a preview feature is being used.
The enable tracing option in the Diagnostic Options section writes out detailed trace event data to the local hard drive and thus should only be activated for complex troubleshooting scenarios.

There's more...
As a modern cloud and service-oriented analytics platform, Power BI delivers new and improved features across its toolset on a monthly cadence. These scheduled releases and updates for Power BI Desktop, the Power BI Service, the On-Premises Data Gateway, Power BI mobile applications, and more reflect customer feedback, industry trends, and the Power BI team's internal ideas and product roadmap.
BI professionals responsible for developing and managing Power BI content can both stay informed of these updates as well as review detailed documentation and guidance on implementing the features via the Microsoft Power BI Blog (http://bit.ly/20bcQb4), Power BI Documentation (http://bit.ly/2o22qi4), and the Power BI Community (http://bit.ly/2mqiuxP).

The Power BI Community portal provides a robust, searchable hub of information across common topics as well as an active, moderated forum of user experiences and troubleshooting. The community also maintains its own blog featuring examples and use cases from top community contributors, and links to local Power BI User Groups (PUGs) and relevant events such as Microsoft Data Insights Summit.
See also
Power BI's advantages over Excel
Although Power BI Desktop and Excel 2016 both contain the same data transformation and modeling BI engines (M and DAX, respectively), features exclusive to Power BI Desktop and the features in the Power BI Service exclusive to datasets created from Power BI Desktop create an incentive to migrate existing Excel data models and queries to Power BI Desktop. At the time of writing, those top incremental features and benefits are the following:
| Row-level security roles | Custom third-party Visuals |
| DirectQuery Data models | Data-Driven Alerts |
| Max Size of 1 GB per dataset* | Quick Insights |
| Interactive reports* | Interactive Mobile Reports |
| Bidirectional relationships | Mobile report layouts |
| Natural language queries | Advanced analytics with R |
| Power BI report templates | Custom Report Themes |
Power BI Security and Data Source Privacy
The documentation and the official Power BI Security white paper are available here: http://bit.ly/22NHzRS and detailed documentation on data source privacy levels is available here: http://bit.ly/2nC0Lmx
Installing the On-Premises Data Gateway
The On-Premises Data Gateway, originally referred to as the Power BI Enterprise Gateway, is a Windows service that runs in on-premises environments. The sole purpose of the gateway is to support secure (encrypted) and efficient data transfer between On-Premises data sources and MS Azure services such as Power BI, PowerApps, MS Flow, and Azure Logic Apps via an outbound connection to the Azure Service Bus. Once installed, a gateway can be used to schedule data refreshes of imported Power BI datasets and to support Power BI reports and dashboards built with DirectQuery Power BI datasets and those which use Live Connections to SSAS (SQL Server Analysis Services) databases.
A single On-Premises Data Gateway can support the refresh and query activity for multiple data sources, and permission to use the gateway can be shared with multiple users. Currently the gateway supports all common data sources via scheduled imports (including ODBC connections) and many of the most common sources via Live Connection and DirectQuery.
Getting ready
Hardware and network configuration
The hardware resources required by the gateway vary based on the type of connection (import versus live connection), the usage of the reports and dashboards in the Power BI service, and the proportion of data volume handled by the gateway versus the on-premises source systems. It's recommended to start with eight-core CPUs with an 8 GB of RAM server. This machine cannot be a domain controller, and to maintain availability of Power BI content, the gateway server should be always on and connected to the internet.
Based on an analysis of current and projected workloads, the gateway resources can be scaled up or down and optionally additional gateways can be installed on separate servers to distribute the overall Power BI refresh and query deployment workload. For example, one gateway server can be dedicated to scheduled refresh/import workloads, thus isolating this activity from a separate gateway server responsible for DirectQuery and Live Connection queries.
The gateway does not require inbound ports to be opened and defaults to the outbound port of TCP 443, 5671, 5672 and 9350 through 9354. The gateway can be forced to use HTTPS communication exclusively and avoid the use of IP addresses via both the UI and the configuration files directly but this may impair performance. For the default communication mode, it's recommended to whitelist the IP addresses in your data region in your firewall. This list is updated weekly and is available via the Microsoft Azure Datacenter IP list (http://bit.ly/2oeAQyd).
How to do it...
Installation of on-premises gateway
- Download the latest Microsoft On-Premises Data Gateway (http://bit.ly/2nNNveZ).
- Save and run the install application on the machine to use as the gateway server.
- Choose the On-premises data gateway (recommended).

- Choose the file directory for the installation and accept the terms of use and privacy agreement.
- Sign in to the Power BI Service to register the gateway:

- Enter a user-friendly name for the gateway and a recovery key. Click on Configure.

How it works...
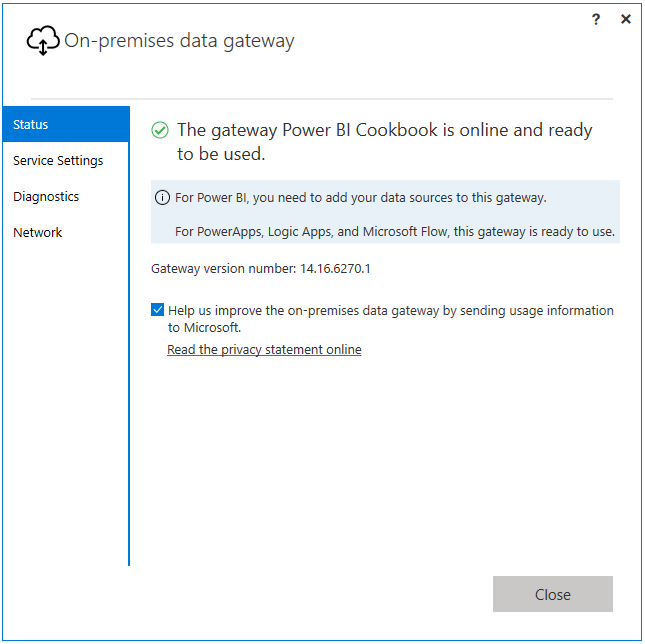
- As new versions of the gateway are available, a notification is made available in the Status tab of the On-Premises Data Gateway UI as per Figure 1. The Power BI Gateway team recommends that updates should be installed as they become available.
- The On-Premises Data Gateway, rather than the personal gateway, is required for the DirectQuery datasets created in this book and the use of other Azure services in the Microsoft Business Application Platform.
- The Power BI service uses read-only connections to on-premises sources but the other services (for example, PowerApps) can use the gateway to write, update, and delete these sources.
Gateway recovery key
The recovery key is used to generate a symmetric and asymmetric key which encrypts data source credentials and stores them in the cloud. The credentials area is only decrypted by the gateway machine in response to a refresh or query request. The recovery key will be needed in the following three scenarios:
- Migrating a gateway and its configured data sources to a different machine
- Restoring a gateway to run the service under a different domain account or restoring a gateway from a machine that has crashed
- Taking over ownership of an existing gateway from an existing gateway administrator
It's important that the recovery key is stored in a secure location accessible to the BI/IT organization. Additionally, more than one user should be assigned as a gateway administrator in the Power BI service.
There's more...
The Power BI Ideas Forum (http://bit.ly/2n5bFPd) is a valuable source for identifying requested features and enhancements and their status relative to future releases. For example, filtering on the Idea status of 'Started' implies that the feature has already been reviewed and planned and, with development activity taking place, will likely be released, at least in an initial or preview form, relatively soon. Filtering on Planned ideas, particularly those with higher community vote counts, provides a sense of impactful updates to be released over a longer time horizon.

See also...
- Details of configuring and managing data sources through the On-Premises Gateway are covered in Chapter 12, Deploying and Distributing Power BI Content.
- Guidance on analyzing performance monitor counters associated with gateway activity is included in Chapter 10, Developing Solutions for System Monitoring and Administration.
Installing Power BI Publisher for Excel
Excel-based data analysis and reporting artifacts such as pivot tables, charts, and cell range formula expressions with custom formatting remain pervasive in organizations. Although a significant portion of this content and its supporting processes can be migrated to Power BI, and despite the many additional features and benefits this migration could provide, Power BI is not intended as a replacement for all Excel reporting or SQL Server Reporting Services (SSRS) reporting. Organizations and particularly departments which use Excel extensively, such as Finance and Accounting, may prefer to leverage these existing assets and quickly derive value from Power BI by both deploying Excel content to Power BI and analyzing Power BI-hosted data from within Excel.
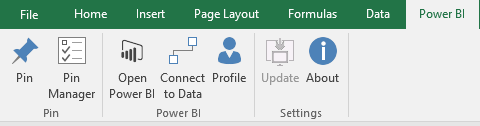
The Microsoft Power BI Publisher for Excel supplements Excel's native Power BI publishing features of uploading Excel workbooks to the Power BI Service or exporting Excel workbook data to Power BI datasets, as individual Excel objects can be "pinned" to Power BI dashboards and managed from the local Excel file.
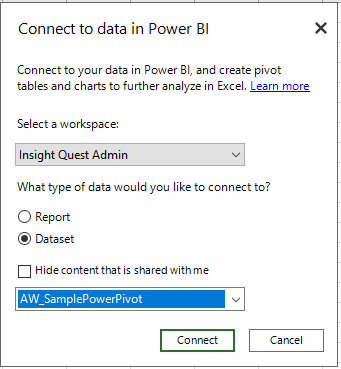
Additionally, the Power BI Publisher's data source providers support Excel-to-Power BI connection strings reflecting the local user's rights to the given Power BI hosted source.
How to do it...
Installation of Power BI Publisher for Excel
- Download the Power BI Publisher (http://bit.ly/2nCsWC0).
- Choose the version appropriate for the version of Microsoft Office installed: 32-bit or 64-bit.

- Install the publisher.
- Accept the license agreement and choose the file directory.
The drivers required to connect to Power BI hosted sources from Excel, such as the Excel OLE DB driver for Analysis Services, are automatically updated with each release. Additionally, once Power BI Publisher is installed, it's not necessary to use the Analyze in Excel option from the Power BI Service, which downloads an ODC file referencing the given model. The necessary connection to Power BI is created when the data source is selected via the Publisher dialog.
- Access the Power BI Publisher from Excel. Upon opening Excel following successful installation, you should get a message box advising of Power BI Publisher for Excel. It can be deactivated and the Power BI tab in the Excel ribbon should be visible. If it is not visible, you can check out the COM Add-ins dialog in Excel.
- Click on File and then Options in Excel to bring up the Excel Options menu
- Select Add-Ins and use the drop-down menu at the bottom to choose COM Add-ins
- Click on Go… to launch the following COM Add-ins window

- Use the Profile icon to sign into the Power BI Service. Sign in will be automatic with future instances of Excel.

There's more...
The following is a list of 11 blogs that contain many articles and examples on Power BI's tools and features:
|
Blogger(s) |
Blog |
URL |
|
Michael Carlo |
Power BI Tips and Tricks |
|
|
Chris Webb |
Crossjoin |
|
|
Rob Collie |
PowerPivotPro |
|
|
Alberto Ferrari |
SQL BI |
|
|
Kasper De Jonge |
Kasper On BI |
|
|
Matt Allington |
ExceleratorBI |
|
|
Ruth Martinez |
Curbal |
|
|
Dustin Ryan |
SQL Dusty |
|
|
Reza Rad |
RADACAD |
|
|
Imke Feldman |
The BIccountant |
|
|
Brett Powell |
Insight Quest |
|
|
Gilbert Quevauvilliers |
Fourmoo |
With the exception of Kasper On BI, all of these blogs are from non-Microsoft employees and thus do not necessarily reflect the views of MS or recommended practices with its products. Additionally, several of these blogs are not exclusive to Power BI; they may also include coverage of other MSBI, Azure, SQL Server, and Office 365 tools and services.
Installing and Configuring DAX Studio
DAX (Data Analysis Expressions) is the "language of Power BI" as it's used to create the measures and queries visualized in Power BI reports and dashboards. Power BI generates and submits DAX queries to the source data model based on the structure of the visualization, user selections, and filters, just as other tools such as Excel generate MDX queries based on the selections and structure of pivot tables and slicers from workbooks. DAX expressions are also used to define security roles and can optionally be used to create columns and tables in data models based on other tables and columns in the model, which can be refreshed at processing time and used by measures and queries. Given that DAX serves the same function in SQL Server Analysis Services (SSAS) Tabular models and Power Pivot for Excel models, it's essential that BI professionals have a robust tool for developing and analyzing DAX code and the data models containing these expressions.
DAX Studio is a third-party tool used to query data models, edit and format code, browse the structure and metadata of data models, and analyze the performance and execution characteristics of DAX queries. For larger and more complex data models and expressions, as well as projects involving multiple models, DAX Studio becomes an essential supplement to the development and performance tuning processes.
How to do it...
Installation of DAX Studio
- Download the latest version from CodePlex (https://daxstudio.codeplex.com/).
- Save the .exe application file to your local PC.
- A notification is displayed as new versions are available.

- Initiate the installation and setup Process.
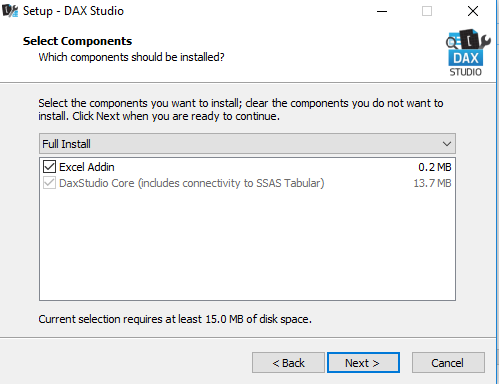
- Accept the license agreement and choose a folder path to install the tool.
- Choose whether the DAX Studio add-in for Excel will also be installed.
- The Add-In for Excel is required to connect to Power Pivot for Excel data models
- Additionally, when DAX Studio is opened from Excel, query results can be exported directly to Excel tables
- Upon full installation including the Add-in for Excel, a DAX Studio icon will appear on the Add-Ins Tab in the Excel Ribbon; the DAX Studio Add-in can be deactivated via the manage COM Add-ins dialog available from Excel--Options | Add-Ins tab.
|
Figure 29: DAX Studio Windows Application
|
Figure 30: The DAX Studio Add-in for Excel
|


The full installation with the Excel add-in is recommended as this enables direct output of DAX query results to Excel workbook tables and is required for connecting to Power Pivot data models.
Configuration of DAX Studio
- Open an Excel workbook.
- Open a Power BI Desktop file.
- From the Add-Ins tab of the toolbar, activate DAX Studio.

- Close the Excel workbook.
- Launch the DAX Studio standalone Windows application.
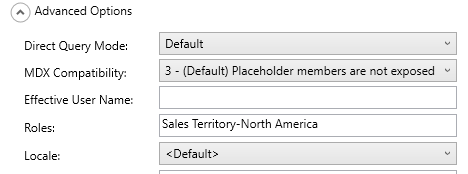
- Connect to a Power BI Desktop file or SSAS Tabular instance.
The Advanced Options settings of the Connect dialog establishes a connection in the context of the Sales Territory-North America security role defined in the model.
- Enable the DirectQuery Trace setting from the Options menu (File | Options).
- This provides visibility to the SQL queries passed from DirectQuery models.

How it works...
- The standalone application provides the same functionality as the Excel add-in, excluding connectivity to Power Pivot for Excel data models and Excel output options
- Powerful configuration options include the ability to specify a security role, effective user name identity, and Locale when defining connections to data models and when analyzing trace events associated with DirectQuery data models (that is, the SQL statements generated and passed to sources)
- With DirectQuery Trace enabled, a connection to a DirectQuery model will expose the SQL statements passed to the source system in the Server Timings window

There's more...
Guy in a Cube video channel
An additional resource for learning and deploying Power BI is Adam Saxton's Guy in a Cube video channel (http://bit.ly/2o2lRqU). These videos, currently released every Tuesday and Thursday, feature concise, hands-on reviews and resolutions to common issues and scenarios. They also have high-level summaries of recent Power BI updates and releases. As a member of the MSBI content team, Adam can incorporate specific guidance from Microsoft product and technical teams, and regularly identifies recent blog posts from the wider Power BI community.