


 Download code from GitHub
Planning Power BI Projects
Power BI is a robust, flexible business intelligence platform enabling organizations to deploy data analysis and reporting solutions according to their individual policies and use cases. Organizations can utilize Power BI to enable self-service data analytics and visualization for business analysts, as well as deploying enterprise-grade solutions involving technical expertise and advanced security and scalability features. Likewise, Power BI fully supports both cloud and on-premises data sources as well as all primary types of reports, ranging from interactive visualizations to pixel-perfect paginated reports to Excel-based reports.
While specific organizational goals, the data landscape, and specific resource responsibilities can vary greatly, the underlying concepts, deployment choices, roles, and planning processes for business intelligence projects remain the same. The long-term success or failure of most Power BI projects is most highly correlated to the planning, organization, and effective collaboration of the different stakeholders. Solutions that deliver the most value to the business over time are the result of thoughtful decisions around the people and processes involved in data governance, data quality, data modeling, and finally data visualization and distribution.
This chapter explores the various project planning decision topics, roles, and processes critical to the success of all Power BI projects.
In this chapter, we review the following topics:
- Power BI deployment modes
- Project discovery and ingestion
- Power BI project roles
- Power BI licenses
- Dataset design
- Data profiling
- Dataset planning
To begin, we first explore the different deployment modes for Power BI.
Power BI deployment modes
Prior to the existence and adoption of BI tools capable of supporting self-service scenarios, business analysts were effectively relegated to the role of “end user” of solutions developed and maintained from end to end by their information technology department. While this top-down approach helped ensure that the solution would be secure, accurate, and resource-efficient, it was also relatively slow and inflexible to adjust to changing requirements.
As a consequence, business analysts commonly utilized the IT-owned solutions as merely a starting point or data source to their own MS Office-based solutions that business analysts could maintain. The perceived lack of flexibility and extended timelines sometimes associated with IT-owned solutions often frustrated business teams, resulting in a lack of adoption and “shadow IT” scenarios in which business users created their own solutions via Excel and other tools.
Modern business intelligence platforms such as Power BI provide increased opportunities for the business to participate in the creation and deployment of data assets for the organization. Organizations can deliver Power BI solutions that require the resources and technical expertise of a Corporate BI approach, as well as empowering business teams to leverage the self-service capabilities of the platform. This “self-service” can range widely from enabling teams to access and analyze certain certified Power BI datasets to empowering business analysts to create their own end-to-end solutions including their own data transformation workflows and semantic models.
In many scenarios, a combination of corporate IT resources, such as the on-premises data gateway and Power BI Premium capacity, can be combined with the business users’ knowledge of requirements and familiarity with data analysis and visualization in order to increase the velocity of data asset development. More experienced organizations may even utilize multiple deployment modes depending on the distinct requirements and use cases for Power BI across different teams and projects.
For example, solutions involving highly sensitive data or targeted at executive leadership are generally owned from end to end by Corporate BI/IT personnel. However, in scenarios involving rapidly changing requirements where deep business knowledge is essential, business analysts familiar with the data are often empowered with sufficient Power BI licenses and resources to develop their own datasets and reports.
We refer to standard deployment mode as Corporate BI, a deployment mode where the IT department controls all aspects of the business intelligence platform. Alternative approaches are called self-service, where the business controls some or all aspects of the business intelligence platform.
Self-service approaches can benefit both IT and business teams, as self-service can reduce IT resource constraints and project timelines, and provide the business with greater flexibility and control as analytical needs change. Additionally, Power BI projects can be migrated across deployment modes over time as required skills and resources change. However, greater levels of self-service and shared ownership structures generally increase the risk of miscommunication and introduce issues of version control, quality, and consistency.
These deployment modes are summarized in Figure 1.1:

Figure 1.1: Power BI deployment modes
A Power BI dataset is a semantic data model primarily comprised of data source queries, relationships between fact and dimension tables, and measure calculations. A semantic data model adds meaning to the physical, underlying data by adding relationships between data entities, allowing organizations to extract truth and understanding from their data.
Datasets often contain hierarchies, row-level security roles, and often other metadata such as calculation groups, detailed row expressions, and other metadata that supports usability and analysis. Power BI datasets share the heritage and concepts of Analysis Services tabular mode models and are generally developed using Power BI Desktop, a Windows application.
Microsoft has now positioned Power BI Premium-hosted datasets as their flagship semantic modeling tool and a “superset” of Analysis Services models. As the “superset” term implies, Power BI Premium-hosted datasets now support all of the enterprise-grade modeling features of Analysis Services and there are a number of powerful modeling features, such as composite models and incremental refresh policies, that are only available via Power BI datasets. Chapter 15, Building Enterprise BI with Power BI Premium, covers Power BI Premium in more detail.
Now that deployment modes are understood at a high level, let’s take a look at each of the three deployment modes in greater detail.
Corporate BI
The Corporate BI delivery approach in which the BI team develops and maintains both the Power BI dataset (sometimes called a data model) and the required report visualizations is a common deployment option, particularly for large-scale projects and projects with executive-level sponsors or stakeholders. This is the approach followed in this chapter and throughout this book, as it offers maximum control over top BI objectives, such as version control, scalability, usability, and performance.
Corporate BI can be visualized as shown in Figure 1.2:

Figure 1.2: Corporate BI
As shown in Figure 1.2, all data and Power BI assets are owned by corporate IT and business users simply consume reports and dashboards published by corporate IT to the Power BI service.
Again, with the Corporate BI approach, business users are solely consumers of corporate business intelligence assets. Next, we compare this approach with self-service approaches where business users are more engaged with the creation and deployment of business intelligence assets.
Self-Service Visualization
In the Self-Service Visualization approach, the dataset is created and maintained by the IT organization’s BI team, but certain business users with Power BI Pro licenses create reports and dashboards for consumption by other users. In many scenarios, business analysts are already comfortable with authoring reports in Power BI Desktop (or, optionally, Excel) and can leverage their business knowledge to rapidly develop useful visualizations and insights.
With ownership of the dataset, the BI team can be confident that only curated data sources and standard metric definitions are used in reports and can ensure that the dataset remains available, performant, and updated or refreshed as per business requirements.
Self-Service Visualization is shown in Figure 1.3:

Figure 1.3: Self-Service Visualization
As shown in Figure 1.3, dataset designers within corporate IT still create and manage the Power BI datasets but business users author and publish reports and dashboards to the Power BI service. In the next section, we explore the Self-Service BI approach driven entirely by the business.
Self-Service BI
In the Self-Service BI approach, the BI organization only contributes essential infrastructure and monitoring, such as the use of an on-premises data gateway and possibly Power BI Premium capacity to support the solution. Since the business team maintains control of both the datasets and the visualization layer, the business team has maximum flexibility to tailor its own solutions including data source retrieval, transformation, and modeling.
This flexibility, however, can be negated by a lack of technical coding skills and a lack of technical knowledge such as the relationships between tables in a database. Additionally, business-controlled datasets can introduce version conflicts with corporate semantic models and generally lack the resilience, performance, and scalability of IT-owned datasets. Self-Service BI can be visualized as shown in Figure 1.4:

Figure 1.4: Self-Service Visualization
As shown in Figure 1.4, with a completely self-service approach to business intelligence with Power BI, the business, and not IT, performs all of the functions of dataset design and report authoring. Now that the three different deployment modes are understood in greater detail, next we cover choosing between them.
Choosing a deployment mode
Organizations generally choose a standard deployment mode used throughout the business or choose a particular deployment mode based upon the unique requirements and goals of each individual Power BI project.
It’s usually necessary or at least beneficial for Corporate BI organizations to own the Power BI datasets or at least the datasets that support important, widely distributed reports and dashboards. This is primarily due to the value of providing a single source of truth built on top of a curated data source such as a data warehouse as well as the technical skills involved in developing and managing large or complex datasets.
Additionally, BI organizations require control of datasets to implement security and to maintain version control. Security and version control often factor into corporate governance policies or are necessary to maintain compliance with regulations imposed by government agencies. Therefore, small datasets initially created by business teams are often migrated to the BI team and either integrated into larger models or rationalized given the equivalent functionality from an existing dataset.
Larger organizations with experience in deploying and managing Power BI often utilize a mix of deployment modes depending on the needs of the project and available resources. For example, a Corporate BI solution with a set of standard IT-developed reports and dashboards distributed via a Power BI app may be extended by assigning Power BI Pro licenses to certain business users who have experience or training in Power BI report design. These users could then leverage the existing data model and business definitions maintained by IT to create new reports and dashboards and distribute this content in a separate Power BI workspace and/or app.
A workspace is simply a container of datasets, reports, and dashboards in the Power BI cloud service that can be distributed to large groups of users. A Power BI app represents the published version of a workspace in the Power BI service and workspace. Members can choose which items in the workspace are included in the published Power BI app. See Chapter 10, Managing Application Workspaces and Content, and Chapter 13, Creating Apps and Content Distribution, for greater detail on app workspaces and apps, respectively.
Another common scenario is a Proof of Concept (POC). A POC is a small-scale self-service solution developed by a business user or a team designed to be transitioned to a formal, IT-owned, and managed solution. Power BI Desktop’s rich graphical interfaces at each layer of the application (query editor, data model, and report canvas) make it possible and often easy for users to create useful models and reports with minimal experience and little to no code.
It’s much more difficult, of course, to deliver consistent insights across business functions (that is, finance, sales, and marketing) and at scale in a secure, governed environment. The IT organization can enhance the quality and analytical value of these assets, as well as providing robust governance and administrative controls to ensure that the right data is being accessed by the right people.
The following list of fundamental questions help guide a deployment mode decision:
- Who will own the data model?
Experienced dataset designers and other IT professionals are usually required to support complex data transformations, analytical data modeling, large data sizes, and security rules, such as RLS roles, as described in Chapter 5, Developing DAX Measures and Security Roles.
If the required data model is relatively small and simple, or if the requirements are unclear, the business team may be best positioned to create at least the initial iterations of the model.
The data model could be created with Analysis Services or Power BI Desktop.
- Who will own the reports and dashboards?
Experienced Power BI report developers with an understanding of corporate standards and data visualization best practices can deliver a consistent user experience.
Business users can be trained on report design and development practices and are well positioned to manage the visualization layer, given their knowledge of business needs and questions.
- How will the Power BI content be managed and distributed?
A staged deployment across development, test, and production environments, as described in Chapter 8, Managing Application Workspaces and Content, helps to ensure that quality, validated content is published. This approach is generally exclusive to Corporate BI projects.
Sufficient Power BI Premium capacity is required to support distribution to Power BI free users and either large datasets or demanding query workloads.
Self-Service BI content can be assigned to Premium capacity, but organizations may wish to limit the scale or scope of these projects to ensure that provisioned capacity is being used efficiently.
As covered in this section, deployment modes represent the overall manner in which Power BI is used within an organization. Now that the different deployment modes for Power BI are fully understood, we next move on to covering the processes and roles for implementing individual Power BI projects.
Project discovery and ingestion
An organization’s business intelligence assets are the result of individual projects designed to accomplish a specific set of goals or answer a specific set of business questions. Thus, the successful initiation and execution of business intelligence projects is vital to all organizations.
Power BI projects often begin with answering a set of standard questions within a project template form. Business guidance on these questions informs the BI team of the high-level technical needs of the project and helps to promote a productive project kickoff. By reviewing the project template, the BI team can ask the project sponsor or relevant Subject Matter Experts (SMEs) targeted questions to better understand the current state and the goals of the project.
A sample Power BI project template is provided in the following section.
Sample Power BI project template
The primary focus of the project planning template and the overall project planning stage is on the data sources and the scale and structure of the Power BI dataset required. The project sponsor or business users may only have an idea of several reports, dashboards, or metrics needed but, as a Corporate BI project, it’s essential to focus on where the project fits within an overall BI architecture and the long-term Return on Investment (ROI) of the solution. For example, BI teams would look to leverage any existing Power BI datasets or Analysis Services tabular models applicable to the project and would be sensitive to version control issues.
The following section provides a completed template for a Power BI project.
Sample template – Adventure Works BI
The template is comprised of two tables. The first table, Table 1.1, answers the essential who and when questions so that the project can be added to the BI team’s backlog. The BI team can use this information to plan their engagements across multiple ongoing and requested Power BI projects and to respond to project stakeholders, such as Vickie Jacobs, VP of Group Sales, in this example:
|
Date of Submission |
6/6/2022 |
|
Project Sponsor |
Vickie Jacobs, VP of Group Sales |
|
Primary Stakeholders |
Adventure Works Sales Adventure Works Corp |
|
Power BI Author(s) |
Mark Langford, Sales Analytics Manager |
Identifying stakeholders is critical to the success of business intelligence projects. Stakeholders define the goals and requirements of the business intelligence project and ultimately determine success or failure in meeting identified goals. There are often multiple stakeholders for business intelligence projects and these stakeholders may even span multiple business domains. Start by identifying the business domains as stakeholders for the business intelligence project and then identify specific individuals within those domains who can provide the goals and requirements for the project.
It is always advantageous to identify a single individual as a special kind of stakeholder, a project sponsor. Project sponsors secure the funding and assist in the prioritization of resources for business intelligence projects.
The following table, Table 1.2, is a list of questions that describe the project’s requirements and scope. It is critical to discover and answer as many of these questions as possible early on in a business intelligence project in order to set expectations in terms of the cost and duration of the project. For example, the number of users who are read-only consumers of Power BI reports and dashboards and the number of self-service users who need Power BI Pro licenses to create Power BI content largely impact the total cost of the project. Likewise, the amount of historical data to include in the dataset (2 years, 5 years?) can significantly impact performance scalability:
|
Topic |
# |
Question |
Business Input |
|
Data sources |
1 |
Can you describe the required data? (For example, sales, inventory, shipping) |
Internet Sales, Reseller Sales, and the Sales and Margin Plan. We need to analyze total corporate sales, online and reseller sales, and compare these results to our plan. |
|
Data sources |
2 |
Is all of the data required for your project available in the data warehouse (SQL Server)? |
No. |
|
Data sources |
3 |
What other data sources (if any) contain all or part of the required data (for example, Web, Oracle, Excel)? |
The Sales and Margin Plan is maintained in Excel. |
|
Security |
4 |
Should certain users be prevented from viewing some or all of the data? |
Yes, sales managers and associates should only see data for their sales territory group. VPs of sales, however, should have global access. |
|
Security |
5 |
Does the data contain any PCII, HIPAA, GDPR, or other sensitive data? |
No, not that I’m aware of. |
|
Scale |
6 |
Approximately, how many years of historical data are needed? |
3-4. |
|
Scale |
7 |
Is it necessary to track the history of certain dimensions such as customers or products? For example, if a customer’s address changes, is it necessary to store and report on both the prior address and the new address? |
Yes, it would be helpful to track product history. |
|
Data refresh |
8 |
How often does the data need to be refreshed? |
Daily. |
|
Data refresh |
9 |
Is there a need to view data in real time (as it changes)? |
No. |
|
Distribution |
10 |
Approximately, how many users will need to view reports and dashboards? |
200. |
|
Distribution |
11 |
Approximately, how many users will need to create reports and dashboards? |
3-4. |
|
Distribution |
12 |
Will the users be viewing the reports and dashboards on mobile devices such as phones or tablets? |
Yes, users need the ability to access the information on their phones. |
|
Version control |
13 |
Are there existing reports on the same data? If so, please describe. |
Yes, there are daily and weekly sales snapshot reports available on the portal. Additionally, our team builds reports in Excel that compare actuals to the plan. |
|
Version Control |
14 |
Is the Power BI solution expected to replace these existing reports? |
Yes, we would like to exclusively use Power BI going forward. |
|
Version Control |
15 |
Is there an existing Power BI dataset that targets the same business processes (fact tables)? |
Not to our knowledge. |
A business analyst inside the IT organization often partners with the business on completing the project ingestion template and reviews the current state in order to give greater context to the template. Prior to the project kickoff meeting, the business analyst usually meets with the BI team members to review the template and any additional findings or considerations.
Many questions with greater levels of detail are required as the project moves forward and therefore the template shouldn’t attempt to be comprehensive or overwhelm business teams. The specific questions to include should use business-friendly language and serve to call out the top drivers of project resources and Corporate BI priorities, such as security and version control.
Now that you understand the process and requirements that drive project discovery and ingestion, we next cover the different roles involved in Power BI projects.
Power BI project roles
Following the review of the project template and input from the business analyst, members of the Power BI team directly engage the project sponsor and other key stakeholders to officially engage in the project. These stakeholders include SMEs on the data source systems, business team members knowledgeable about the current state of reporting and analytics, and administrative or governance personnel with knowledge of organizational policies, available licenses, and current usage.
New Power BI projects of any significant scale and long-term adoption of Power BI within organizations require Dataset Designers, Report Authors, and Power BI Admin(s), as illustrated in the following diagram:

Figure 1.5: Power BI team roles
Each of the three Power BI project roles and perhaps longer-term roles as part of a business intelligence team entail a distinct set of skills and responsibilities. It can be advantageous in a short-term or POC scenario for a single user to serve as both a dataset designer and a report author. However, the Power BI platform and the multi-faceted nature of Corporate BI deployments are too broad and dynamic for a single BI professional to adequately fulfill both roles.
It’s recommended that team members either self-select or are assigned distinct roles based on their existing skills and experience and that each member develops advanced and current knowledge relevant to their role. For example, individuals with a user experience and user interface (UX/UI) background are generally best suited to fulfill the Report Author role. Conversely, more technical developers with a background in coding and data modeling often fulfill the Dataset Designer role. A BI manager and/or a project manager can help facilitate effective communication across roles and between the BI team and other stakeholders, such as project sponsors.
Let’s now take a closer look at each of the three roles involved in Power BI projects.
Dataset designer
The dataset designer is responsible for the data access layer of the Power BI dataset, including the authentication to data sources and the M queries used to define the tables of the data model. Additionally, the dataset designer defines the relationships of the model and any required row-level security roles and develops the DAX measure expressions for use in reports, such as year-to-date (YTD) sales.
A Power BI dataset designer often has experience in developing Analysis Services models, particularly Analysis Services models in tabular mode, as this aligns with the semantic modeling engine used in Power BI. For organizations utilizing both Analysis Services and Power BI Desktop, this could be the same individual. Alternatively, business analysts experienced with Power Pivot for Excel or with the modeling features of Power BI Desktop may also prove to have the skills required of Power BI dataset designers for self-service scenarios.
Datasets (semantic models) have always been the heart of Power BI solutions as they serve as the data source responsible for rapidly resolving the report queries generated by reports and analysis sessions. Power BI datasets can be designed to import copies of data from multiple data sources into a compressed, in-memory cache, as well as merely passing report queries back to a data source system such as Azure Synapse Analytics. Additionally, Power BI dataset designers can mix both import (in-memory) and DirectQuery storage modes across different tables of a dataset thus balancing the tradeoffs between the two storage modes.
In addition to providing a performant and scalable data source that efficiently utilizes resources (CPU, RAM), datasets must provide a user-friendly interface for report authors and analysts to quickly produce effective content. Moreover, datasets also typically contain Row-Level Security (RLS) roles that limit what certain users or groups of users can see and can also contain complex logic to support certain business rules or report requirements. Datasets are therefore a critical component of Power BI projects and their design has tremendous implications regarding user experience, query performance, source system and Power BI resource utilization, and more.
Given the importance of Power BI datasets and the implications of dataset design decisions for entire environments, many organizations choose to dedicate one or multiple developer roles to Power BI datasets. These individuals are expected to have advanced- to expert-level knowledge of Data Analysis eXpressions (DAX) as well as experience with enterprise features such as aggregation tables, partitions and incremental refresh, and other supporting third-party tools such as ALM Toolkit. All of these topics are explained in later chapters.
Business analysts or “power users” can often independently learn or receive essential training to build basic Power BI datasets that meet the needs of their department. However, business analysts can also struggle to learn coding languages like M and DAX and can fail to appreciate other goals of a dataset such as resource usage. For this reason, organizations are well advised to regularly monitor the datasets developed by business teams/analysts and consider adopting a process for migrating ownership of these datasets from a business team to a Corporate BI team.
It can’t be emphasized strongly enough that Power BI project teams should carefully distinguish between datasets and reports and maintain a goal of supporting many related reports and dashboards via high-quality, well-tested or certified datasets. This can be challenging as teams are generally tasked with developing reports regardless of the source dataset, thus creating a temptation to simply create a dataset dedicated to the needs of a single report. Over the long term this “report factory” approach results in both inefficient use of resources (CPU) as well as confusion and manageability issues with many datasets having slightly different logic and all needing to be maintained.
Dataset designers should regularly communicate with data source owners or SMEs, as well as report authors. For example, the dataset designer needs to be aware of changes to data sources so that data access queries can be revised accordingly, and report authors can advise of any additional measures or columns necessary to create new reports. Furthermore, the dataset designer should be aware of the performance and resource utilization of deployed datasets and should work with the Power BI admin on issues such as Power BI Premium capacity.
As per Figure 1.5, there are usually relatively few dataset designers in a team compared with the number of report authors. This is largely due to the organizational objectives of version control and reusability, which leads to a small number of large datasets. Additionally, robust dataset development requires knowledge of the M and DAX functional programming languages, dimensional modeling practices, and business intelligence. Database experience is also very helpful. If multiple dataset designers are on a team, they should look to standardize their development practices so that they can more easily learn and support each other’s solutions.
With the crucial role of the dataset designer understood, we next explore the report author role.
Report authors
Report authors interface directly with the consumers of reports and dashboards or a representative of this group. In a self-service deployment mode or a hybrid project (business and IT), a small number of report authors may themselves work within the business.
Above all else, report authors must have a clear understanding of the business questions to be answered and the measures and attributes (columns) needed to visually analyze and answer these questions. The report author should also be knowledgeable of visualization best practices, such as symmetry and minimalism, in addition to any corporate standards for report formatting and layout.
Power BI Desktop provides a rich set of formatting properties and analytical features, giving report authors granular control over the appearance and behavior of visualizations. Report authors should be very familiar with all standard capabilities, such as conditional formatting, drilldown, drillthrough, and cross-highlighting, as they often lead demonstrations or training sessions.
It’s important for report authors to understand the use cases and essential features of the two alternative report types available in Power BI – paginated reports and Excel reports. For example, given the requirements to export or print detail-level data, a report author should be comfortable in building a paginated report via the Power BI Report Builder. Additionally, report authors should understand the organization’s policies on custom visuals available in the MS Office store and the specific use cases for top or popular custom visuals.
It should be clear now that report authors have distinct responsibilities and skillsets compared to dataset designers. The ability to design intuitive reports and dashboards that are easily understood by the business is also of critical importance to the success of every Power BI project. Next, we look at the last critical role, the Power BI administrator.
Power BI administrator
As Power BI has grown its capabilities and become a mission-critical tool for organizations, the role of a Power BI administrator (admin) has become increasingly common. Power BI administrators are responsible for ensuring Power BI is utilized effectively and according to the organization’s policies. For example, Power BI administrators monitor and troubleshoot dataset refresh failures, performance issues, user access requests and issues, and the overall health of an organization’s Premium capacities.
A Power BI administrator is assigned the Power BI administrator role in Azure Active Directory, the identity and access control service at the heart of Microsoft’s cloud-based Software as a Service (SaaS) products. Assignment of the Power BI administrator role is done in the Microsoft 365 admin center and only Global administrators of Office 365 can assign users to the role.
Users assigned to the Power BI administrator role obtain access to the Power BI admin portal and the rights to configure Power BI tenant settings. The Power BI admin portal and tenant settings are used to enable or disable features, such as exporting data and printing reports and dashboards. BI and IT managers that oversee Power BI deployments are often assigned to this role, as the role also provides the ability to manage Power BI Premium capacities and access to standard monitoring and usage reporting.
The Power BI admin should have a clear understanding of the organizational policy on the various tenant settings, such as whether content can be shared with external users. For most tenant settings, the Power BI administrator can define rules in the Power BI admin portal to include or exclude specific security groups. For example, external sharing can be disabled for the entire organization except for a specific security group of users.
Power BI admins must also have a thorough knowledge of permissions, roles, sharing, and licensing of Power BI in order to resolve common issues related to access. For example, a Power BI admin would know that build permission to a dataset could be granted to a business analyst as a less permissive alternative to membership in the workspace of the source dataset.
Most organizations should assign two or more users to the Power BI administrator role and ensure these users are trained on the administration features specific to this role. Chapter 14, Administering Power BI for an Organization, contains details on the Power BI admin portal and other administrative topics.
While Power BI admins are not involved in the day-to-day activities of specific projects, the role is ultimately critical to the success of all projects, as is the overall collaboration between all project roles, which we cover in the next section.
Project role collaboration
Communicating and documenting project role assignments during the planning stage promotes the efficient use of time during the development and operations phases. For organizations committed to the Power BI platform and perhaps migrating away from a legacy or different BI platform, project roles may become full-time positions.
For example, BI developers with experience in DAX and Analysis Services tabular models may transition to permanent dataset designer roles while BI developers experienced in data visualization and report development may become report authors:
|
Name |
Project role |
|
Brett Powell |
Dataset Designer |
|
Jennifer Lawrence |
Report Author |
|
Anna Sanders |
Power BI Administrator |
|
Mark Langford |
Report Author |
|
Stacy Loeb |
QA Tester |
It is important for the individuals within all of the various roles to work together and communicate effectively in order to deliver a successful project outcome. Proper communication and collaboration are important to all projects but are perhaps even more crucial within the realm of business intelligence given the distinct nature of the roles involved and the criticality of accurate, effective reporting to the success of organizations.
With project roles and responsibilities now understood, we next cover the various forms of licensing for Power BI deployments.
Power BI licenses
Power BI provides a number of different licensing options that provide flexible and affordable pricing for individuals and organizations. These licensing options come in two primary categories:
- Shared capacity
- Dedicated capacity
Let us first have a look at shared capacity.
Shared capacity
Shared capacity is like an apartment building. While each tenant in the building has their own personal living quarters accessible to only themselves, certain infrastructures such as plumbing, electrical wiring, and stairways are common to everyone in the building. Shared capacity for Power BI is similar. Each tenant within the Power BI service has its own area for publishing data and reporting assets but infrastructure such as memory and processing capacity are shared among the tenants. Thus, just like a noisy neighbor in an apartment building can affect other tenants, so too can tenants within shared capacity in the Power BI service impact the performance for other tenants.
Two licensing options exist for using shared capacity within the Power BI service:
- Free
- Pro
In the next two sections, we look at the differences between free and Pro licensing.
Free
It is possible to use Power BI entirely for free. First, the Power BI Desktop application is always free to download and use. Licensing does not become a factor until one desires to use the Power BI service. However, there is a free version of the Power BI service license. The free license allows reports to be published to the Power BI service, however, there are significant limitations with this approach. Figure 1.6 provides an overview of using Power BI free licensing.

Figure 1.6: Power BI free
As shown in Figure 1.6, report authors can use Power BI Desktop to create datasets and reports and publish these assets to the Power BI service. However, datasets can only be refreshed from cloud sources and only from the user’s personal workspace, My Workspace. Refreshing on-premises data sources is not supported. In addition, sharing content with other internal and external users is only possible through the Publish to Web feature.
It is important to understand that the Publish to Web feature does not provide any kind of security or authentication. Anyone that has the link to the report that has been published using the Publish to Web feature can access the report anonymously. There are many other features that cannot be used in the Power BI service as well, such as subscriptions and comments.
Once the limitations are understood, solely using the free license for Power BI has only limited uses. Mainly, it is used for testing or performing a proof of concept. However, the free Power BI service license can be coupled with Power BI Premium to provide a powerful and affordable solution for enterprises.
Now that the free licensing model is understood, let’s compare it with the pro licensing model.
Pro
The Pro licensing option for Power BI removes the limitations of free licensing when using the Power BI service. Figure 1.7 presents an overview of Pro licensing.

Figure 1.7: Power BI Pro
As shown in Figure 1.7, Pro licensing allows users to share reports with both internal and external users. However, those users also require a Pro license in order to access and view the reports and datasets. Essentially, anyone that collaborates (views, creates, edits) datasets, reports, and dashboards must have a Pro license.
Using a Pro license removes all of the restrictions of the free licensing structure and users are able to utilize the standard features of the Power BI service including the ability to create subscriptions, comment, create and use apps, and leverage the Analyze in Excel feature, which exports a report’s underlying data to Excel in order to support further analysis.
Now that we have explored the free and Pro licensing options associated with shared capacity, we’ll next look at the licensing models available for dedicated capacity.
Dedicated capacity
In addition to shared capacity licenses, there are also dedicated capacity licenses available for Power BI. These licenses reserve memory and processing capacity solely for the use of a particular tenant. In addition, these licenses enable advanced features such as larger datasets, increased user quotas, more frequent dataset refreshes, paginated reports, goals, scorecards, pipelines, and embedding of content into corporate applications.
Three licensing options exist for using dedicated capacity within the Power BI service:
- Premium
- Premium Per User
- Embedded
We cover each of these licensing options in detail in the following sections.
Premium
With Power BI Premium, users with Power BI free licenses are able to access and view Power BI apps of reports and dashboards that have been assigned to Premium capacities. This access includes consuming the content via the Power BI mobile application as well as fully interacting with standard Power BI service features such as using subscriptions and comments. Additionally, Power BI Pro users can share dashboards with Power BI free users if the dashboard is contained in a Premium workspace. Power BI Pro licenses are required for users that create or distribute Power BI content, such as connecting to published datasets from Power BI Desktop or Excel. Figure 1.8 presents an overview of Premium licensing.

Figure 1.8: Power BI Premium
Power BI Premium is purchased in capacity units priced on a per-month basis. These capacity units are called node types and range in size from a P1 with 25 GB of RAM and eight virtual cores for $5,000/month to a P5 with 400 GB of RAM and 128 virtual cores for $80,000/month. It is important to understand that this is dedicated capacity and is charged on a per-month basis (not per minute or hour). Power BI Premium also includes a license for using Power BI Report Server on-premises.
An organization may choose to license Power BI Premium capacities for additional or separate reasons beyond the ability to distribute Power BI content to read-only users without incurring per-user license costs. Significantly, greater detail on Power BI Premium features and deployment considerations is included in Chapter 15, Building Enterprise BI with Power BI Premium.
With an entry price point for Power BI Premium of $5,000 per month, many mid-sized organizations were priced out of the ability to afford dedicated capacity. Thus, Microsoft recently introduced Premium Per User pricing, which we cover next.
Premium Per User
Premium Per User (PPU) licensing effectively works identically to Pro licensing except that all users of a PPU workspace must have a PPU license. An overview of PPU licensing is shown in Figure 1.9.

Figure 1.9: Power BI Premium Per User
As shown in Figure 1.9, PPU licensing works the same as Pro licensing except that PPU licensing adds the additional advanced features of Premium such as increased dataset sizes, increased refresh frequency, paginated reports, goals, scorecards, and pipelines.
Let’s now take a look at the last dedicated capacity licensing option, Embedded.
Embedded
Power BI Embedded is intended for use by developers and Independent Software Vendors (ISVs) that use APIs to embed Power BI visuals, reports, and dashboards within their custom web applications. These applications can then be accessed by external customers. Figure 1.10 provides an overview of Power BI Embedded.

Figure 1.10: Power BI Embedded
Similar to Power BI Premium, capacity units or node types for Embedded range in size from an A1 with 3 GB of RAM and a single virtual core for $750 per month to an A6 with 100 GB of RAM and 32 virtual cores for $24,000 per month. However, different than Premium, Embedded is charged on a usage basis per minute versus a flat charge per month. The usage-based charge is attractive to developers and ISVs as this provides greater flexibility and less expense, particularly during development, since the service can be deprovisioned when development is not occurring.
With the basic licenses for Power BI understood, let’s next consider how these different licenses are combined to provide a complete licensing scenario for an organization.
Power BI license scenarios
The optimal mix of Power BI Pro and Power BI Premium licensing in terms of total cost varies based on the volume of users and the composition of those users between read-only consumers of content versus Self-Service BI users. In relatively small deployments, such as 200 total users, a Power BI Pro license can be assigned to each user regardless of self-service usage and Power BI Premium capacity can be avoided.
However, there are other benefits to licensing Power BI Premium capacity that may be necessary for certain deployments, such as larger datasets or more frequent data refreshes.
If an organization consists of 700 total users with 600 read-only users and 100 self-service users (content creators), it’s more cost-effective to assign Power BI Pro licenses to the 100 self-service users and to provision Power BI Premium capacity to support the other 600 users. Likewise, for a larger organization with 5,000 total users and 4,000 self-service users, the most cost-effective licensing option is to assign Power Pro licenses to the 4,000 self-service users and to license Power BI Premium for the remaining 1,000 users.
Several factors drive the amount of Power BI Premium capacity to provision, such as the number of concurrent users, the complexity of the queries generated, and the number of Concurrent data refreshes. See Chapter 14, Administering Power BI for an Organization, and Chapter 15, Building Enterprise BI with Power BI Premium, for additional details on aligning Power BI licenses and resources with the needs of Power BI deployments.
In the sample project example introduced in the section Sample template – Adventure Works BI, Power BI Premium is being used. Therefore, only a few users need Power BI Pro licenses to create and share reports and dashboards.
Referencing Table 1.3, Mark Langford, a data analyst for the sales organization, requires a Pro license to analyze published datasets from Microsoft Excel. Jennifer Lawrence, a corporate BI developer and report author for this project, requires a Pro license to publish Power BI reports to app workspaces and distribute Power BI apps to users. Finally, Brett Powell as dataset designer also requires a Power BI Pro license to create and publish the underlying dataset.
Typically, a Power BI administrator is also assigned a Power BI Pro license. Per Table 1.3, Anna Sanders is the Power BI administrator. However, a Power BI Pro license is not required to be assigned to the Power BI administrator role.
The approximately 200 Adventure Works sales team users who only need to view the content can be assigned free licenses and consume the published content via Power BI apps associated with Power BI Premium capacity. Organizations can obtain more Power BI Pro licenses and Power BI Premium capacity (virtual cores, RAM) as usage and workloads increase.
We mentioned at the beginning of this chapter that Power BI is a robust, flexible business intelligence platform and the different licensing options and combinations are a reflection of that flexibility. In the following sections, we’ll next cover the tools, processes, and overall design of datasets.
Dataset design
Designing Power BI datasets is in many respects similar to designing data warehouses. Both datasets and data warehouses share concepts such as fact and dimension tables, star schemas, slowly changing dimensions, fact table granularity, and local and foreign keys for building relationships between tables.
This similarity allows us to use the same proven tools and processes for designing and building Power BI datasets as are used to design data warehouses. In this section, we cover the tools and processes used to design Power BI datasets, starting with the data warehouse bus matrix.
Data warehouse bus matrix
The data warehouse bus matrix is a staple of the Ralph Kimball data warehouse architecture, which provides an incremental and integrated approach to data warehouse design. This architecture, as per The Data Warehouse Toolkit (Third Edition) by Ralph Kimball, allows for scalable data models, as multiple business teams or functions often require access to the same business process data and dimensions.
To promote reusability and project communication, a data warehouse bus matrix of business processes and shared dimensions is recommended. An example data warehouse bus matrix is shown in Figure 1.11:

Figure 1.11: Data warehouse bus matrix
Each row in Figure 1.11 reflects an important and recurring business process, such as the monthly close of the general ledger, and each column represents a business entity, which may relate to one or several of the business processes. The shaded rows (Internet Sales, Reseller Sales, and Sales Plan) identify the business processes that will be implemented as their own star schemas for this project.
The bus matrix can be developed in collaboration with business stakeholders, such as the corporate finance manager, as well as source system and business intelligence or data warehouse SMEs.
The architecture of the dataset should support future BI and analytics projects of the organization involving the given business processes (fact tables) and business entities (dimension tables). For example, the same dataset containing Internet Sales data should support both an executive’s sales and revenue dashboard as well a business analyst’s ad hoc analysis via Excel PivotTables.
Additional business processes, such as maintaining product inventory levels, could potentially be added to the same Power BI dataset in a future project. Importantly, these future additions could leverage existing dimension tables, such as a product table, including its source query, column metadata, and any defined hierarchies.
Each Power BI report is usually tied to a single dataset. Given this 1:1 relationship and the analytical value of integrated reports across multiple business processes, such as Inventory and Internet Sales, it’s important to design datasets that can scale to support multiple star schemas. Consolidating business processes into one or a few datasets also makes solutions more manageable and is a better use of source system resources, as common tables (for example, Product, Customer) are only refreshed once.
The data warehouse bus matrix is a proven tool used during the design process of data warehouses and is just as effective for designing Power BI datasets. We cover this design process in the next section.
Dataset design process
With the data warehouse bus matrix as a guide, the business intelligence team can work with representatives from the relevant business teams and project sponsors to complete the following four-step dataset design process:
- Select the business process
- Declare the grain
- Identify the dimensions
- Define the facts
In the following sections, we cover each of these steps in detail, starting with selecting the business process.
Select the business process
Ultimately, each business process is represented by a fact table with a star schema of many-to-one relationships to dimensions. In a discovery or requirements gathering process, it can be difficult to focus on a single business process in isolation as users regularly analyze multiple business processes simultaneously or need to.
Nonetheless, it’s essential that the dataset being designed reflects low-level business activities (for example, receiving an online sales order) rather than consolidation or integration of distinct business processes such as a table with both online and reseller sales data:
- Confirm that the answer provided to the first question of the project template from Table 1.2 regarding data sources is accurate.
- In this project, the required business processes are Internet Sales, Reseller Sales, and Annual Sales and Margin Plan.
- Each of the three business processes corresponds to a fact table to be included in the Power BI dataset.
- Obtain a high-level understanding of the top business questions for each business process. For example, “What are total sales relative to the Annual Sales Plan and relative to last year?”.
- In this project, Internet Sales and Reseller Sales are combined into overall corporate sales and margin KPIs.
- Optionally, reference the data warehouse bus matrix of business processes and their related dimensions. For example, discuss the integration of inventory data and the insights this integration may provide.
- In many projects, a choice or compromise has to be made given the limited availability of certain business processes and the costs or timelines associated with preparing this data for production use.
- Additionally, business processes (fact tables) are the top drivers of the storage and processing costs of the dataset and thus should only be included if necessary.
A common anti-pattern (a response to a reoccurring problem that is generally ineffective and potentially counterproductive) to avoid in Power BI projects is the development of datasets for specific projects or teams rather than business processes. For example, developing a dataset exclusively for the marketing team and another dataset created for the sales organization. Assuming both teams require access to the same sales data, this approach naturally leads to a waste of resources, as the same sales data is queried and refreshed twice and both datasets consume storage resources in the Power BI service.
Additionally, this isolated approach leads to manageability and version control issues, as the datasets may contain variations in transformation or metric logic. Therefore, although the analytical needs of specific business users or teams are indeed the priority of BI projects, it’s important to plan for sustainable solutions that can ultimately be shared across teams.
Let’s now look at the next step in the process, declaring the grain.
Declare the grain
The grain of fact tables ultimately governs the level of detail available for analytical queries as well as the amount of data to be accessed. Higher grains mean more detail while lower grains mean less detail.
All rows of a fact table should represent the individual business process from step 1 at a certain level of detail or grain such as the header level or line level of a purchase order. Therefore, each row should have the same meaning and thus contain values for the same key columns to dimensions and the same numeric columns.
During this step, determine what each row of the different business processes represents. For example, each row of the Internet Sales fact table represents the line of a sales order from a customer. Conversely, the rows of the Sales and Margin Plan are aggregated to the level of a Calendar Month, Products Subcategory, and Sales Territory region.
If it’s necessary to apply filters or logic to treat certain rows of a fact table differently than others, the fact table likely contains multiple business processes (for example, shipments and orders). Although it’s technically possible to build this logic into DAX measure expressions, well-designed fact tables benefit Power BI and other data projects and tools over the long term. Thus, in such circumstances, it is advisable to split the table into two separate tables.
When analyzing the grain of fact tables, consider the following:
- Review and discuss the implications of the chosen grain in terms of dimensionality and scale
- Higher granularities provide greater levels of dimensionality and thus detail but result in much larger fact tables
- If a high grain or the maximum grain is chosen, determine the row counts per year and the storage size of this table once loaded into Power BI datasets
- If a lower grain is chosen, ensure that project stakeholders understand the loss of dimensionalities, such as the inability to filter for specific products or customers
In general, a higher granularity is recommended for analytical power and sustainability. If a less granular design is chosen, such as the header level of a sales order, and this grain later proves to be insufficient to answer new business questions, then either a new fact table would have to be added to the dataset or the existing fact table and all of its measures and dependent reports would have to be replaced.
Once the grains of all fact tables are determined, it is time to move on to the next step and identify the dimensions.
Identify the dimensions
Dimensions are a natural byproduct of the grain chosen in the previous design process step. A single sample row from the fact table should clearly indicate the business entities (dimensions) associated with the given process such as the customer who purchased an individual product on a certain date and at a certain time via a specific promotion.
Fact tables representing a lower grain have fewer dimensions. For example, a fact table representing the header level of a purchase order may identify the vendor but not the individual products purchased from the vendor.
When analyzing dimensions, consider the following:
- Identify and communicate the dimensions that can be used to filter (aka slice and dice) each business process.
- The foreign key columns based on the grain chosen in the previous step reference dimension tables.
- Review a sample of all critical dimension tables, such as Product or Customer, and ensure these tables contain the columns and values necessary or expected.
- Communicate which dimensions can be used to filter multiple business processes simultaneously. For example, in this project, the Product, Sales Territory, and Date dimensions can be used to filter all three fact tables.
- The data warehouse bus matrix referenced earlier can be helpful for this step.
- Look for any gap between the existing dimension tables and business questions or related reports.
- For example, existing IT-supported reports may contain embedded logic that creates columns via Structured Query Language (SQL) that are not stored in the data warehouse.
- Strive to maintain version control for dimension tables and the columns (attributes) within dimension tables.
- It may be necessary for project stakeholders to adapt or migrate from legacy reports or an internally maintained source to the Corporate BI source.
A significant challenge to the identity of the dimensions step can be a lack of Master Data Management (MDM) and alternative versions. MDM is a discipline practiced by organizations in order to ensure the accuracy, uniformity, semantic consistency, and stewardship of the official data assets.
For example, the sales organization may maintain its own dimension tables in Excel or Microsoft Access and its naming conventions and hierarchy structures may represent a conflict or gap with the existing data warehouse. Additionally, many corporate applications may store their own versions of common dimensions, such as products and customers.
These issues should be understood and, despite pressure to deliver BI value quickly or according to a specific business team’s preferred version, the long-term value of a single definition for an entire organization as expressed via the bus matrix should not be sacrificed.
With dimensions identified, the final step is to define the fact tables.
Define the facts
The facts represent the numeric columns included in the fact tables. While the dimension columns from step 3 are used for relationships to dimension tables, the fact columns are used in measures containing aggregation logic such as the sum of a quantity column and the average of a price column.
When defining the facts, consider the following:
- Define the business logic for each fact, represented by measures in the dataset. For example, gross sales is equal to the extended amount on a sales order, and net sales is equal to gross sales minus discounts.
- Any existing documentation or relevant technical metadata should be reviewed and validated.
- Similar to the dimensions, any conflicts between existing definitions should be addressed so that a single definition for a core set of metrics is understood and approved.
- Additionally, a baseline or target source should be identified to validate the accuracy of the metrics to be created. For example, several months following the project, it should be possible to compare the results of DAX measures from the Power BI dataset to an SSRS report or a SQL query.
- If no variance exists between the two sources, the DAX measures are valid and thus any doubt or reported discrepancy is due to some other factor
See Chapter 2, Preparing Data Sources, Chapter 3, Connecting Sources and Transforming Data with M, Chapter 4, Designing Import and DirectQuery Data Models, and Chapter 5, Developing DAX Measures and Security Roles, for details on the fact table columns to include in Power BI datasets (for import or DirectQuery) and the development of DAX metric expressions. The fact definitions from this step relate closely to the concept of base measures described in Chapter 5, Developing DAX Measures and Security Roles.
Ultimately, the DAX measures implemented have to tie to the approved definitions, but there are significant data processing, storage, and performance implications based on how this logic is computed. In many cases, the Power BI dataset can provide the same logic as an existing system but via an alternative methodology that better aligns with Power BI or the specific project need.
This concludes the dataset design process. Next, we cover another important topic related to datasets, data profiling.
Data profiling
The four-step dataset design process can be immediately followed by a technical analysis of the source data for the required fact and dimension tables of the dataset. Technical metadata, including database diagrams and data profiling results, such as the existence of null values in source columns, are essential for the project planning stage. This information is used to ensure the Power BI dataset reflects the intended business definitions and is built on a sound and trusted source.
For example, Figure 1.12 shows a database diagram that describes the schema for the reseller sales business process:
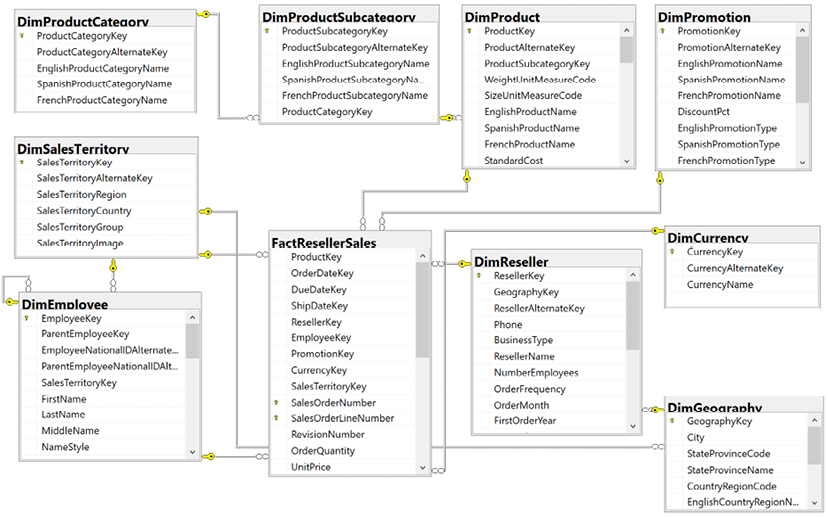
Figure 1.12: SQL Server database diagram: reseller sales
The foreign key constraints (the lines between the tables) identify the surrogate key columns used in the relationships of the Power BI dataset and the referential integrity of the source database. The columns used as keys are displayed in Figure 1.12 with small key icons to the left of the column name.
In this schema, the product dimension is modeled as three separate dimension tables—DimProduct, DimProductSubcategory, and DimProductCategory. Given the priorities of usability, manageability, and query performance, a single denormalized product dimension table that includes essential Product Subcategory and Product Category columns is generally recommended. This reduces the volume of source queries, relationships, and tables in the data model and improves report query performance, as fewer relationships must be scanned by the dataset engine.
Clear visibility of the source system, including referential and data integrity constraints, data quality, and any MDM processes, is essential. Unlike other popular BI tools, Power BI is capable of addressing many data integration and quality issues, particularly with relational database sources that Power BI can leverage to execute data transformation operations. However, Power BI’s extract, transform, load (ETL) capabilities are not a substitute for data warehouse architecture and enterprise ETL tools, such as SQL Server Integration Services (SSIS).
For example, it’s the responsibility of the data warehouse to support historical tracking with slowly changing dimension ETL processes that generate new rows and surrogate keys for a dimension when certain columns change. To illustrate a standard implementation of slowly changing dimensions, Figure 1.13 shows the results of a query of the DimProduct table in the Adventure Works data warehouse returning three rows for one product (FR-M94B-38):

Figure 1.13: Historical tracking of dimensions via slowly changing dimension ETL processes
It’s the responsibility of the Power BI team and particularly the dataset designer to accurately reflect this historical tracking via relationships and DAX measures, such as the count of distinct products not sold. Like historical tracking, the data warehouse should also reflect all master data management processes that serve to maintain accurate master data for essential dimensions, such as customers, products, and employees.
In other words, despite many line of business applications and Enterprise Resource Planning (ERP), Customer Relationship Management (CRM), Human Resource Management (HRM), and other large corporate systems that store and process the same master data, the data warehouse should reflect the centrally governed and cleansed standard. Therefore, creating a Power BI dataset that only reflects one of these source systems may later introduce version control issues and, similar to choosing an incorrect granularity for a fact table, can ultimately require costly and invasive revisions.
Different tools are available with data profiling capabilities. If the data source is SQL Server, SSIS can be used to analyze source data intended for use in a project. In Figure 1.14, the Data Profiling task is used in an SSIS package to analyze the customer dimension table:
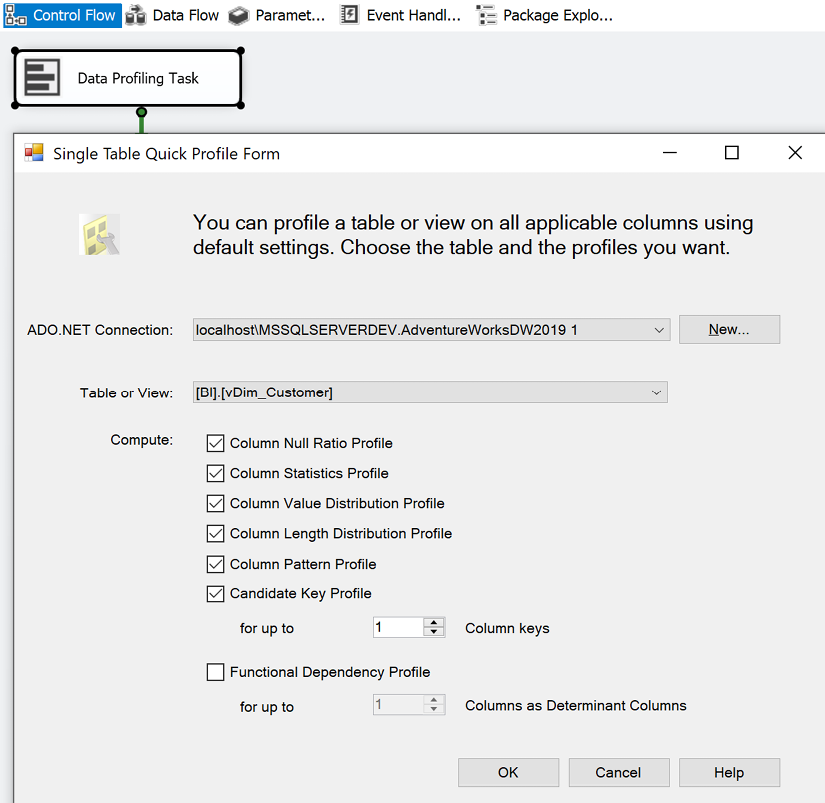
Figure 1.14: Data Profiling task in SSIS
The Data Profiling task requires an ADO.NET connection to the data source and can write its output to an XML file or an SSIS variable. In this example, the ADO.NET data source is the Adventure Works data warehouse database in SQL Server 2016 and the destination is an XML file (DataProfilingData.xml).
Once the task is executed, the XML file can be read via the SQL Server Data Profile Viewer as per the following example. Note that this application, Data Profile Viewer, requires the installation of SQL Server and that the Data Profiling task only works with SQL Server data sources. All fact and dimension table sources can be analyzed quickly for the count and distribution of unique values, the existence of null values, and other useful statistics.
Each Data Profiling task can be configured to write its results to an XML file on a network location for access via tools such as the Data Profile Viewer. In the example shown in Figure 1.15, the Data Profile Viewer is opened from within SSIS to analyze the output of the Data Profiling task for the customer dimension table:
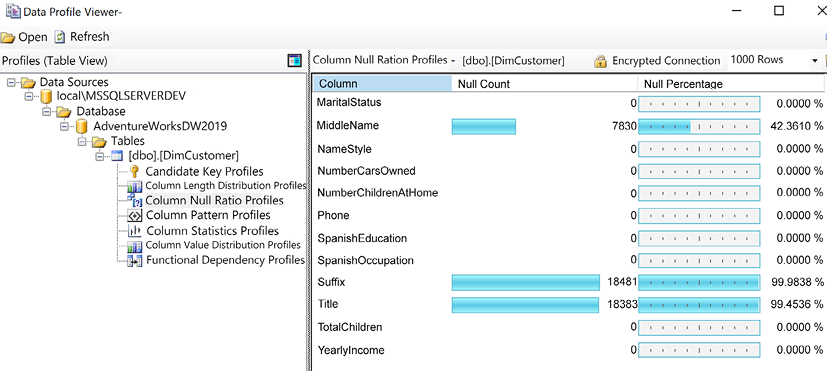
Figure 1.15: Data Profile Viewer: column null ratio profiles of DimCustomer table
Identifying and documenting issues in the source data via data profiling is a critical step in the planning process. For example, the cardinality or count of unique values largely determines the data size of a column in an import mode dataset. Similarly, the severity of data quality issues identified impacts whether a DirectQuery dataset is a feasible option.
In general, enterprise BI teams should utilize enterprise data profiling tools such as those included with SQL Server. However, basic data profiling tools are also available in Power BI Desktop, which we cover next.
Data profiling with Power BI Desktop
Power BI Desktop includes simple data quality reporting within the Power Query Editor interface. The Power Query Editor is used to develop queries for connecting to and ingesting data from source systems and is covered in detail in Chapter 2, Preparing Data Sources.
To access the data quality reporting within Power Query Editor, use the View tab and check the boxes for Column quality, Column distribution, and Column profile as shown in Figure 1.16:
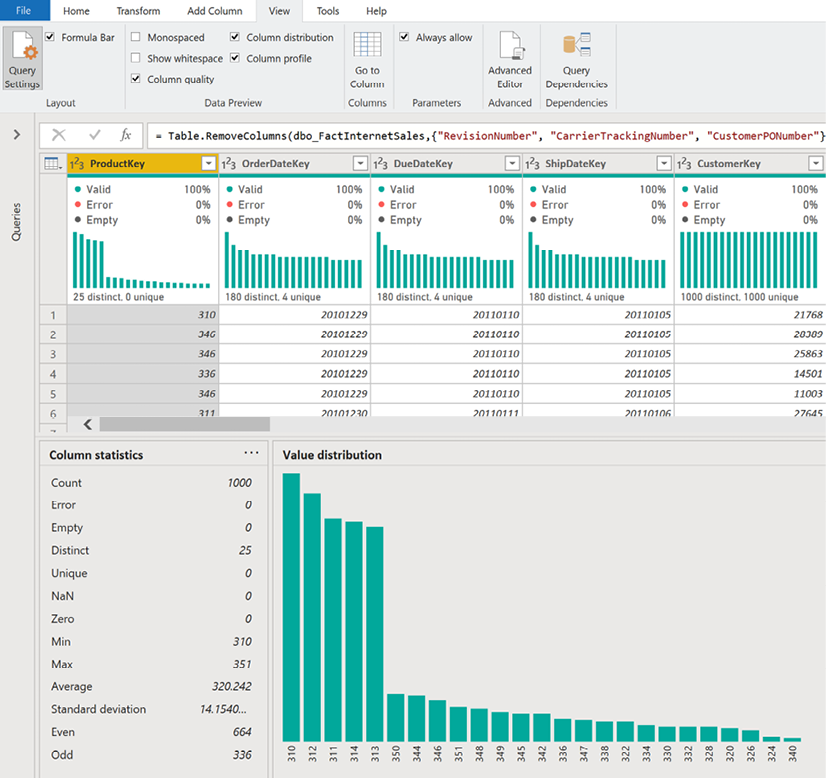
Figure 1.16: Data quality in Power Query Editor
As shown in Figure 1.16, activating the data quality reporting within Power Query Editor displays many important statistics such as the number of distinct values, the value distribution, and the percentage of valid values and errors.
While not as comprehensive as some enterprise data quality tools, the data quality reporting within Power Query Editor is useful as an additional data quality check for data accessed by Power BI Desktop.
Once source data is profiled, the next natural step is dataset planning as covered in the next section.
Dataset planning
After the source data is profiled and evaluated against the requirements identified in the four-step dataset design process, the BI team can further analyze the implementation options for the dataset. In almost all Power BI projects, even with significant investments in enterprise data warehouse architecture and ETL tools and processes, some level of additional logic, integration, or transformation is needed to enhance the quality and value of the source data or to effectively support a business requirement.
A priority of the dataset planning stage is to determine how the identified data transformation issues are addressed to support the dataset. Additionally, based on all available information and requirements, the project team must determine whether to develop an import mode dataset, DirectQuery dataset, or composite dataset. Import, DirectQuery, and composite datasets are explained in the section Import, DirectQuery, Live, and Composite Datasets.
The initial step in the dataset planning process is planning for data transformations, which we’ll review next.
Data transformations
To help clarify the dataset planning process, a diagram such as Figure 1.17 can be created that identifies the different layers of the data warehouse and Power BI dataset where transformation and business logic can be implemented:

Figure 1.17: Dataset planning architecture
In some projects, minimal transformation logic is needed and can be easily included in the Power BI dataset or the SQL views accessed by the dataset. For example, if only a few additional columns are needed for a dimension table and there’s straightforward guidance on how these columns should be computed, the IT organization may choose to implement these transformations within Power BI’s Power Query (M) queries rather than revise the data warehouse, at least in the short term.
If a substantial gap between BI needs and the corporate data warehouse is allowed to persist and grow due to various factors, such as cost, project expediency, and available data warehouse skills, then Power BI datasets become more complex to build and maintain. Dataset designers should regularly analyze and communicate the implications of datasets assuming greater levels of complexity.
However, if the required transformation logic is complex or extensive with multiple join operations, row filters, and data type changes, then the IT organization may choose to implement essential changes in the data warehouse to support the new dataset and future BI projects. For example, a staging table and a SQL stored procedure may be needed to support a revised nightly update process, or the creation of an index may be needed to deliver improved query performance for a DirectQuery dataset.
Ideally, all required data transformation and shaping logic could be implemented in the source data warehouse and its ETL processes so that Power BI is exclusively used for analytics and visualization. However, in the reality of scarce IT resources and project delivery timelines, typically at least a portion of these issues must be handled through other means, such as SQL view objects or Power BI’s M query functions.
A best practice is to implement data transformation operations within the data warehouse or source system. This minimizes the resources required to process an import mode dataset and, for DirectQuery datasets, can significantly improve query performance, as these operations would otherwise be executed during report queries.
For many common data sources, such as Oracle and Teradata, M query expressions are translated into equivalent SQL statements (if possible) and these statements are passed back to the source system via a process called query folding. See Chapter 2, Preparing Data Sources, for more details on query folding.
As per the dataset planning architecture diagram, a layer of SQL views should serve as the source objects to datasets created with Power BI Desktop. By creating a SQL view for each dimension and fact table of the dataset, the data source owner or administrator is able to identify the views as dependencies of the source tables and is therefore less likely to implement changes that would impact the dataset without first consulting the BI team.
Additionally, the SQL views improve the availability of the dataset, as modifications to the source tables are much less likely to cause the refresh process to fail.
As a general rule, the BI team and IT organization should avoid the use of DAX for data transformation and shaping logic, such as DAX calculated tables and calculated columns. The primary reason for this is that it weakens the link between the dataset and the data source, as these expressions are processed entirely by the Power BI dataset after source queries have been executed.
Additionally, the distribution of transformation logic across multiple layers of the solution (SQL, M, DAX) causes datasets to become less flexible and manageable. Moreover, tables and columns created via DAX do not benefit from the same compression algorithms applied to standard tables and columns and thus can represent both a waste of resources as well as a performance penalty for queries accessing these columns.
In the event that required data transformation logic cannot be implemented directly in the data warehouse or its ETL or Extract-Load-Transform (ELT) process, a second alternative is to build this logic into the layer of SQL views supporting the Power BI dataset. For example, a SQL view for the product dimension could be created that joins the Product, Product Subcategory, and Product Category dimension tables, and this view could be accessed by the Power BI dataset.
As a third option, M functions in the Power BI query expressions could be used to enhance or transform the data provided by the SQL views. See Chapter 2, Preparing Data Sources, for details on these functions and the Power BI data access layer generally.
Once data transformation planning is complete, the next step is to determine the mode of the dataset as explained in the next section.
Import, DirectQuery, Live, and Composite datasets
A subsequent but closely related step in dataset planning is choosing between the default import mode, DirectQuery mode, Live mode, or composite mode. In some projects, this is a simple decision as only one option is feasible or realistic given the known requirements while other projects entail significant analysis of the pros and cons of either design.
If a data source is considered slow or ill-equipped to handle a high volume of analytical queries, then an import mode dataset is very likely the preferred option. Likewise, if near real-time visibility of a data source is an essential business requirement, then DirectQuery or Live mode are the only options.
The DirectQuery and Live modes are very similar to one another. Both methods do not store data within the dataset itself but rather query source systems directly to retrieve data based upon user interaction with reports and dashboards. However, Live mode is only supported for Power BI datasets, Analysis Services (both multi-dimensional and tabular), and Dataverse.
When DirectQuery/Live is a feasible option or can be made a feasible option via minimal modifications, organizations may be attracted to the prospect of leveraging investments in high-performance database and data warehouse systems. However, the overhead costs and version control concerns of import mode can be reduced via Power BI features, such as the dataset refresh APIs or pipelines discussed in Chapter 10, Managing Application Workspaces and Content, and incremental data refresh.
The following list of questions can help guide an import versus DirectQuery/Live decision:
- Is there a single data source for our dataset that Power BI supports as a DirectQuery/Live source?
For example, each fact and dimension table needed by the dataset is stored in a single data warehouse database, such as Oracle, Teradata, SQL Server, or Azure SQL Database.
The following URL identifies the data sources supported for DirectQuery/Live with Power BI, including sources that are currently only in beta: http://bit.ly/2AcMp25.
- If DirectQuery/Live is an option per question 1, is this source capable of supporting the analytical query workload of Power BI?
For example, although Azure Synapse (formerly Azure SQL Data Warehouse) technically supports DirectQuery, it’s not recommended to use Azure Synapse as a DirectQuery data source, given the limitations on the volume of concurrent queries supported and a lack of query plan caching.
In many other scenarios, the data source may not be optimized for analytical queries, such as with star schema designs and indexes that target common BI/reporting queries. Additionally, if the database is utilized for Online Transaction Processing (OLTP) workloads and/or other BI/analytical tools, then it’s necessary to evaluate any potential impact on these applications and the availability of resources.
- Is an import mode dataset feasible, given the size of the dataset and any requirements for near real-time visibility of the data source?
Currently, Power BI Premium supports import mode datasets up to 400 GB in size. However, the true limit for model sizes in Premium is limited to the total available amount of RAM within the capacity. In addition, PPU datasets are limited to 100 GB and Pro datasets are limited to 10 GB. Therefore, truly massive datasets must either use a DirectQuery data source or a Live connection to an Analysis Services model.
Additionally, Power BI Premium currently supports a maximum of 48 refreshes per day for import mode datasets. Therefore, if there’s a need to view data source data for the last several minutes or seconds, an import mode dataset is not feasible.
- If the DirectQuery/Live source is capable of supporting a Power BI workload as per question 2, is the DirectQuery/Live connection more valuable than the additional performance and flexibility provided via the import mode?
- In other words, if an import mode dataset is feasible, as per question 3, then an organization should evaluate the trade-offs of the two modes. For example, since an import mode dataset is hosted in the Power BI service and in a compressed and columnar in-memory data store, it is likely to provide a performance advantage. This is particularly the case if the DirectQuery/Live source is hosted on-premises and thus queries from the Power BI cloud service must pass through the on-premises data gateway reviewed in Chapter 11, Managing the On-Premises Data Gateway.
Additionally, any future data sources and most future data transformations need to be integrated into the DirectQuery/Live source. With an import mode dataset, the scheduled import process can include many data transformations and potentially other data sources without negatively impacting query performance.
For organizations that have invested in powerful data source systems for BI workloads, there’s a strong motivation to leverage this system via DirectQuery/Live. In general, business intelligence teams and architects are averse to copying data into another data store and thus creating both another data movement and a source of reporting that must be supported.
Let’s now take a more detailed look at each of the possible dataset modes.
Import mode
An import mode dataset can include multiple data sources, such as SQL Server, Oracle, and an Excel file. Since a snapshot of the source data is loaded into the Power BI cloud service, in addition to its in-memory columnar compressed structure, query performance is usually good for most scenarios.
Another important advantage of import mode datasets is the ability to implement data transformations without negatively impacting query performance. Unlike DirectQuery/Live datasets, the operations of data source SQL views and the M queries of import datasets are executed during the scheduled data refresh process. The Query design per dataset mode section of Chapter 2, Preparing Data Sources, discusses this issue in greater detail.
Given the performance advantage of the in-memory mode relative to DirectQuery/Live, the ability to integrate multiple data sources, and the relatively few use cases where real-time visibility is required, most Power BI datasets are designed using import mode.
Next, we provide more detail about DirectQuery/Live mode.
DirectQuery/Live mode
While DirectQuery and Live connections are different, as explained previously, they are similar to one another and share common traits, such as not storing data within the dataset itself but rather querying source systems directly to retrieve data based upon user interaction with reports and dashboards.
A DirectQuery/Live dataset is traditionally limited to a single data source and serves as merely a thin semantic layer or interface to simplify the report development and data exploration experience. DirectQuery/Live datasets translate report queries into compatible queries for the data source and leverage the data source for query processing, thus eliminating the need to store and refresh an additional copy of the source data.
A common use case of DirectQuery/Live is to provide near real-time visibility to changes in source data. For example, a manufacturer may want to monitor activities occurring on a manufacturing floor and potentially link this monitoring solution to notifications or alerts.
The performance of DirectQuery/Live datasets is strongly influenced by the design and resources available to the source system. Successful DirectQuery/Live datasets generally result from performance optimizations implemented in the source system such as via columnstore indexes, materialized views, and star schema designs that reduce the complexity of report queries.
With import and DirectQuery/Live modes understood, we next cover the relatively new composite mode.
Composite mode
Composite mode is perhaps the most significant enhancement to Power BI in recent years as it enables table-level control over a table’s storage mode (Import, DirectQuery, Dual).
Storage modes are covered in greater detail in Chapter 2, Preparing Data Sources. When designed effectively, a composite model can deliver the performance benefits of import (in-memory) models but also provide scalability for large DirectQuery source systems.
A common design pattern with composite models is to set the storage mode of a massive fact table to DirectQuery but configure a smaller, targeted aggregation table in import mode and related dimension tables in dual mode. Power BI automatically utilizes the in-memory aggregation table to resolve incoming report queries if the given aggregation table(s) and its related Dual mode dimension tables contain the necessary data.
Even more recently, Microsoft has unveiled DirectQuery for Power BI datasets and Azure Analysis Services. With DirectQuery for Power BI datasets and Azure Analysis Services, datasets developed and published to Power BI can be chained or extended to produce new datasets that incorporate additional import or DirectQuery sources.
With data transformation and data model storage mode decisions made, the dataset planning process is complete. Let’s now take a look at how these planning processes and decisions apply to our sample project introduced earlier in this chapter.
Sample project analysis
As per the data refresh questions from the project template (questions 7 and 8), the Power BI dataset only needs to be refreshed daily—there’s not a need for real-time visibility of the data source. From a dataset design perspective, this means that the default import mode is sufficient for this project in terms of latency or data freshness.
The project template from Table 1.2 also advises that an Excel file containing the Annual Sales Plan must be included in addition to the historical sales data in the SQL Server data warehouse. Therefore, unless the Annual Sales Plan data can be migrated to the same SQL Server database containing the Internet Sales and Reseller Sales data, an import mode dataset is the only option.
The data security requirements from the project template can be implemented via simple security roles and therefore do not materially impact the import or DirectQuery decision. DirectQuery datasets can support dynamic or user-based security models as well but, given restrictions on the DAX functions that can be used in security roles for DirectQuery datasets, import mode datasets can more easily support complex security requirements. However, depending on the data source and the security applied to that source relative to the requirements of the project, organizations may leverage existing data source security through a DirectQuery dataset via a single sign-on with Kerberos delegation.
Finally, the BI team must also consider the scale of the dataset relative to size limitations with import mode datasets. As per the project template in Table 1.2 (#6), 3-4 years of sales history needs to be included, and thus the dataset designer needs to determine the size of the Power BI dataset that would store that data. For example, if Power BI Premium capacity is not available, the dataset is limited to a max size of 1 GB. If Power BI Premium capacity is available, large datasets (for example, 10 GB+) potentially containing hundreds of millions of rows can be published to the Power BI service.
The decision for this project is to develop an import mode dataset and to keep the Excel file containing the Annual Sales Plan on a secure network location. The BI team will develop a layer of views to retrieve the required dimension and fact tables from the SQL Server database as well as connectivity to the Excel file. The business is responsible for maintaining the following Annual Sales Plan Excel file in its current schema, including any row updates and the insertion of new rows for future plan years. An excerpt from this file is shown in Figure 1.18:

Figure 1.18: Annual Sales Plan in Excel data table
By using the existing Excel file for the planned sales and margin data rather than integrating this data into the data warehouse, the project is able to start faster and maintain continuity for the business team responsible for this source. Similar to collaboration with all data source owners, the dataset designer could advise the business user or team responsible for the sales plan on the required structure and the rules for maintaining the data source to allow for integration into Power BI.
For example, the name and directory of the file, as well as the column names of the Excel data table, cannot be changed without first communicating these requested revisions. Additionally, the values of the Sales Territory Region, Product Subcategory, and Calendar Yr-Mo columns must remain aligned with those used in the data warehouse to support the required actual versus plan visualizations.
The sales plan includes multiple years and represents a granularity of the month, sales territory region, and product subcategories.
In other words, each row represents a unique combination of values from the Calendar Yr-Mo, Sales Territory Region, and Product Subcategory columns. The Bridge tables section in Chapter 4, Designing Import and DirectQuery Data Models, describes how these three columns are used in integrating the Sales Plan data into the dataset containing Internet Sales and Reseller Sales data.
This completes the sample project analysis and concludes this chapter.
Summary
In this chapter, we’ve walked through the primary elements and considerations in planning a Power BI project. A standard and detailed planning process inclusive of the self-service capabilities needed or expected, project roles and responsibilities, and the design of the dataset can significantly reduce the time and cost to develop and maintain the solution. With a sound foundation of business requirements and technical analysis, a business intelligence team can confidently move forward into the development stage.
In the next chapter, the two data sources identified in this chapter (SQL Server and Excel) are accessed to begin the development of an import mode dataset. Source data is retrieved via Power BI’s M language queries to retrieve the set of required fact and dimension tables. Additionally, several data transformations and query techniques are applied to enhance the analytical value of the data and the usability of the dataset.
Join our community on Discord
Join our community’s Discord space for discussions with the author and other readers: https://discord.gg/q6BPbHEPXp


