


 Download code from GitHub
Chapter 1: Introducing Units of Digital Information
Welcome to the world of BIM data and digitalization!
Before we start digging into the core of digitalization in the Architecture, Engineering, Construction (AEC) industry, BIM data visualization, or management with Autodesk Dynamo and its business intelligence tools, I would like you to know why every business on earth is becoming a data-driven business. If you look around, every type of company, small or large, non-profit or governmental, is walking through a digital transformation, implementing and applying ones and zeros to every process they can. However, in the end, all that matters for company owners is that their company has to adapt to the new business model. It will take time for all of us to go fully digital, but we all will, whether it takes 10 months or 10 years; we are all already in that queue.
Even though this book's aim is to give you some knowledge on BIM data visualization and management, in the first chapter, we will start talking about data. Though we will set BIM aside for now, we will return to it later on, once we get more comfortable with digitalization and basic computer science concepts. We are going to learn about the events that started our digital era, and how modern devices use binary code to represent things such as pictures and videos. Then we will talk about types of digital data and about all of the data that surrounds us, all the time, everywhere (that's why they call it big data, right?!). Finally, we will explore so-called hybrid jobs.
But don't worry, I won't go too much into technical details, although we will cover some technical notions when it comes to Dynamo, data manipulation, and databases. So, get a cup of coffee and if you can, get an Italian one (even better if it's Neapolitan), and meet me in the first chapter!
Figure 1.1 – Say "big data" one more time meme!
In this chapter, we will cover the following topics:
- Exploring the beginning of the digitization era
- Learning how simple digital data is
- Getting to know types of digital data
- Understanding how much data we produce
- Learning about hybrid jobs
Exploring the beginning of the digitization era
Lots of companies across the globe started the digital transformation process around the 1950s, when Dr Presper Eckert and Dr John Mauchly invented the UNIVAC, the Universal Automatic Computer, after receiving funds from the Census Bureau. This computer was the first commercial computer for business and government applications! The real leap, though, when things started to become super-duper serious, was in the 1990s, due to the diffusion of the world wide web. If you think about it, ever since then, shopping, banking, working, health, education, and so on, changed forever!
I remember when I was a kid at the end of 1990s; during weekends, my family and I used to go to the shops. There, like everyone else, me, my twin brother, my sister, and our parents bought new clothes, groceries, or new games for the PC (which was my and my dad's favorite!). At that time, no one thought that one day you would be able to buy groceries using your PC or your smartphone. For example, while I'm writing this book, my partner and I are also moving to a new house and have bought a new sofa and a few other pieces of furniture online.
In the following graph, you can have a look at the growth, from 1996, of two of the biggest e-commerce companies – Amazon and eBay:
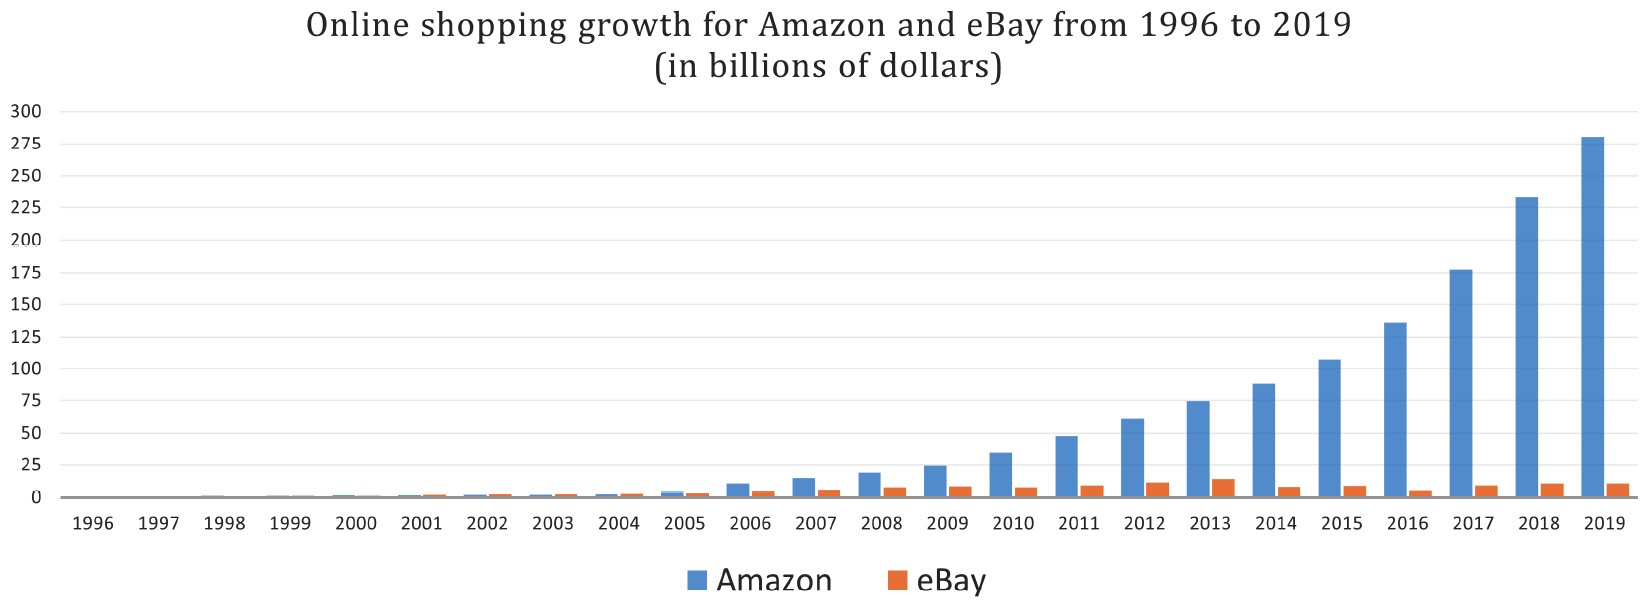
Figure 1.2 – Growth of Amazon and eBay online shopping from 1996 to 2019
The important thing here that I would like you to understand is that since the 1990s (more or less), the impact of digitalization has been huge for every field, not only for e-commerce. Things such as paper and photographs have been transformed into binary code, the ones and the zeros of computer storage.
Let me ask you this question: Why is data so valuable?
The short answer is that, today, data is profitable. Google and Facebook, for example, built an empire by collecting and analyzing people's data, and today, advertisement companies can even predict what you'll buy tomorrow, literally. When I'm talking to friends and colleagues about this subject, I like to ask them a question, so I want to do the same with you: Do you remember what you were doing or searching on the internet in May 2009, for example? No? Well, Google does. The data we provide to those companies is so vast that they found a new name for it: big data!
But to better understand this sea of data, to use that information to upgrade a company process or find possible mistakes, or even predict something somehow, companies needed to turn it from raw data into well-organized information. And once they did that, they could give advertisers, for example, a set of tools to target their potential customers with astonishing precision. At this point, with all of the data turned into useful information, they needed to build something technologically advanced to analyze and categorize everything deeply, and use that information to make future predictions. That's where Artificial Intelligence (AI) comes to the stage. To give you an example, let's look at the social media platform Facebook. Instead of merely offering advertisers the ability to target their users using data such as demographics, gender, or consumer preferences, they instead provided the ability to target them based on what they will think, how they will behave, and what they will buy. Facebook, back in 2016, revealed an AI engine with self-improving capabilities that could predict all of those things!
And as insane and frightening and unique as it may sound, this is not the only prediction engine out there. In my opinion, I hope that governments will better regulate those systems because they raise more and more questions every day, especially ethically speaking. Think, for example, about Cambridge Analytica, the Facebook scandal of early 2018. Without going into too many details, Cambridge Analytica was implicated in a massive data breach. They used almost 90 million people's private data without their consent. That's massive. And the final goal was to create customized and targeted ads to address your vote for the upcoming political election. Again, like everything else, AI can help our society in many ways, but this is a clear example of how dangerous those systems may be in the wrong hands.
In this section, we just scratched the surface, introducing the events that started the digital era. Coming up, we will cover quite a curious subject: how digital content comes to life on the screens of our devices, starting from a series of ones and zeros.
Learning how simple digital data is
My life and your life are full of data. When you commute to work, for example, you could be scrolling through Twitter, looking at friend's pictures on their social networks, buying groceries from your favorite online store, or streaming music. Everything represented by computers is made of ones and zeros; it is that simple. But how is that possible? How did pictures, videos, and songs start from a simple series of ones and zeros?
Although the answer could be a lot more complex and technical, we will stick to the basics to understand the general concepts. Essentially, to do that, we need to learn things from the point of view of a computer, something that you use all of the time and probably take for granted. This concept is essential to understand when it comes to learning computer science theory. Each one or zero stated in a single switch is called a bit, the smallest piece of data a computer can store. Just one circuit board can handle billions of switches, and computers are now able to use billions of bits to represent more complex data, such as text, songs, and images.
So, speaking of switches, an electrical current flows through switches, and when it does or does not travel through a switch, the switch goes on or off. To give you more context, imagine only using words to describe every note of your favorite song, or every scene of your beloved TV show. That is exactly what a computer does! Our devices use binary code as a language to create digital content we all know.
Here is a simple example of the electrical current that flows through switches:
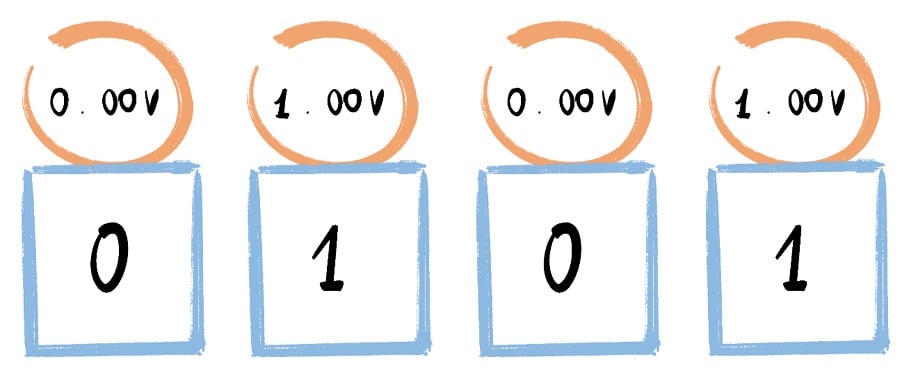
Figure 1.3 – Example of electrical flow that lets switches go on or off
Before going forward with the bits and the switches thing, you need to remember that in the past, we had analog electronics. All of those older electronics, including televisions, used analog signals with variable wave height to represent sounds and images. The problem was that those wave signals were really small and the waveforms could be interrupted by interference caused by any other signals (and nowadays we are surrounded by signals). This caused snow visuals and static sounds, for example. During the last 30 years, analog technologies have all been digitized. Using bits instead of waveforms reduces the interference dramatically.
Fortunately, neither you nor I have to learn binary code to use Word, Photoshop, or Revit! Let's take an image, for example. Every image on a computer screen is made up of dots that we call pixels, and I'm not talking about object-oriented graphics, of course (vector artworks); let's keep it simple. Anywhere between a few hundred to a few billion pixels can constitute an image, and each pixel is made up of one color, which is coded with decimal values or hexadecimal code. Those decimal values and code have been transformed by the computer, starting from a series of ones and zeros, which started from the flow of electrical current into billions of switches.
Now that we know how computers process binary code, we are ready to talk about digital data types, which is fundamental to understanding more complex subjects, such as data manipulation and databases.
Getting to know types of digital data
Let's go straight to the point. To group or classify the data out there, three major groups have been defined: unstructured, semi-structured, and structured.
To give you a simple example, it is possible to compare these types of data to vegetation. I've used three pictures, one for each data type. Take a look at them in the following paragraphs. Data can be represented as trees, leaves, and branches; unstructured data is like a wild and uncultured forest or jungle, with all the nature that creates beautiful chaos. We can imagine semi-structured data as forest paths, where the path is a bit difficult, but not as difficult as the wild and uncultivated forest. The last one is structured data, which is represented by a very well-organized field that it is possible to walk easily through.
So, let's take a look at each of these data types in more detail.
As the name suggests, the unstructured data type is data with an unknown form. It can be a combination of images, text, emails, and video files, and it can create value only when it is processed, analyzed, and well organized.

Figure 1.4 – Unstructured data is like an uncultured forest or jungle
Some of the main characteristics of the unstructured data type are as follows:
- It does not have any particular format or sequence.
- It does not follow any rules or semantics.
- It does not have an easily identifiable structure.
- It cannot be stored in a spreadsheet-like form (that is, based on rows and columns).
- It isn't directly usable or understandable by a program.
So, basically speaking, anything that isn't in a database form belongs to the unstructured data type.
Important note
Gartner estimates that unstructured data constitutes 80% of the world's enterprise data.

Figure 1.5 – Semi-structured data is similar to a forest with paths
The semi-structured type, in contrast, is a type of data that can be processed using metadata tagging, which will help us to catch useful information. With this type of data, it is difficult to determine the meaning of the data, and it is even more challenging to store the data in rows and columns as in a standard database, so even with the availability of metadata, it is not always possible to automate data analysis. To give you an example, please take a look at the following email structure:
To: <Name>
From: <Name>
Subject: <Text>
CC: <Name><Name>
Body:<Graphics, Images, Links, Text, etc.>
Those email tags are considered a semi-structured data type, and similar entities in the data will be grouped in a hierarchy. For each group, there could be a few or a lot of properties, and those properties may or may not be the same. If you read the email structure again you can immediately see that tags give us some metadata. Still, it is almost impossible to organize the data of the body tag, for example, because it will almost certainly contain no format at all. So, let's take a look at the most common features of the semi-structured data type:
- Attributes within the same group may not be the same.
- Similar entities will be grouped.
- It doesn't conform to a data model, but it contains tags and metadata.
- It cannot be stored in a spreadsheet-like form, that is, based on rows and columns.
There are lots of challenges here, too, to better manage, store, and analyze semi-structured data. The computer science community seems to be going toward a unique standard format for storing semi-structured data. All you need to know, for now, is that there is a format that is hardware and software independent, which is XML, an extensible markup language, which is also open source and written in plain text. This XML format is more or less the alter ego of the Industry Foundation Classes (IFC) for BIM models!
The third data type is the structured data type, which is a database of systematic data that can be used by companies for direct analysis and processing. It consists of information that has been both transformed and formatted into a well-defined data model. Without going too much into the technical details, remember that this type of data is mapped into predesigned fields that can later be read and extracted by a relational database. This way of storing information is the best one out of the three types, and even though the relational model minimizes data redundancy, you still need to be careful because structured data is more inter-dependent, and for this reason, it can sometimes be less flexible.

Figure 1.6 – Structured data looks like a well-organized field
So, some of the most important features of the structured data type are as follows:
- It conforms to a data model.
- Similar entities are grouped.
- Attributes within the same group are the same.
- Data resides in fixed fields within a record.
- The definition and meaning of the data is explicitly known.
At this point, I would like you to understand that we will have to carry out different tasks to transform our raw data into structured information, whether we are dealing with unstructured, semi-structured, or structured data.
As you probably already understand, data is becoming a fundamental tool for knowing and understanding the world around us. Simply put, we can think of data as a way to "approach" problems and to "solve" them in the end. And at this point, I would like to introduce you to the Data, Information, Knowledge, Wisdom (DIKW) pyramid, also known as the DIKW model. The pyramid helps us by describing how raw data can be transformed into information, then knowledge, then wisdom. Take a look at the following image. As we move up to the top of the pyramid, we look for patterns, and by imposing structure, organization, classification, and categorization, we turn data without any particular meaning into knowledge, and finally wisdom.
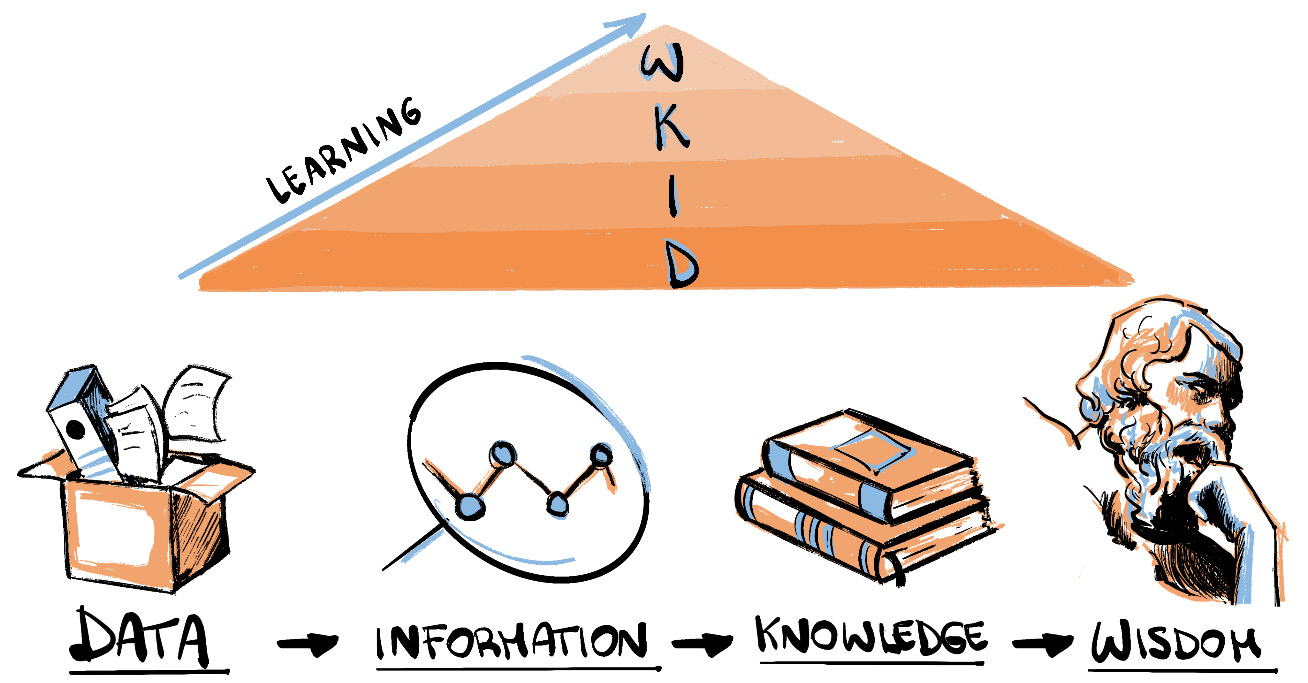
Figure 1.7 – DIKW pyramid
To better fix the concept in your head, I would like to give you a simple yet practical example of the DIKW pyramid by talking about the weather! Imagine that it is raining; this is an objective thing and has no particular meaning, so we can associate raining with data. Then, if I tell you that it started to rain at 7p.m. and the temperature dropped by 2 degrees, that is information. Continuing on that path, if we can explain why this is happening, like saying that the temperature dropped because of low pressure in the atmosphere, you're talking about knowledge. And in the end, if we get a complete picture of things such as temperature gradients, air currents, evaporation, and so on, we can statistically make predictions about what will happen in the future – that's wisdom!
Although we didn't go into the technical details, I would like you to remember that businesses and organizations all around the world use processes such as the one described here, the DIKW pyramid, when it comes to organizing their data.
Here, we've learned some fundamental concepts, such as types of digital data and their differences. We've also learned about the DIKW pyramid. Next, we will talk about how much data we produce every 60 seconds!
Understanding how much data we produce
In this section, we will dive into a little bit of computer science, learning about digital data measuring units, but we will also talk about a curious subject. I'm talking about the data we produce every 60 seconds: it is unbelievable! So, first of all, let's talk about measuring units.
One byte consists of 8 bits, and since computers deal with ones and zeros, which means that they deal with math of base two instead of decimals (math of base ten), all increments in data storage units have to equate to the power of two, rather than the power of ten, like we all are used to. Consequently, one kilobyte (KB) consists of 1,024 bytes or 210, and not 103 as you probably expected.
Now, let's see some real-world examples:
- 1 hour of social network page scrolling will consume around 120 MB of data.
- 1 hour of streaming music will consume about 150 MB of data.
- 1 hour of watching full HD YouTube videos will consume approximately 1,500 MB (or 1.5 GB) of data.
- 1 hour of high-definition streaming on Netflix will consume more or less 3,000 MB (or 3 GB) of data.
- 1 hour of Skype calls with five or six colleagues will consume up to 4,000 MB (or 4 GB) of data.
Another example is that the entire original Super Mario Bros game consists of 32 KB, which is roughly 0.03 MB! There is an unbalanced proportion between the game's size, which is incredibly small, and the amount of happiness it brought people of any age from all over the world!
Now that we've got some understanding of the measuring units, let's talk about something more fun: data exchanges of the online services we all use, every day. We will also build, later on, a few Power BI charts using the data I am going to show you right now. We will create those charts to get some familiarity with this powerful business intelligence tool and discover some of its basic commands and features.
Have you ever wondered how much data we generate every 60 seconds?
The amount of data we generate is insane. Think, for example, of a quite simple thing that we do over and over every day: Google searches. We even invented a new verb for it, "googling"! It has also become synonymous with the internet. Anyway, we all are curious about everything all the time. People like me and you are always thirsty for information, and that's why we use Google all day long. The famous search engine is so dominant in the search engine market because it provides free access to information in a blink of an eye. But, of course, Google didn't become a giant overnight. Back in the days before Google or Facebook, the absolute king of the internet was named Yahoo, a tech company founded in 1994 that, today, still, handles 5% of web searches. A few years later, in 1999, the company was worth $125 billion, but unfortunately, the giant made some wrong moves and started to lose users. Probably the most significant wrong move was to refuse to acquire Google. Yes, in case you didn't know, Google's Larry Page and Sergey Brin approached the Yahoo CEO in 1998 and asked for the small amount of $1 million. You can deduce the end of the story; **Yahoo refused. But this wasn't the only mistake made by Yahoo. Yahoo declined to buy Google again in 2002 for an amount of $5 billion, and in 2008 refused to be acquired by Microsoft for $44.6 billion, but that is another story. Anyhow, Google today has passed $1 trillion in market value, which is astonishing.
Back to the data! At Google, nowadays, they process something like 5.4 billion searches per day! Breaking it down, you get 3.8 million searches per minute. Insane. The giant search engine now dominates the market with almost 93% of total internet searches.
But this is not the only crazy number of online services we are going to talk about. You might be wondering about LinkedIn, Amazon, Netflix, YouTube, Instagram, and so on. Earlier, I told you that we would be talking about what happens every 60 seconds. Well, if you go back a few lines, you'll see a sign with two asterisks right next to the phrase **Yahoo refused. I counted how long it takes to read the text from the "**Yahoo refused." to now, and guess what, it takes more or less 60 seconds to read those lines!
Here, I have listed a few things that happened in that timeframe:
- Amazon shipped between 6,000 and 7,000 packages.
- Users scrolled more or less 350,000 times on Instagram.
- 55,000 users, approximately, logged on to Microsoft Teams.
- Netflix users streamed about 100,000 hours of video.
- 2,000 new Reddit comments were created.
- LinkedIn gained 120 new professionals.
- 4,500,000 videos were watched on YouTube.
Figure 1.8 – Data everywhere!
These are just a few of the things that happen every 60 seconds on the internet, and even if it seems overwhelming, we, as humankind, just started the ladder of digitization. During the last 10 to 20 years, thanks to the spread of the internet, we saw a rapid evolution of the business landscape. In this short period, the digitization era has left us with a very eventful time.
In the next section, we will talk about a less technical yet quite interesting subject: hybrid jobs!
Learning about hybrid jobs
Today, because of the large amounts of data we produce and collect, companies from every industry are looking for new types of employees. Nowadays, an increasing number of professionals are developing IT skills that make them the perfect candidates for many companies that have invested in digital transformation. This interesting factor occurs in any field: financial, medical, engineering, hospitality, and so on.
I would like you to understand this concept because if you would like to apply for a new job, you probably would have a better chance if you have learned some coding or data science skills! This is why. People working in HR call them hybrid jobs. According to Burning Glass Technologies, a company that specializes in analyzing trends, skills demand, and job growth, one of every eight job postings asks for candidates with hybrid skills, no matter the field.
Employers indeed are requesting coding and data analysis skills, other than a degree in their business area. Here, we are talking about a mix of skills from different domains. For example, marketers rely on big data or data science abilities to coordinate their advertisement campaigns. At the same time, increasing numbers of architects and engineers need to work with data systems and robotics. Take the engineering field as another example; it is a common practice that students take computer science classes. So, we see a significant increase in the computer science skills demand from employers in various industries and sectors.

Figure 1.9 – A woman with hybrid skills!
Some of those hybrid jobs are as follows:
- Data scientists
- Business intelligence managers
- Virtual reality architects
- Visual data scientists
- Web analytics managers
These roles are just a few among all of the new jobs that our digital economy is demanding. We also, as professionals in the AEC industry, have seen the spread of new roles in the last few years, such as design technology professionals, computational design specialists, developers with an architectural or engineering background, and so on.
Anyhow, we can say without any doubt that every company, no matter what the field is, is becoming little by little closer to a tech company. That's the reason why we will have to adapt to this change, and we all have to learn computer science by learning the logic of how software is created. You can't merely learn how to use a few pieces of software and use them your whole life! In our ever-changing world, we should learn the logic underneath the tools, and not the tools themselves.
Machines and algorithms will be our next best friends/colleagues! Nevertheless, we, as professionals in the AEC industry, have to do the same as other colleagues in other sectors are already doing. We're doing nothing special here. We need to increase our knowledge and work hard to overcome our next challenges, which will let us better understand, manage, and analyze our processes and model's data!
We just learned what hybrid jobs are and why IT and computer science skills are becoming more and more critical for all types of businesses. If you aren't yet, get ready to acquire new hybrid skills in the upcoming months or years. And, by the way, by the end of the book, you'll already have started that path. So, stick with me and follow the book without skipping any parts! You know the saying, "No pain, no gain!"
Summary
In this chapter, we have learned why every company is moving toward a data-driven business model. Then, we discussed how series of ones and zeros create digital content. Also, we started to explore the three types of digital data, unstructured, semi-structured, and structured, and how the DIKW pyramid helps us to organize our data into useful information. Next, we discovered how much data we produce every 60 seconds, and it is unbelievable that those numbers keep growing every month! Finally, we discussed how data science skills have become vital for so-called hybrid jobs.
In the next chapter, we are going to deep dive into the world of data centers: when the first data center came to be, what they are now, and why are they so important for businesses and organizations worldwide. Then we will talk about two of the most significant data center projects, and finally, we will take a first look at Power BI's core functionalities.
