


Big data has clearly got everybody's attention, from academia to industry. Conservative estimates put the market of big data technologies to nearly 2 billion dollars in 2013. Research Company IDC expects this market to be in excess of 25 billion dollars by 2016. Even more interestingly, GE executives Peter Evans and Marco Annunziata believe that big data will influence over 10 trillion dollars worth of economic benefits to the global economy in less than 2 decades. Every major corporation with interest in this space is setting up multi-million dollar research initiatives with leading institutes and think-tanks.
Big data is radically transforming the way businesses are designed and operate. Now, your business can make sense of a huge volume, velocity, variety, variability of data, and effectively visualize the analysis of this data. Now, you do not have to spend hundreds of millions of dollars or years to get these types of capabilities. Technologies that enable organizations to make sense of big data are significantly reducing the entry barriers for such investments. These new capabilities are fundamentally altering many management practices and impacting all types of companies—small and big, traditional, and new age. Now, start-up companies can offer new insights into customer analytics to large retailers and become multi-million dollar organizations in little or no time. Similarly, traditional large manufacturing companies are focusing on more profitable service segments of their businesses derived from new insights around data and analytics.
Companies today are struggling with figuring out how to take the capabilities and possibilities from one-off initiatives that impact one or some parts of the business to broader usage. Executives are not questioning the value of masses of data; the question in their minds today is how to use it well and amplify its effects. They key lies in weaving big data into the strategic framework of your organization.
Often, organizational strategies evolve around entrenched perceptions; trends identified through sampling and organizational aspirations. Past performances and future prospects play a key role in this process. Organizations consider macro-economic environments, market trends, industry growth, competitive actions, core capabilities and adjacencies, and finally shareholder expectations in building their business strategy. In the past, such an approach has been able to keep pace with the evolution of various forces that have an impact on an organization's performance. Today, the rate of innovation, interventions, and insights around their current and future impact outpaces many other factors that impact the long-term or even medium-term sustainability of an organization's growth and profitability. Businesses need agility to respond to such challenges. Big companies sometimes get pulled back by their size and momentum; smaller companies sometimes lack the resources and reach to invest in response.
Building strategies around big data analytics is about finding value in data, and it is about enabling value through data. The following are seven simple steps that will help you do this:
Understanding the changing landscape
Identifying the strategic implications
Spotting and simulating the growing influences
Integrating new possibilities into planning
Developing strategies
Aligning existing initiatives
Cascading your strategy
Throughout this chapter, I'll take you through each stage to ensure that your big data strategy is closely tied to your organization's strategy, which in turn will ensure that you are able to get the most from your data.
However, before we proceed further, it's a good idea to compile a list of various sources of revenue or various areas of key operations for your organization in a business catalog. For each of the revenue sources or operation areas, briefly capture how the company makes money from them and what the fundamental components of their operation are. This acts as a good compass for you to put some of the upcoming discussions in this and future chapters into context. It could be in a very simple manner as follows:
|
Business Catalog |
Remarks |
|---|---|
|
Product sales through direct sales |
The company makes money through strategic pricing applied to differentiated solutions for different customer segments. |
|
Product sales through channel partners |
The company makes money through commission. Effective channel development and management (making it easy to do business with channel partners), marketing promotions to attract mass market customers, and achieving high volume turnovers is integral to making more money. |
|
Technical maintenance services for directly sold products/solutions |
The company makes money through higher returns in replacement parts, value added services, and labor hours. |
|
Design services |
The company makes money by helping customers design their implementation of your company's products, and services that they would normally outsource to a third party. |
The first step towards interlacing big data analytics into your organization's strategic framework is to understand how big data is changing the backdrop in which your company operates. This requires a shift in mindset. We are attuned to think of a changing landscape in terms of actions and outcomes. We have been trained that knowledge is power; we have been taught that history never repeats itself. However, these beliefs are no longer considered as absolute truths. Traditional strategic analysis techniques relied heavily on causality. Our core competencies revolved around what we can do, what we are good at, and what our reach is. Capabilities around what we know, what more we can find out, how we can connect the dots around such information, and how we can use these insights to change the business have not been generally considered core competencies. That is, until the advent of big data.
Imagine you have a service that helps travelers book hotel rooms and rent cars. You will have systems and capabilities to understand inventory movement in hotels in your network, possibly in other networks as well. You will also have ways to auction new bids from your travelers, and it is also likely that you will be able to adapt according to specific events, seasonality, and past data to arrive at price recommendations for both hotels as well as travelers.
Now, imagine if someone were able to modulate your hotel room pricing strategy with changes in plane ticket booking data. This could change the dynamics completely and give that person more opportunities for early profitable pricing and increased customer traffic.
In another example, consider yourself as the manufacturer of household or light commercial electronics goods, say, an industrial grade water purifier. You are probably using lot of data based on:
Customer segmentation: How your customers are categorized into various demographic groups with different buying patterns
Pricing strategies: How you sell your products at different price points for different markets or different sales channels
Component or finished product sourcing: Where you buy things that become part of your products
Inventory levels: What kind of stock you hold at different stages and locations of your manufacturing or distribution processes
Quality improvements: What new features you have added to your product to address customer needs or expectations that have not been met
You are also likely to have a lot of data around parts replacement and warranties, which you probably use for part stocking and pricing types of decisions. Imagine if somebody could simulate your parts' usage data, maintenance of data on your equipment, and how your customers actually use your equipment. Precisely how you make money through maintenance programs and part sales is captured in this data. This data is not proprietary to you; your customers or their maintenance service contractors most likely own the data and somebody could just get it from them or buy it. They can now come up with very innovative maintenance programs for your equipment and take a substantial portion of your business away; you might be reduced to only a provider of proprietary parts.
As an illustration of a practical scenario for the preceding example, in large urban cities of emerging markets where potable water is a big issue, your company has decided to offer the base water purifier unit to households at a lesser margin, thereby trying to make the entry point attractive for customers. As a strategy, you recover your lost margin through replacements of purification candles, which frequently go bad. There is most likely nothing very proprietary or unique about the candle and changing those requires only basic technical skills. So, any small local entrepreneur can also take away your business, thus challenging your profits.
In both cases, you could be that "someone" if you understand the changing landscape stimulated by the power of big data.
To understand the changing landscape in the context of big data, there are six questions you need to consider:
Do you know all the data you have?
Do you understand all the data you have?
Who else has similar data?
What data are you using and how?
How are others using similar data?
What data from other sources do you use in your business?
By answering these questions, you should go beyond data that is easily captured; in fact, you should not even consider whether you capture these data elements today. Your compass in this exercise should be whether somebody or a system in your organization knows about these various data elements in any form—structured, unstructured, or streaming. These questions and the others that follow in this chapter might seem a bit tactical and low level compared to normal high-level strategic considerations, but because Big Data Analytics is so new, to be successful it is critical to build a solid foundation of understanding, with a lot of detail at a lower level to enable you to build the strategic framework. You need to avoid simply extrapolating general concepts and then basking in the luxury of making broad assumptions.
Once you have answered these questions, you need to compile the long list into an information catalog. Do not get distracted by the desire to classify the information elements into logical clusters at this point. Simply make the list and move on to the next step. In the following discussion, whenever we refer to information or data elements, we will consider all of what is available and what's possible, irrespective of ownership, collection, or storage.
To understand strategic implications, you first need to understand the current role of data in your business. In order to help your understanding, you need to explore answers to four key questions:
How many of the data elements are currently being used to influence your existing revenue and profit streams? Today, most of your considerations may be usual financial data related to P&L or balance sheet items.
What is the contribution of your organization's data elements in the revenue and profit streams?
What capabilities and business models do you have today to use the data?
What capabilities and business models do you need to build or acquire to use the data?
Answers to these questions will lead you to areas that may be blind spots for your organization today in terms of both opportunities and threats. For example, in the previous example of the water purifier manufacturer, if you do not use maintenance records as a consideration in your revenue strategy, the implication is that you are possibly not exploiting a new maintenance model or replacement part sales opportunities, or even that somebody else might start doing it.
Let us consider another example. Anita has been banking with one particular bank for over 16 years and is extremely satisfied with their services. For all these years, she held salaried jobs and (thankfully) her salary grew several times. In addition to savings accounts, she has engaged in other types of transactions with this bank—all experiences were very satisfactory. However, recently she realized that this bank has handled less than 20 percent of her money. The bank did depute competent and nice managers to attract her business, and provided impeccable customer service to build credibility. They missed out on tracking her over the past 16 years across their various divisions to meet her needs of the hour. They had all her data, but used a quarterly savings account balance to pursue opportunities with her. This is another example of failing to understand strategic implications of data and analytics.
The problem is not the availability of data; it is appreciation of the value of data and what it can do for the business. Comprehending the strategic implications will lead you to conclusions that are not explicitly stated or obvious at a casual glance.
Today, data is impacting your business more than you may realize. Before you go further into developing organizational strategies around big data, you need to understand the evolving influences of data and analytics on your business. You start this process by simulating the use of data by your organization in its current state, then understanding what your competitors are doing in this space, and finally understanding the correlation between different data points that impact your business.
You need to appreciate how the trajectory of your business has been influenced so far by the data elements you have used. You need to develop a historical perspective of this evolution process. For example, imagine you are a multi-purpose retailer such as a major grocery chain. Decades back, you would have used point-of-sale customer-buying data primarily to take an inventory and to make supply chain decisions. Over a period of time, you probably would have started using customer purchase data to understand affinities between items brought and how seasonality influences those decisions. Then, you most likely graduated to profiling customers on their social and economic background and understanding their buying behavior in those contexts. Today, you might even be using advanced customer analytics to proactively stock and push new or more items. You have graduated from using the same basic data to being more efficient and driving greater revenues and improving loyalty in a commoditized environment by giving a personalized experience to customers.
Next, you need to become familiar with how data-driven actions taken by others are influencing the course of your business and strategies. In the same continuing example, a start-up can use similar data obtained through cleverly designed surveys to become a recommendation channel and subsequently use this knowledge to drive collective bargains with you as a retailer, further challenging your current thin margins.
For this exercise, you need to scan competitors from your industry and all possible adjacencies to understand how they are using data to drive value in their business or even to change their business in terms of new ways of attracting revenue and customers, or possibly to make operations more profitable. The recommendation engine made extremely popular by Amazon is now replicated in many different industries.
Finally, to identify new possibilities, you need to gain new insights through the correlation of previously unpaired data elements. For example, as the large retailer being discussed, you have data on how much time your customers are spending in your store and how much they are spending in the snacks counter. Is there any correlation between the two? Assume that every customer who stays in your store for over two hours makes a purchase at the snacks counter. This creates additional business for you. If your snack counter is run by a franchisee, you can command higher rent by facilitating more traffic and purchases at the snack counter. You have found that 47 percent of your customers stay an average of 106 minutes per visit. Now that you know this, can you create incentives for your customers to stay for two hours or longer so that the likelihood of their visit to the snack counter increases? For example, you could engage your customers longer with a cooking show demonstration or a new product demonstration. With the right pairing of data and new insights derived from them, you can explore additional sources of revenue for your business.
By following the steps in the preceding section, you will be able to identify "white spaces" in your business or "blue ocean markets." These lead to (hopefully many) new possibilities. You need to take them through a high level vetting process with your business leaders to ascertain the validity of pursuing them. The number of possibilities open to you is not necessarily important; it is more important that they have a high strategic impact for your business. The journey into big data can potentially bring obscure ideas to the forefront, which can seem very attractive at first glance. You need to consider everything and then make a move based on organizational appetite and competitive threats.
Note
Tip
Novelty is difficult. It is rather challenging to integrate new possibilities into your strategic business planning. One effective technique for this effort is to transport your current world problems to a different world and solve the problem in the new world using data and technology. Then, bring back the solution to your current world and apply it. Following this, develop a plan to scale up the solution in your current world.
Strategy is all about where to play and how to win. So far, we have discussed a bit about both. Different companies follow different processes and use different frameworks to develop their strategies. Companies adopt and adapt these approaches to meet their specific context and comfort. Big data analytics should never force you to abandon your current practices, but it should help augment them. There are two techniques that will assist you in this—gather as much data as possible and keep asking what kind of metrics or insights would you like to see out of the data. Let us look at some models.
Kaplan and Norton developed the renowned and much adopted Strategy Map and Balanced Score Card tools around the four seminal influences of financial perspective, customer perspective, internal perspective, and learning and growth perspective. While the Strategy Map translates and communicates the strategy for mass consumption, the Balanced Score Card approach provides the mechanism to cascade, deploy, and monitor the implementation of the strategy. These tools help executives educate the organization about the value creation process and its impact.
In creating the strategy map, Kaplan and Norton recommend keeping in mind the following different perspectives:
Financial Perspective: This perspective is based on the creation of long-term shareholder value
Customer Perspective: This perspective is based on clearly articulating the customer value proposition
Internal Perspective: This perspective is based on improving processes around operations, customer management, innovation, regulatory, safety, community engagement, and other such areas
Learning and Growth Perspective: This perspective is based on improving the talent pool, information systems, and organizational vigor
All of these considerations are already based on data; you can further strengthen the process by considering the complete spectrum. Let's reflect on a few examples:
You have an initiative around strategic pricing to improve your profitability. You are designing pricing strategies as part of this initiative around customer segmentation and the significance of your products and services to your customers. You will also look at some historical pricing data from your company, and may even stretch your research scope to the data from your competitors (if available) or get creative in exploring similar strategies adopted by non-adjacent suppliers to the same customer. To validate your theories, you will most likely run some experiments.
Now, how about you build a model that incorporates your customer's profitability, competitive pressures, market trends, and the share of your products and services into their revenue/profit delivery cycles? Most of this data is available today and may not be easy to access or analyze. This will most likely be a combination of unstructured and streaming data. But if you can build a comprehensive model that big data analytics can enable you to do, you can have a very robust pricing strategy that will significantly benefit your business. If your company makes an 8 percent return on sales, then a 1 percent pricing improvement leads to a 12.5 percent improvement on your current shareholder returns.
Let's consider another example from a different domain:
In most organizations, the HR department maintains an inventory of skills its employees possess. The supervisors of the employees will usually validate those skills; sometimes tests are conducted to assess the skill levels. Most of the skills that are recorded are oriented towards what what employees need to do their job. Employees are learning new skills, getting new experiences, and possibly have expertise in non-job related fields, which might be of use for the company. These snippets of information will usually not be stored in a traditional skill inventory system; definitely not on anywhere close to a real-time basis. However, if we leverage the social media aspects of a company and the data captured through in-process activities, we will get insights into the new nuggets of information just described. So now you can enrich your traditional skill inventory with new learning enabled by big data.
Therefore, while developing strategies, there are two major questions you need to keep in mind:
Have you considered all the possible data?
Does your improved understanding of all data bring any new possibilities?
Regardless of which strategy framework you currently use, these questions are universally useful.
Force Field Analysis is another technique many strategy experts use. This can be a very practical and easy method, especially when applied to create a growth roadmap using big data.
In Force Field Analysis, you have essentially two states and two forces:
The two states are:
Current state: This represents the current state of your business in terms of market position, profitability, revenue, or any other parameter on which you want to do a comparison
Future state: This represents the future desired state of your business on the same terms of comparison as current state analysis
The two forces are:
Enabling forces: These are the driving forces that help you achieve your goals of moving from current to future state
Restraining forces: These are the limiting forces that resist your efforts to achieve your desired future state
We start Force Field Analysis by drawing two parallel lines that represent a current state and desired state going from left to right to show progression. Then, we include all the enabling forces on the left-hand side of the current state. Then we put all the restraining forces to the right of the current state line. To make it more interesting, you can actually change the length and thickness of the arrows that represent the various forces relative to their impact on enabling or restraining. This form of representation allows us to visually understand at a glance what factors are at play to further or slow down our strategy. This is a good starting point to identify strategic initiatives that will enable us to overcome the challenges.
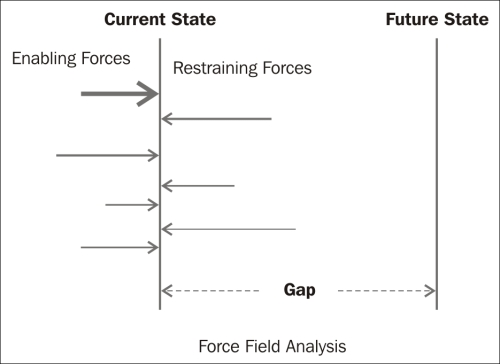
Please remember that you may not always be able to eliminate all the restraining forces. Once you have the preceding diagram for your business, you need to work on making some of the enabling forces more potent and try reducing the potency of some of the restraining forces so that you are able to reduce the net gap.
If you replace forces with data in the preceding diagram, and apply the same action decision principles, you can draw a roadmap of how to use data from your existing data repository to reach your desired state of business.

Aligning existing big data analytics initiatives in organizations is extremely critical. Parallel initiatives draw upon a lot of valuable organizational resources, creating stress for other projects. Moreover, executives and shareholders can sometimes get disillusioned and confused by the plethora of initiatives trying to do somewhat similar things, and in the process can become unsure about whether the initiatives will deliver the desired results. At an extreme, they might even consider big data analytics as yet another fad and wait for it to play out before taking any decisive action.
There is no magic bullet that can solve this problem. Every company is trying to figure things out in a manner suitable to their context and culture. If there are many initiatives running in your organization, it is a good thing—there are more people who are exposed to the power of big data and they are trying to solve many business problems using these capabilities. If they begin to collaborate, they can all learn from each other in using the technology and analytics better. They can also benefit from the new insights that interplay between the various initiatives present. This way, you may be able to reach answers to your business problems faster.
It is also critical to get some insights from data and analytics sooner rather than later. This helps to win the confidence of executives in the program; it also helps to continuously refine the results and insights.
You can take a very disciplined and collaborative approach towards aligning various big data initiatives in your company:
Make a list of all initiatives in the company that use data as the primary tool for a business outcome. These initiatives may not necessarily bear the big data tag, but you need to qualify whether the projects are using at least a high volume or high velocity or high variety data in its quest.
Identify the strategic intent of these projects. Find out what business outcome these initiatives are trying to influence.
Understand what is common and what is different between the approaches and outcomes of the different initiatives.
Classify initiatives into similar clusters of strategic intents of business outcomes.
Investigate whether the efforts of one initiative in a cluster can improve the performance of another initiative.
Differentiate activities around solving infrastructure issues and delivering user outcomes. The differences will usually manifest themselves in the different approaches. This step allows you to take another pass at spotting the differences and commonalities.
Find out how much investment each initiative is going to require and how long they are expected to last. You need to answer this question in the context of infrastructure development and outcome delivery.
Prioritize different initiatives, first based on expected benefits, then on required time, and finally on the basis of planned investments.
Create a map for most optimal initiatives geared towards achieving the strategic intent of the organization.
Secure executive buy-in for your strategic roadmap of the collated initiatives. When competing groups reach out to the executive team for their sponsorship, they need to support your roadmap and point of view.
Communicate your detailed research and the resulting map to the project teams. This will help them understand your strategic intent and align their interests and efforts towards broader and more impactful organizational goals.
Reallocate resources and investments based on this alignment. Establish a robust and fair governance process around the investments. We will talk more about this topic in Chapter 6, Managing the Money: Investment, Monetization and Performance Management when we talk about investments and financial management.
Review the entire process every six months at the latest. People will find new use cases for big data. Technical and financial barriers for pursuing such use cases are low. The proliferation of further initiatives is unavoidable and undesirable, so aligning them quickly is beneficial for your organization.
All the existing projects in your organization have most likely been initiated by some motivated individuals who see value in applying Big Data Analytics to solve business problems. In many cases, such projects may not have executive sponsorship and the project leader and team members are pursuing these as their labor of love to prove something new to the broader organization. Big data is often known to bring out entrepreneurial traits in people. Remember, people's passion and pain is associated with each of these projects. We do not want to discourage such behavior, but our objective is to channel their efforts and energies. The alignment exercise needs to be handled with care and compassion. We want the big data ecosystem in the company not only viable and valuable, but also vibrant.
After you have developed your strategy and harmonized all existing initiatives around it, now you need to communicate the strategy to the rest of the organization. You want the various teams in your business to align with that strategy and build their plans, goals, and execution capabilities around it. This process is called strategic cascade. It is about more than simple communication. A strategy cascade involves breaking down the strategy into context relevant for the various teams and developing their business plan and monitoring mechanisms around it.
A good strategic cascade will go into some detail and should be done for each of the individual initiatives that are triggered by the various strategies. To effectively cascade your big data strategies, you need to compose, clarify, and communicate your strategy framework to the entire organization in the context of data and its implications. Big data is pervasive and the strategy you develop and implement will have a bearing on everybody in the company. Big data is also for everybody; whether your company is big or small, you could equally benefit from big data. You need to translate the different facets of your big data strategy and the resulting initiatives into something that the entire organization will understand. Big data is an evolving discipline. The more people you can get on board your big data journey, the more hands you have to exploit the new emerging capabilities. You will also have a bigger pool of people who can see new value in data and create new value from data. Lofty and vague explanations can be confusing and interpreted differently. While designing your cascade plans, it is crucial to specify micro level details so that people understand clearly and nothing is left to speculation.
A normal strategic cascade follows a systematic process. The following diagram is a representation used when developing the cascade, and many organizations use formats similar to this:
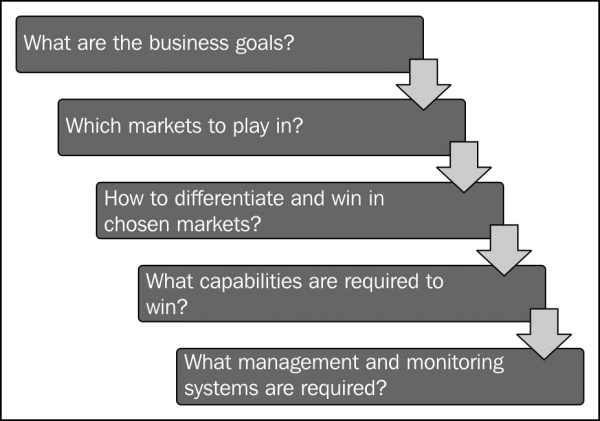
Let's consider an example of how to develop a strategy cascade. Imagine you are a manufacturer of capital intensive equipment that is used by generic hospital and schools—say X-ray machines. In most cases, you have maintenance contracts with your customers. As part of these contracts, you are responsible for the general upkeep of your equipment and provide replacement parts at discounted rates. After careful and detailed studies, you have arrived at the conclusion that using Big Data Analytics, you can significantly grow your service business, which gives you good profits and also helps you secure repeat business. Let's now develop a strategy cascade using the methodology outlined in the preceding figure:
What are the business goals?
Increase service revenue by 30 percent in 3 years
Which markets can we play in?
K-12 schools market in tier-1 and tier-2 cities
The reason for selecting this market is that in such locations, customers have limited choices and they are difficult for your traditional competitors to cover. In each school, you may only have 1 machine. However, when you add up all the schools in a state you are now talking very big numbers. Such machines are also sold to hospitals at a good profit margin. However, as part of your strategy you choose to ignore the more seemingly profitable hospital segment for this initiative because you have found they have more internal capabilities to service your equipment and are less reliant on you other than for parts.
How to differentiate between and win in the chosen markets?
Provide predictive analytics on how to increase the equipment life and reduce operating costs, and offer other advisory services around student health by enabling a larger community of health experts from around the nation.
The reason you choose this differentiation approach is that your small time local entrepreneurs who can provide regular routine inspection and maintenance services will find it difficult to extend their offering portfolio.
What capabilities are required to win?
Remotely connecting to equipment very inexpensively
Store and analyze the performance data that comes from those X-ray machines (not the X-rays themselves as privacy issues may be involved)
Service team or channel that can respond to the needs of customers
A team of statisticians, engineers, and other experts who can continuously keep doing more experimental analysis
A team of expert doctors who can be made available using technology to help your schools
What management and monitoring systems are required?
New business models, operating disciplines, and monitoring and review mechanisms to ensure business goals are met
Many of these steps may seem similar to traditional IT initiatives; however, when we take into account the huge volumes and variety of data, and consider both structured and unstructured data, this initiative becomes a big data problem.
The simplified strategy cascade for the preceding situation can be represented in the following manner.

The above format is a tool that you can use to communicate and cascade your strategy to the rest of the business. If you choose a different format, make sure it is visual and easy to follow. Once you have developed your strategy cascade, it is clear to your team and the rest of the organization which markets are you vying for, how you plan to differentiate your business to win more in those markets, what kind of tools and capabilities you need to differentiate and win, and how you are going to monitor and manage the initiatives around growth. Your team and the rest of the business are now aligned with your plans and all geared up to go and win.
In this chapter, we worked on several topics that will help you move ahead in your journey of big data analytics:
We discussed the strategic implications put forward by big data analytics
We built a Business Catalog that lists various sources of revenue for your business and key areas of operations
We identified how big data analytics is influencing our business and how those influences grow over a period of time
We developed an Information Catalog for your business
We worked on integrating the new possibilities brought forward by big data analytics into our business
We developed organizational strategies around big data analytics
We aligned various existing big data analytics initiatives to drive better synergies and achieve exponential results
Finally, we created a framework on how to cascade the strategic value and intent of big data analytics across your organization
You are now armed with the power to understand what big data analytics can do for your business, and where and how it can help you win in the market place. Use big data analytics as part of your strategy to make things happen.
Browsing the net, quite some time back, I came across a very profound quote whose author is anonymous:
"There are three kinds of companies, those that make things happen, those that watch things happen, and those that wonder what happened."
In the next chapter, we will work on building an opportunity landscape for your business enabled by the capabilities of big data analytics. In doing so, we will work on how to take a structured approach in identifying and keep adding to your opportunity portfolio.


