Download code from GitHub
R is a relatively recent multi-purpose statistical language that originates from the older language S. R contains a core set of packages that includes some of the most common statistical tests and some data mining algorithms. One of the most important strengths of R is the degree to which its functionalities can be extended by installing packages made by users from the community. These packages can be installed directly from R, thereby making the process very comfortable. The Comprehensive R Archive Network (CRAN), which is available at http://cran.r-project.org, is a repository of packages, R sources, and R binaries (installers). It also contains the manuals for the packages. There are currently more than 4,500 available packages for R, and more are coming up regularly. Further, what is also great is that everything is free.
The topics covered in this chapter are:
Installation of R
R graphic user interface, including a description of the different menus
Definition of packages and how to install and load them
Along the way we will also discover parts of the syntax of R
Among almost 50 competitors, R is the most widely used tool for predictive modeling, together with RapidMiner, according to yearly software polls from KDnuggets (most recently available at http://www.kdnuggets.com/2015/05/poll-r-rapidminer-python-big-data-spark.html). Its broad use and the extent to which it is extendable make it an essential software package for data scientists. Competitors notably include Python, Weka, and Knime.
This book is intended for people who are familiar with R. This doesn't mean that people who do not have such a background cannot learn predictive analytics by using this book. It just means that they will require more time to use this book effectively, and might need to consult the basic R documentation along the way. With this extended readership in mind, we will just cover a few of the basics in this chapter while we set up R for predictive analytics. The writing style will be as accessible as possible. If you have trouble following through the first chapter, we suggest you first read a book on R basics before pursuing the following chapters, because the effort you will need to invest to understand and practice the content of this book will keep increasing from Chapter 2, Visualizing and Manipulating Data Using R. Unlike other chapters, this chapter explains basic information. Users who are more familiar with R are invited to skip to Chapter 2, Visualizing and Manipulating Data Using R or Chapter 3, Data Visualization with Lattice.
If this is not yet done, download the installer for your operating system on CRAN. Launch the installer and follow the specific instructions for your operating system. We will not examine these here as they are straightforward; just follow the instructions on screen. The following pages offer a quick reminder or a basic introduction to the interface in R. Here are the addresses where you can find the installers for each OS:
For Windows: http://cran.r-project.org/bin/windows/
For Mac OS X: http://cran.r-project.org/bin/macosx/
For Linux: http://cran.r-project.org/bin/linux/
These links also serve as pointers to R under MacOS X and Linux, which are not fully described here.
The following snapshot represents the default window when starting R. The default window is highly similar across platforms, which is why it is not necessary to display all screenshots here. More importantly, most of what is covered will apply to any recent build of R. Advanced readers might be interested in using a more sophisticated development tool such as RStudio available at http://www.rstudio.com/. Because of space limitations, we will not describe it here.
The encompassing window displayed in the picture below, R graphic user interface (RGui), contains a basic graphic user interface. You can see the menu bar on the top of the window. We will look at some of its elements more closely in the following screenshot:

A snapshot of the RGUI window
When the R console window is active, there are seven accessible menus: File, Edit, View, Misc, Packages, Windows, and Help. If you use a platform other than Windows 7, you might notice some differences, but none are important.
Some functions of the File and Misc menus are worth commenting upon briefly. Functions from the Packages menu will be commented upon in the next section. Function is a term that can loosely relate to something the program does, or more specifically, a succession of steps programmatically defined, oftentimes involving an algorithm, and explicitly called by some piece of code. When discussing functions accessed through a menu, we will indicate the name of the menu item. When discussing functions as they appear in code, we will indicate the function name followed by brackets (). Sometimes, a function selectable from the menu corresponds to a single function in code; other times, several lines of code are necessary to accomplish the same thing as the menu function through code.
The File menu contains functions related to file handling. Some useful functions of the File menu are as follows:
Source R code: Opens a dialogue box from which an R script can be selected. This script will be run in the console.
New script: Opens a new window of the R editor, in which R code can be typed or pasted. When this window is active, the menu bar changes.
Open script: Opens a dialogue box from which an R script can be selected. This script will be loaded in a new window of the R editor.
Change dir: Opens a dialogue window where a folder can be selected. This folder will become the working folder for the current session (until changed).
Here are some quick exercises that will help you get acquainted with the File menu. Before this, make sure that you have downloaded and extracted the code for this book from its webpage.
Let's start by changing the working folder to the folder where you extracted this book's code. This can be done using the Change dir function. Simply click on it in the File menu and select the folder you wish to use.
Now, open the R script file called helloworld.R; this can be done using the Source R code function. The file should be listed in the dialogue box. If this is not the case, start by selecting the folder containing the R code again. The file contains the following code:
Tip
Downloading the example code
You can download the example code files from your account at http://www.packtpub.com for all the Packt Publishing books you have purchased. If you purchased this book elsewhere, you can visit http://www.packtpub.com/support and register to have the files e-mailed directly to you.
print("Hello world")This line of code calls the print() function with the argument "Hello world".
Experiment running the first line of R code: select the content of the file, right click on it, and click on Run line or selection.
Alternatively you can simply hit Ctrl + R after having selected the line of code. As you might have guessed, the function returns as an output in the Console window:
[1] "Hello world"
Let's imagine you want to create a new script file that prints Hi again, world when run. This can be done by clicking on New script in the File menu and typing the following:
print("Hi again, world")Now save this file as hiagainworld.R in the working folder. Use the Save function from the File menu of the R editor (not the console).
The Misc menu contains functions that are related to various aspects not otherwise classified as a menu in the RGui. Some useful functions of the Misc menu are as follows:
Stop current computation and Stop all computations: When handling big datasets and computationally exigent algorithms, R may take longer than expected to complete the tasks. If for any reason, the console is needed during this time, the computations can be stopped by using this function.
List objects: Pastes and runs the
ls()function in the console. This outputs the list of objects in the current workspace.List search path: Pastes and runs the
search()function in the console. This outputs the list of accessible packages. We will discuss this feature in the next section.
Try exercising these functions of the Misc menu:
Enter the following code in console:
repeat(a = 1)
This code will cause R to enter an infinite loop because the repeat statement continually runs the assignment a = 1 in the code block, that is, what is contained between the parentheses (). This means that R will become unavailable for further computation. In order to give R some rest, we will now exit this loop by stopping the computation. In order to do this, select Stop current computation from the Misc menu. You can alternatively just press the Esc key to obtain the same result.
After doing the exercise above, get to know which objects are in the current workspace. In order to do this, simply click on List objects. The output should be as follows:
[1] "a"
Each time we create a variable, vector, list, matrix, data frame, or any other object, it will be accessible for the current session and visible using the ls() function.
Let's seize the opportunity to discuss some types of R objects and how to access their components:
We call variable an object containing a single piece of information (such as the
aobject above).A vector is a group of indexed components of the same type (for instance, numbers, factors, and Booleans). Elements of vectors can be accessed using their index number between square brackets,
[ ]. The following will create a vectorbof three components, by using thec()function (for concatenate):b = c(1,2,3)
The second element of vector
bis accessed as follows:b[2]
We call attribute a vector that is related to a measurement across observations in a dataset (for example, the heights of different individuals stored in a vector is an attribute).
A list is a special type of vector that contains other vectors, or even matrices. Not all components of a list need to be of the same type. The following code will create a list called
ccontaining a copy of variableaand vectorb:c = list(a,b)
We use double brackets [[ ]], to access the components of a list. The copy of the
aobject stored in the listcthat we just created can be accessed as follows:c[[1]]
Accessing the first element of the copy of vector
bstored in listccan be done as follows:c[[2]][1]
A matrix can only contain elements of the same type. These are arranged in rows and columns. The following will create a 3 × 2 matrix of numbers (numbers 1 to 6), with odd numbers in the first column.
M = matrix(c(1,2,3,4,5,6), nrow = 3, ncol = 2)
The first row of the matrix can be accessed as follows:
M[1,]
The second column of the matrix can be accessed as follows:
M[,2]
The second element of the first column of the matrix can be accessed as follows:
M[2,1]
A dataframe is a list of vectors that have the same dimensions, analogous to a spreadsheet. The following will create a data frame containing two vectors. The first contains the letters
a,b, andc. The second contains the numbers1,2, and3.f = data.frame(c("a","b","c"),c(1,2,3))The first vector of data frame
fcan be accessed as follows:f[,1]
This actually subsets the entire row of the first vector of the data frame. (Notice we did not have to use the double brackets notation here, but sometimes, this is necessary, depending on how the data frame has been generated.) When dealing with data frames (but not matrices), the comma can be omitted, meaning that the following is equivalent:
f[1]
The first element of the second vector of the data frame
f(the element corresponding to the intersection of the first row and the second column of the data frame) can be accessed as follows:f[1,2]
Subsetting can be more complex. For instance, the following code returns the second and the third rows of the first column of the data frame (note that matrices are subset in a similar manner):
f[2:3,1]
As mentioned earlier, GNU R is a statistical programming language that can be extended by means of packages. Packages contain functions and datasets that allow specific types of analyses to be performed in R. We have seen at the end of the last section that some packages are loaded by default in R. Others are already a part of R. The image below provides a list of the packages that come out of the box with R. This list can very easily be obtained with the following code:
library(lib = .Library)
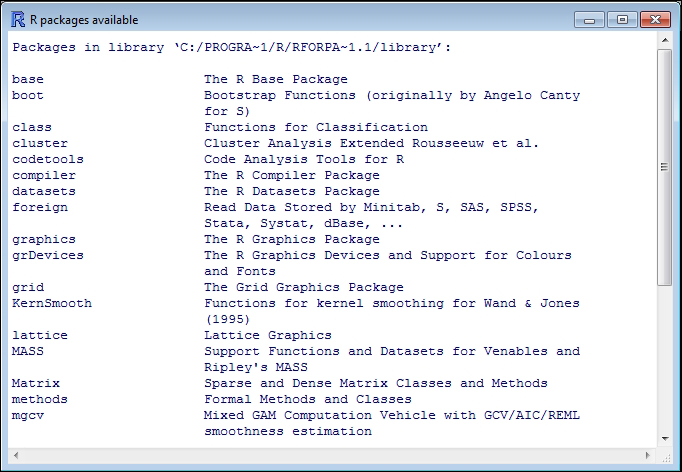
Available packages in base R
Now, let's have a look at which packages are directly accessible, by selecting List search path from the Misc menu. This is what our output looks like:
[1].GlobalEnv package:stats package:graphics
[4] package:grDevices package:utils package:datasets
[7] package:methods Autoloads package:base
Accessible packages start with the prefix package:
Now, let's go a little further and list the content of one of these packages. In order to do this, type the following in the console:
objects(package:stats)
This will list the content of the stats package. The first two lines should look like this:
[1] acf acf2AR add.scope
[4] add1 addmargins aggregate
The content of this book is partly relying on packages that are not part of the basic installation of R. We will therefore need to install packages that we will download from CRAN. The Packages menu contains functions that allow installing and loading packages, as well as the configuration of local and distant repositories. Useful functions of the Packages menu include the following:
Load package: Provides a frontend for the
library()function, which loads a package provided as an argument.Install packages: Allows selecting a package to install. This requires configuring a mirror for CRAN first.
Install package(s) from local zip files: Opens a dialogue box in which a ZIP file containing a package can be selected for installation in R.
Tip
Mirrors are basically different copies of CRAN. In case one mirror is down, the others provide redundancy. You can use any, but the closest to you will generally be faster. We use 0-Cloud here.
We will discuss plotting in the next chapters. Most graphics in this book will be created using functions already available in R. These tools allow producing very accurate and informative graphics, but these are static. Sometimes, you might want to display your results on the web. Also, it sometimes comes in handy to be able to switch rapidly between two plots, for instance, to notice subtle differences. For these reasons, we will also introduce some basics of animation for displaying R plots on web pages. We will not discuss this in detail in this book, but we think it is something you might want a little introduction to.
In order to exercise the use of the menu and install the package required for animating graphics, let's start by installing the animation package. Select the Install package(s) function of the Packages menu, and then, select the animation package from the list. You will have to scroll down a little bit. If R asks you for a mirror, select 0-Cloud or a location next to you, and confirm by clicking OK.
Alternatively, the next line of code will install the required package:
install.packages("animation")Type this line of code in R Console; if you are using the e-book version of this book, copy and paste it in the console.
Alternatively, it is also possible to install packages in R from local files. This is useful in case the machine you are using R on does not have Internet access. To do so, use the Install package(s) from local zip function from the Packages menu and select the ZIP file containing the package you want to install. One easy way to do this is to copy the ZIP file in the working folder prior to attempting to install it. You can also use the following code, provided the package is called package_0.1 and is in the working folder:
install.packages(paste0(getwd(),"/package_0.1.zip")), repos = NULL)
What we have done here deserves a little explanation. We are calling three functions here. By calling install.packages(), we tell R that we want to install a package. The repos attribute is set to NULL, which tells R that we do not want to download the package from a repository but prefer to install the package from a local file instead. The first argument passed to the function is therefore a filename (not a package name on CRAN as in the previous example). As we do not want to type in the whole path to the ZIP file as the first argument (we could have done so), we instead use the paste0()function to concatenate the output of getwd(), which shows the current working folder, and the filename of the ZIP file containing the package (between parentheses). The previous line of code allowed us to introduce the use of string concatenation in R while installing a package.
As R will automatically look in the working folder, we could have typed the following:
install.packages("package_0.1.zip")), repos = NULL)Now that the animation package is installed, let's load it; select Load package from the Package menu. A dialogue box appears and prompts you to select the package that you want to load. If the installation was successful (which is most certainly the case if you didn't notice an error message), the package should be in the displayed list. Select it and confirm by clicking on OK.
Alternatively, you can simply type the following, which will also load the package:
library(animation)
A good thing to do when you load a package is to check that the functions you want to use are functional. For instance, it might be the case that some dependencies need to be installed first, although this should be done automatically when installing the package. In this book, we will use the saveHTML() function to animate some content and generate web pages from the plots. Let's test it with the following code:
1 df=data.frame(c(-3,3),c(3,-3))
2 saveHTML({
3    for (i in 1:20)  {
4       plot(df)
5       df = rbind(df,c(rnorm(1),rnorm(1)))
6    }
7 },
8 img.name = "plot",
9 imgdir = "unif_dir",
10 htmlfile = "test.html",
11 autobrowse = FALSE,
12 title = "Animation test",
13 description = "Testing the animation package for the first time.")
Line 1 creates a data frame of two columns. These are populated with -3 and 3 in the first row and with 3 and -3 in the second row. Lines 2 and 7 to 13 create and configure the animation. Lines 3 to 6 are where the content of the animation is generated. This is the part you might wish to modify to generate your own animations. Here, we plotted the values in the data frame and then added a new row containing random numbers. This code block will be iterated 20 times, as it is part of a for loop (see line 3). The reader is invited to consult an introduction to R if any of this is unclear.
For now, copy and paste the code in the console or type it in. The output should look like this:
animation option 'nmax' changed: 50 --> 20
animation option 'nmax' changed: 20 --> 50
HTML file created at: test.html
If you do not get the message above, first check whether the code that you typed in corresponds exactly to the code provided above. If the code corresponds, repeat steps 1 to 4 of the current section, as something might have gone wrong.
If you got the message above, open the HTML file in your browser. The file is in your working directory. The result should look like the image below. This is a scatter plot, which we will discuss further in the next chapter. The plot starts with the display of two data points, and then, new data points are randomly added. This plot (see below) is only provided as a test. Feel free to adapt the graphical content of the book by using the package (for example, you can simply paste the loops containing graphics in the code above, that is, instead of the for loop here), and of course, use your own data.
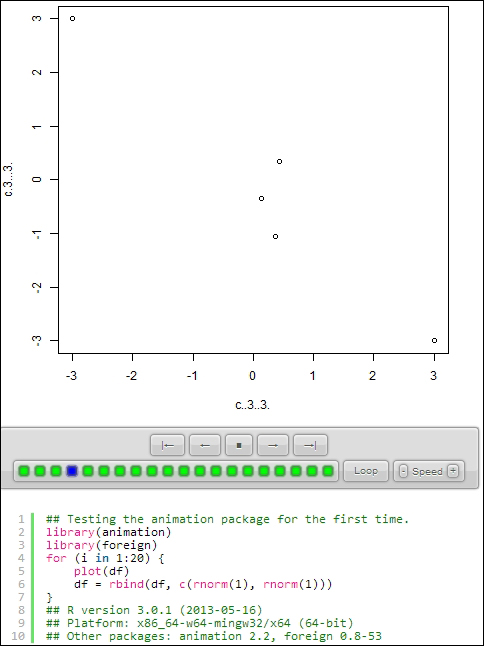
An animation produced using the Animation package
As an exercise in installing and loading packages, please install and load the prob package. When this is done, simply list the contents of the package.
We are sure that you have managed to do this pretty well. Here is how we would have done it. To install a package, we would have used the Install package(s) function in the Package menu. We could also have typed the following code:
install.packages("prob")Alternatively, we would have downloaded the .zip file (currently, prob_0.9-2.zip) from CRAN: http://cran.r-project.org/web/packages/prob/.
Then, we would have used Install package(s) from local zip from the
Packages menu and selected the ZIP file containing the prob package in the dialogue box.
Finally, we would have used the following code instead:
path = "c:\\user\\username\\downloads\\prob_0.9-2.zip" install.packages(path, repos = NULL)
In order to load the package, we would have selected Load package from the Package menu, and chosen the file containing the package in the dialogue box.
This might be counterintuitive, but using code is way easier and more efficient than using the GUI. In order to load the prob package, we could have also simply used the following code:
library(prob)
We would have listed the contents of the package by using the objects() function:
objects(package:prob)
The output lists 43 functions.
We have presented the exercises in the chapter together with their solutions here. The exercises for the next chapters will be part of the Appendix A, Exercises and Solutions, together with their solutions.
In this chapter, we explained where to find the installer for R for all platforms, described the graphic user interface, and examined its menus, particularly how to create and run scripts. We also described how to load packages and discovered some of the basics of the syntax of R. In the next chapter, we will start visualizing data. We will explore this by looking at an example of a roulette game.