


 Download code from GitHub
We will start this chapter with a brief overview of the history of the CTools, and from there we will jump into the general concepts involved when building a dashboard. When building a dashboard, it's not enough to just start developing the dashboard—there is a process to follow and some tasks that you should know about in order to produce better work.
First, you will need to have a good understanding of the requirements, such as who is going to use the dashboard, what is the purpose, what it will be used for, and so on. The next step will be preparing a mock-up or design of the dashboard. It is essential that you understand the best way to display data on the dashboard, and of course there are some techniques that provide a clean and simple dashboard that is very informative and intuitive at the same time. Doing a functional breakdown of the entire dashboard will make a big difference when developing both the back end and front end of the dashboard.
When working in a team, you always need to know the responsibilities of each element of the project. This chapter will touch a little on each of these points. You can see this chapter as a way to demystify what you probably need to know and do before starting the development of the dashboard.
To be able to use the CTools, you need to install them, or if you already have the CTools, you need to learn how to update them, and how to check what version you have. To be able to follow the remaining chapters, we will also provide a brief introduction to the most important technologies and frameworks that the CTools use. This is really important, because for you to become an expert at developing dashboards using the CTools, you will need to know these technologies and frameworks, and have an idea what they are used for. You don't need to know the details about how they work just yet, so this chapter will not give you in-depth knowledge on each one of them.
Understanding these concepts and applying them will make all the difference while developing dashboards, so you should not consider this chapter as optional.
We will cover the following topics:
A brief introduction to the CTools
Considerations when creating the design of a dashboard
The difference between dashboard design and mock-up
Frameworks and libraries used when developing dashboards
External tools to use while developing dashboards
The processes available to install the CTools, and how to install them
The process of developing a dashboard from beginning to end
Interacting with clients and getting their requirements
If you take a look at http://www.webdetails.pt/info/storywithtruth.html, you will find a great infographic with a timeline of the CTools.
Let's briefly talk about the CTools. The development of CTools started in the summer of 2008, just because the opinion of a client was, "That's great, but it's just too ugly." So, then there was a lot of work done on the development of the Community Dashboard Framework (CDF), and in April 2009, the first CTool was adopted by Pentaho and integrated in version 3. But at that time, we needed to build a dashboard by writing all of the code, so in the second half of the same year, the first version of the Community Dashboard Editor (CDE) was released.
As the number of projects started to increase, it would have taken a huge amount of time to prepare a system for these projects. To tackle this issue, the Community Build Framework (CBF) was built. Then came the data layer abstraction, which was also adopted by Pentaho. This leveraged data access and at the same time, allowed to increase the number of accessible data systems.
The CTools became very popular, and the needs and interests of clients to have the best visualizations they could have increased, so a year after the first CTool, CDE started to include its own chart library, Community Charts Components (CCC), which would later also be used in the visualizations produced by Pentaho Analyzer. Just four months after this, a series of CTools training sessions started. In the meantime, due to the needs of many clients, the possibility to export a chart as an image became reality with the Community Graph Generator (CGG).
To increase the speed with which data is delivered to the user, and to improve the user experience when using the dashboards, the Community Distributed Cache (CDC) was released in January 2012. CDC, I believe, has some advantages compared to the two options that are currently provided and supported by Pentaho, particularly when it comes to cache management.
Pedro Alves, during one of his trips for the CTools training sessions, started a new plugin, the Community Data Generator (CDG), which provided the functionality to set some options that made it possible to create dummy data to be used in the dashboards.
Another tool arrived in the summer of 2012, Community Data Validation (CDV), which could be used to validate data and make sure it sends notifications to the right people. However, we are not going to cover this tool, because I believe we can achieve the same results using Pentaho Data Integration (PDI).
I started to work at Webdetails in September 2012, and since then I have seen some other CTools, such as the Community File Repository (CFR), which enables us to make use of files outside the solution repository.
Sometime later, Sparkl, nowadays known as Pentaho App Builder, was presented, which is built on top of the Community Plugin Kickstart (CPK). Pentaho App Builder is a Pentaho plugin used to create Pentaho plugins without the need to know Java code. This made it possible for people who already knew how to use data integration and CDE to build a plugin. Now, there are a lot of plugins available on Pentaho Marketplace that were developed using this great tool.
In the meanwhile, Pentaho Repository Synchronizer (PRS) also arrived, and was created on top of Sparkl. It came out to be used with version 5 of Pentaho so users could avoid the inconvenience of having all their files and folders inside a database and not in the file system, as was the case in the previous versions.
Note
All the CTools have been built as open source projects and are available under Mozilla Public License, Version 2.0, licenses (http://mozilla.org/MPL/2.0/). All the projects are available under the public Git repository through http:/www.github.com/webdetails. Don't be shy to contribute.
Nowadays, most business analytics tools have a way to create dashboards easily, but to this day, I have not encountered another that is capable of having the level of customizations that we can achieve with Pentaho and the CTools. Most business analytics solutions, like Pentaho, provide self-service business intelligence capabilities, but they don't provide capabilities for developers to build really customized dashboards.
I am sure that self-service capabilities are very important nowadays, when users can create their own dashboards/reports easily, but often we want to get some results that we are just not able to get using the self-service capability tools.
Pentaho provides the best of both worlds, the capability to create self-service reports/dashboards, but also to make use of the CTools to build high-customized visualizations and dashboards/reports. However, we should not think of custom and self-service reports as independent from each other, as they can live together and accomplish better results. A great example of this is the Stream Line Data Refinery (SDR) that Pentaho has implemented and made available to their clients. It uses a combination of a custom dashboard and Analyzer, where users are able to request and refine data to a small dataset that is modeled and published as a new data source, usable in the Analyzer to create self-service reports.
This solution solves a challenge in the area of Big Data. Data will be delivered to the end user through the Analyzer, but the request and control of the refinery process is done through a custom page, which is built like a dashboard using the CTools. We should see this custom dashboard as a web page that will make calls to ensure that it is getting a smaller dataset and will publish it. It's possible not only to make the selection, but also to fire some actions and control the status. At the end, it's possible to invoke an Analyzer report that can make use of the published data source. To get more details on this solution and how it works, you can take a look at http://www.pentaho.com/Streamlined-Data-Refinery.
Another example is CTools, used to embed the Analyzer by making use of its API. Highly customizable and embedded interfaces are just another example of where you can use the CTools, but this one is to the detriment of using self-service capabilities. As in the preceding SDR example, I really agree that self-service capabilities are very useful, but not always sufficient.
Dashboard Designer, like the Analyzer and Interactive Reports, is only available in the Enterprise Edition (EE). Dashboard Designer is a tool where, just by dragging-and-dropping, you are able to build a dashboard, create new content for the dashboard, or reuse some of the reports that you have already created. You can start building reports with the Analyzer, Interactive Reports, and Report Designer (after publishing them), and drag them onto a dashboard. This kind of dashboards is not very customizable, so you might need to use a custom dashboard that can be build with some of the CTools.
When using CTools you also have the ability to add filters to the dashboard and specify which elements will react to changes. Sometimes you just need to go further and create really custom reports that Analyzer and other business intelligence platforms are not capable of producing, and that is when most part of the CTools comes in. The CTools provide a way to create custom dashboards by offering very customizable data sources, components, and visualizations. This can lead to astounding dashboards. With them, you are able to create pixel perfect visualizations, without limits. I like to think that the only limit is our imagination.
So, one of the advantages of using the CTools is really to deliver custom dashboards with the visualizations that you need using the standard functionality, or by extending it. CTools dashboards are web pages built with Hypertext Markup Language (HTML), JavaScript, and Cascade Style Sheets (CSS). Like Dashboard Designer (the standard tool from Pentaho for building dashboards), Analyzer, and Interactive Reports, CTools dashboards are web-based and can be rendered in your browser, so there is no need to install a client application. The big difference between Analyzer, Interactive Reports, Dashboard Designer, and CTools dashboards is that the first three are self-service tools that allow you to build reports just by dragging-and-dropping, but you can face some limitations with them. You will not find these limitations when creating dashboards, reports, or web pages with the CTools.
Of course, you may face some difficulties when building some really custom visualizations, but even if you have some difficulties, you will be able to get them done, and that's where this book comes in—helping you to achieve great results. We are all conscious of the fact that it's very important for companies to have platforms that provide tools capable of creating insights and trends in an easy, but also flexible, way.
Let's suppose you want to create a dashboard as a landing page to launch other reports, but also provide Key Performance Indicators (KPIs) that can vary from user to user. You will not be able to do this with self-service tools, but you are able to achieve these goals using the CTools dashboards.
A very common request from final users is to have some kind of visualization that's not available out of the box, and using CTools, we are able to extend the tools to deliver the visualizations that users need and expect, such as a new selector, a map, or even a floor plan if needed.
Multi-tenancy, that is, the ability to serve multiple tenants on a unique server, is becoming very common in analytics, and when using CTools, you have a way to provide a custom interface (images, colors, fonts, and more) or whatever you need to the end user, just by knowing which user is logged in or which group the user belongs to. So based on a custom property that we can customize inside Pentaho, you are able to create the visualizations, dashboards, and reports that you have always dreamed of.
Top business analytics tools need to be able to provide machine learning/data mining/predictive capabilities. Not all are capable of this, but Pentaho is one of the tools that provides these capabilities. Think of the potential when using predictive analytics and custom visualizations to display the results. If we join the capability to mine data with the ability to provide user integrations and produce high custom visualizations, Pentaho and CTools are definitely the right choice. Let's suppose you want to create some simulations based on risk—for this you may provide the user with some interaction, process the risk analysis, and later provide a custom way to give the user the right information in a clearer way. Or, you may want to create a recommendation system that is able to provide this information to your end users with incredible visualizations.
When we look at some of the most successful business/companies over the last few years, such as Google, Facebook, LinkedIn, and Amazon, among others, we can see that they provide custom insights and trends to their clients, customers, and users. These insights are unique and focused on the business, and are getting better and better results every single day. Pentaho and CTools are the tools that allows us to get business further ahead just by using the combination of tools, plugins and capabilities.
For the first time it might not seem so easy to build a custom dashboard, but, if we put some effort in, we can ensure they get end users going in the right direction.
Social media and marketing analysis are also very important areas nowadays; for some cases it may be important to create custom dashboards where each one is different from the others. In those cases, we can always use CTools dashboards.
There are a few steps to take before starting to develop the dashboard itself. First, we need to gather the requirements, then we need to see what the best visualizations are or the best way to display the information, then create a mock-up or dashboard design, next do a breakdown of the components and data sources to use, and later start the development of the dashboard. It's not the purpose of this book to go into detail about all of these points, but we can give you some insights.
One of the first steps, and it's a really important one, is to collect the requirements. Gathering the requirements can be the difference between just doing a project and really delivering a valuable project that can have an impact and push companies forward. The following questions need to be answered:
Who is going to use the dashboard?
When designing a dashboard, we should consider the audience and what they need most. Different people in a company will want different information. Executives might want at-a-glance statistics and trending, whereas a department manager might want to get just an overview of some global results of the company (but will certainly need more details about what he is managing). A technician may need more detailed information.
What expectations do the end users have?
A dashboard is useful and users are happy when we provide the information that they need. It's important to know what expectations users have for the dashboard. This is an open question that may give you some ideas and help you really get to know the goals or the motivations behind wanting the dashboard.
Is this dashboard replacing any other system/reports? Can you get a copy of them?
If there are some reports we can use to get a clearer idea what needs to be displayed and what format the data should be in, that would be great. We could make a copy of a report/dashboard that is already being used, as it's much easier to understand the requirements if we can see the current report, and it may be useful when explaining the advantages of the change.
Should we respect the existing User Interface (UI) guidelines (colors, fonts, layout, elements, and so on)?
Usually, companies already have some UI elements, colors, and so on that are UI-related, and we may use them. This will also make it easier for end users to focus on the real information and not get distracted by colors that are different to what they are used to. Of course, this should not break the rules of creating proper UIs.
What information should be displayed?
A dashboard is a quick way to display KPIs, insights, and trends, so we need to discover what the dashboard should show to the end user. Users need to be able to quickly access the information.
What granularity will the data have and what level should be displayed?
It's also important to understand what the granularity of the data is to be displayed, as the filters will depend on this. The level of detail that we have on the dashboard can dramatically change the way we display each one of the sections or the way they interact with each other. Having details about one KPI, to see why sales are going down, can reduce the time needed to take action. Just by clicking on top of the KPI to get details is one of best ways to go. This can also be important because of performance reasons.
How is the data being filtered? What filters will we need, and for what sections?
What data levels we should be able to filter within the dashboard is also important. Filters are one of the most commonly used components when sifting through data on a dashboard, however any other component can also be used. We can have filters for particular sections of the dashboard, but it is usual to have common filters applied all over the dashboard.
Having a way to filter the time range and frame for the available KPIs, charts, and tables, will give the user valuable information, for instance, providing the ability to filter data for the last 30 days, last seven days, or the last hour.
What are the best visualizations for achieving the intended results?
Just by looking at the dashboard, the user should be able to understand the results without spending too much time on understanding how to read the information. The information displayed should be intuitive to read, and if there is too much data, an update to a section may be required. The value and the quantity of the data will also determine the best visualization.
Will the data be displayed to users with different roles?
Different roles have different responsibilities and access to different levels of information. While many KPIs are shared, different ones may also be required for different roles.
After getting the requirements, we should create a mock-up or a dashboard design of the dashboard. With the answers/requirements determined in advance, we now start by creating some kind of wireframe containing all the sections and each one of the components. Here, the wireframe can be seen as a two-dimensional illustration that specifically focuses on space allocation, prioritization of content, the functionalities available, and the intended behaviors.
Whenever possible, this should be done by UI/UX experts, and should provide the necessary details that are important not only for visualizations, but also for navigation. No one wants to learn how to navigate a dashboard, or have training just to understand the dashboard, so just keep it simple. We should never undervalue the user's visual experience. Use visual elements, colors, and styles, but not too much. Apply alignments and layering to deliver information and increase the appeal. Use images if absolutely necessary, and be consistent when creating multiple dashboards. Usually, a clean dashboard is better than a full dashboard where users have to look around and may have trouble finding what they need. Start with a simple and clean dashboard that has the essential information, and provide a way for users to drill down.
The interaction with, and feedback from, the users is very important in this phase, because what we agree to do in this phase may become difficult to change after starting the actual development of the dashboard. Of course, we may need to make some adjustments, but it should not be more than that.
There are many tools to do this with, and if you are not a designer, you can use simple tools that provide an easy way to build wireframe mock-ups, and can guide you during development. But if you can have a pixel perfect design, don't hesitate to get it, as it will make a big difference to the final result.
Of course, interaction with the developer is also important, because the designer may end up creating something that may become time-expensive to develop, and all the teams working together will certainly find a way that works for everyone.
Don't forget that a dashboard should be fast to load. Having the best-looking dashboard is not always enough if it's slow to get results to the user. Also, it's easier for a user to understand waiting for drilled-down data than for main KPIs. Anyhow, you should ensure fast responses to keep your users engaged, so the project team should bear this in mind.
When working on medium-to-large projects, we often end up having a team working on the project. The team can be divided into two or more groups, for example, the back end and the front end. When working on the front end, it may be useful to have more than one developer working on a single dashboard. When that happens, it's always a good idea to have a project manager that can lead the project and team, and sync with the client's project manager, without the need for developer interaction, so everyone can focus on their own tasks and responsibilities. Even when working as a solitary person on a project, you will get better results if you can make a plan of the work to be done and the time window.
Having already completed the dashboard design, we need to start work on the dashboard itself. Here, we should do what's called a functional breakdown of the dashboard. This is a document where you can specify the components to be used on each section of the dashboard, and the queries and parameters to be set on each of the components.
It's also very useful if you add the estimated time that will be spent on each task so you can have a good idea of how much time will be needed to develop the dashboard. This is a great help in managing not only the work that was planned versus the work that has been completed, but also to give you an overall idea of the components, parameters, listeners, and queries to use. For each one of the queries, the breakdown should include the resulting columns and types.
You will spend some time creating the functional breakdown, but you will save time when developing the dashboard, as ideas will become clearer, you'll anticipate some problems, and some questions will be raised that need answers. You will also gain massive advantages from this if you are working on a team, as each team member will know what has to be done and how to achieve the goals.
Doing this breakdown will also give you an advantage when building the documentation for the project/dashboard, and also for the knowledge transfer at the end of the project. When doing the knowledge transfer to the customers, we need to ensure this information is the best, is complete, and is easy to understand. When delivering to a customer technical team, we should be able to do this in a complete and understandable way. The functional breakdown will help them understand how the dashboard works. So, everyone can take advantage of this document.
Once all the tasks are delivered to the team's different elements, the team should start the development of the back end and the front end of the dashboard. But they should always look back to the dashboard design and the functional breakdown and take these into account.
Tip
Don't forget the version control
Create or request a version control repository, and make sure that the team's elements have the proper access and rights to it. We will come back to version control later on in the book.
The time has come when you need to start creating your dashboard, but for this you need to install the CTools.
One of the first steps when developing a custom dashboard is to install the CTools. It's required that you already have Pentaho installed and well set up. There are three ways of installing the CTools:
Using Pentaho Marketplace
Using the
ctools-installer(this is only for earlier versions of Pentaho such as 4.5 and 4.8; it might work on Pentaho 5.x, but it is not recommended, and it will not work for 6.x)Manually
Starting from version 5.2, CTools comes already installed, so you can skip the installation process; however, it's important to know the process because sooner or later you may want to upgrade. The standard CTools, the ones that come installed with Pentaho and that were used during the writing of this book, do not allow you to edit or create a new CDE dashboard. But you can perform a few changes to make this possible. You just need to uncomment the <operation> and <overlays> code lines in the following files for the CDE and CDA plugins:
/cda/plugin.xml/pentaho-cdf-dd/plugin.xml
The plugins can be found in the pentaho-solutions/system folder of your Pentaho installation.
The first way, and definitely the easiest, is using Pentaho Marketplace. To follow this process, you need to make sure you have a Pentaho version that already includes Marketplace; otherwise you should download the files and install it first.
Pentaho Community Edition (CE) already comes with Pentaho Marketplace installed by default, which may not happen in EE. Starting from Pentaho 6.1 and above, the Marketplace should come already installed by default.
The first step is to check whether Marketplace is available in your Pentaho version. In the Pentaho User Console (PUC), you can click on the operational menu and check that you have an option available to execute Marketplace. If you have it already installed, you can skip the installation of Pentaho Marketplace; otherwise you will need to install it.
If I had to provide a definition of Pentaho Marketplace, I would say this: Marketplace is a graphical interface running on Pentaho itself that allows users to know what plugins are available and to install/uninstall them, at the same time giving developers the ability to publish their work and make solutions or utilities available to others that may solve a problem or add a new functionality.
Marketplace can be downloaded from http://community.pentaho.com/marketplace/plugins/. Depending on the version of Pentaho you are using, check it using PUC menu under Help | About, and download Marketplace for the version of Pentaho you are using. You will get a zip file, so unzip the file and, after stopping the Pentaho Server, copy the unzipped folder into your pentaho-solution/system folder. You will end up with a folder named marketplace in your system folder. Start the BA Server and you should have Marketplace already available to be used.
Upon launching Pentaho Marketplace, you should get an image like the following figure:
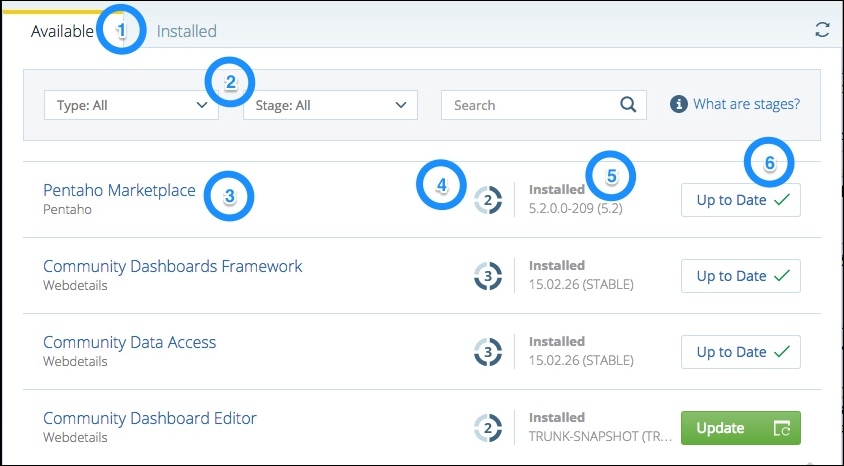
The numbers in the preceding screenshot are explained as follows:
The tabs on the top area of the frame let you filter the plugins by status. They are available in Marketplace (will show all plugins), or can be installed on your Pentaho server.
The drop-down selectors allows you to filter the plugins.
Each one of the rows represents a plugin. You can identify the plugin by its name and developer. You can get more information, or search for plugins online, at the Marketplace website (http://www.pentaho.com/marketplace/).
You can also identify the development stage of the plugin. The number and color identify the development stage. Depending on whether it's in a Customer Lane or Community Lane, there will be a blue or green color, where the number represents the stage in each group. To get more details on this, please visit the Marketplace page at http://www.pentaho.com/marketplace/.
The status can be one of two options, Installed and Available. A plugin that is already installed can then be updated.
Depending on the available actions, you will get different buttons such as:

Clicking on the row of a plugin will launch a dialog with the details of the plugin. This dialog will show the name of the plugin and the developer, version, license, and dependencies, action buttons, and description and, when scrolling down, some screenshots of the plugin may also be available:

It's important to know what version of the plugin we should install. This may be a standard version, a stable version, or a trunk version. The standard version is the version that comes installed with Pentaho 5.2 and above. This version lets you open dashboards or use each of the CTools, but with some limitations. For example, you will be able to open CDE dashboards, but you will not be able to create or edit them. To create or edit dashboards you need to install the stable version.
From the drop-down menu, you should select which version you want to install. Then, you should click on the action, which is Install or Uninstall. After clicking on Install/Uninstall, you will get a confirmation dialog and if you proceed, you will also get some feedback about the success of the request made as a number shown in previous screenshot:
From the dropdown, it will be possible to select the version.
From the buttons, it will be possible to install/uninstall it.
By selecting and installing another version, the files will be overwritten, so there is no need to uninstall the previous version. Note that after the process is completed, you need to restart the BA server.
The CTools installer, which should only be used for Pentaho versions earlier than 5.x, is a script that will download the proper version of the selected plugins, unzip the folder, and copy the files into the right folders. You can download it from https://github.com/pmalves/ctools-installer. When executed, the script will check whether there is a new version and will inform you about it. I advise you to always install the updates, as depending on the version of Pentaho you are using, you may need an upgrade, and it can make a big difference.
To make use of the script, you need to run it from the command line, and if you're running just the script with no options, you will get a list of changes in the script, as well as the usage. When running ./ctools-installer.sh, you will get something like:
Usage: ctools-installer.sh -s solutionPath [-w pentahoWebapPath] [-b branch]

-s    Solution path (eg: /biserver/pentaho-solutions)
-w    Pentaho webapp server path (required for cgg on versions before 4.5. eg: /biserver-ce/tomcat/webapps/pentaho)
-b    Branch from where to get ctools, stable for release, dev for trunk. Default is stable
-c    Comma-separated list of CTools to install (Supported module-names: marketplace,cdf,cda,cde,cgg,cfr,sparkl,cdc,cdv,saiku,saikuadhoc)
-y    Assume yes to all prompts
--no-update Skip update of the ctools-installer.sh
-n    Add newline to end of prompts (for integration with CBF)
-r    Directory for storing offline files
-h    This help screen
To successfully run the installer and install the plugins, you will need to provide the solution path using the –s options and specify the absolute path to your Pentaho Solutions folder or the path where you are running the script from.
Pentaho Web App folder is optional, and is only mandatory when installing the CGG plugin on versions previous to Pentaho 4.5. You will not need to specify this option otherwise.
You may also specify the branch to install CTools from. For that option, you may use a value of stable or dev, depending on what you want to install.
Tip
The stable version is the one to use
In some cases, you can use the development version. For example, if you need a bug fix or just to make use of new functionality, then you might want use the dev version; otherwise you should avoid it.
You will be asked something like:
Install CDF? This will delete everything in pentaho-solutions/system/pentaho-cdf. you sure? (y/N)
You should answer y when you want to install the referred plugin, or N if you don't want to install it. But you can also avoid this if you want to confirm the installation of all plugins. For this, add the option –y to the ctools-installer script. This will confirm the installation of all the plugins available for the selected branch.
Tip
Depending on the branch, the number of CTools to be installed will also vary
When using the Assume yes to all prompts option, make sure you know which ones are installed for the branch you are selecting. The number of plugins will be different depending on the branch you are selecting. When using dev on the branch option, it will include more plugins compared to the stable branch.
Sometimes, you don't want to install all the Ctools at once. For this, –c is available. This should be used followed by the abbreviation of each of the CTools names that you want to install without a prompt, separated by a comma. This gives you a way to automate the install of the CTools.
When you are behind a proxy, you may have some difficulties using the script. This blog post from Pedro Alves can help you overcome the problem: http://pedroalves-bi.blogspot.de/2014/07/using-pentaho-marketplace-over-proxy-or.html.
There is a new option that lets you use the installer to download the plugin, and later install the CTools in offline mode. To achieve this, you should use the option –r and specify the folder to use. If no folder exists, the script will create it and download the folders to it, but will not install them. When the folder you are pointing to with the –r option exists, then it will install the CTools using the files inside, without the need to download them. Note that you can copy the downloaded folder to another location/machine, and when pointing to the existing folder, the installer will use them. So the first time, you will need to run the script from a machine that is able to successfully download the CTools .zip files from the Internet. You can see what the options are by running the command:
./ctools-installer.sh
Here is an example of the syntax of a complete command to install the CTools:
./ctools-installer.sh -s pentaho-solutions/ -b stable -c cdf,cda,cde,cgg -r offlineCToolsFiles
This will create a folder and subfolders with the CTools files, or you can just install them from the specified location.
A manual installation of the CTools is also possible. For this, you should download the plugins yourself. Go to the Marketplace web page (http://www.pentaho.com/marketplace) where you can select your version of Pentaho and the plugin, and download it. Unzip the folders and copy them into the pentaho-solutions/system folder. When restarting the server, the plugins will be working properly. Just make sure you are downloading the version of the plugin that corresponds to your Pentaho version. Be careful with the versions you are installing, and make sure that all the dependencies are also installed, because some plugins are dependent on each other. For example, when installing CDE you also need CDF to be installed.
You should already know that the CTools work on the back end using Java, and make use of the Pentaho API, and on the client side, work on top of HTML, CSS, and JavaScript.
CDF and implicitly CDE are HTML pages that employ JavaScript to make dashboards more interactive and dynamic. These tools also make use of CSS to make the user interface the most astounding it can be.
To leverage the code and work on the CTools side, but also to make it possible to use the most recent and advanced technology, they include some frameworks/libraries that you can take a look at. The most used ones and the ones you should take a look at are as follows:
Utilities:
jQuery (https://jquery.com/)
jQueryUI (http://jqueryui.com/)
jQuery i18n (https://plugins.jquery.com/i18n/)
Mustache (https://github.com/janl/mustache.js)
Backbone (http://backbonejs.org/)
Underscore (http://underscorejs.org/)
Moment (http://momentjs.com/)
Require (http://requirejs.org/)
Layout-related:
Modernizr (http://modernizr.com/)
Bootstrap (http://getbootstrap.com/)
Blueprint (http://www.blueprintcss.org/)
Font-awesome (http://fortawesome.github.io/Font-Awesome/)
Components:
Raphael (http://raphaeljs.com/)
Protovis (http://mbostock.github.io/protovis/)
DataTables (https://www.datatables.net/)
Community Charts Components – CCC (www.webdetails.pt/ctools/ccc/)
Select2 (https://select2.github.io/)
Chosen (http://harvesthq.github.io/chosen/)
Sparkline (http://omnipotent.net/jquery.sparkline/#s-about)
Fancybox (http://fancybox.net/)
Some of these frameworks and libraries are covered in the book, at least a part of the libraries and frameworks. To make the most out of them, you should read their documentation. It's not the purpose of this book to teach you how to work with them.
By now, you should have learned what the most common uses of the CTools are. You got to know a summary of the CTools, a little bit of history, and how they were born. You also now know how to install them using the different processes that exist. We talked about the frameworks/libraries that are used with them, but you should gain some more knowledge on how they work, because that will make all the difference when building your dashboards. For that you can refer to the provided links, the official webpages and at least get an idea of how they work.
You won't have a full understanding about the process of building CTools dashboards just yet, but you have an idea, and it's just a matter of adjusting process to the way you work and to provide the best services to your clients. You saw that an important part of this process is to ask the right questions and get a full and accurate knowledge of the business and its goals.
To be able to build a dashboard we need to get data, so in the next chapter, you will learn how to use CDA, and find out how to get the most out of it.