Download code from GitHub
People have different ways of learning new topics. We know that background information can contribute greatly to a better understanding of new topics. That is why, in this chapter of our Learning Neo4j 3.x book, we will start with a bit of background information, not to recount the tales of history, but to give you the necessary context that can lead to a better understanding of the topics.
In order to do so, we will address the following topics:
- Graphs: What they are and where they came from. This section will aim to set the record straight on what, exactly, our subject will contain, and what it won't.
- Graph theory: What it is and what it is used for. This section will give you quite a few examples of graph theory applications, and it will also start hinting at applications for graph databases, such as Neo4j later on.
- Databases: What the different kinds of databases and what they are used for. This section will help you to know what the right database for your projects.
So, let's dig right in.
Many people have used the word graph at some point in their professional or personal lives. However, chances are that they did not use it in the way that we will be using it in this book. Most people--obviously not you, otherwise you probably would not have picked up this book--actually think about something very different when talking about a graph. They think about pie charts and bar charts. They think about graphics, not graphs.
In this book, we will be working with a completely different type of subject--the graphs that you might know from your math classes. I, for one, distinctly remember being taught the basics of discrete mathematics in one of my university classes, and I also remember finding it terribly complex and difficult to work with. Little did I know that my later professional career would use these techniques in a software context, let alone that I would be writing a book on this topic.
So, what are graphs? To explain this, I think it is useful to put a little historic context around the concept. Graphs are actually quite old as a concept. They were invented, or at least first described, in an academic paper by the well-known Swiss mathematician, Leonhard Euler. He was trying to solve an age-old problem that we now know as the Seven Bridges of Königsberg. The problem at hand was pretty simple to understand.
Königsberg was a beautiful medieval city in the Prussian Empire situated on the river Pregel. It is located between Poland and Lithuania in today's Russia. If you try to look it up on any modern-day map, you will most likely not find it as it is currently known as Kaliningrad. The Pregel not only cut Königsberg into left- and right-bank sides of the city, but it also created an island in the middle of the river, which was known as the Kneiphof. The result of this peculiar situation was a city that was cut into four parts (we will refer to them as A, B, C, and D), which were connected by seven bridges (labelled a, b, c, d, e, f, and g in the following diagram). This gives us the following situation:
- The seven bridges are connected to the four different parts of the city
- The essence of the problem that people were trying to solve was to take a tour of the city, visiting every one of its parts and crossing every single one of its bridges, without having to walk a single bridge or street twice
In the following diagram, you can see how Euler illustrated this problem in his original 1736 paper:

Illustration of the problem as mentioned by Euler in his paper in 1736
Essentially, it was a pathfinding problem, like many others (for example, the knight's ride problem, or the traveling salesman problem). It does not seem like a very difficult assignment at all now, does it? However, at the time, people really struggled with it and were trying to figure it out for the longest time. It was not until Euler got involved and took a very different, mathematical approach to the problem that it got solved once and for all.
Euler did the following two things that I find really interesting:
- First and foremost, he decided not to take the traditional brute force method to solve the problem (in this case, drawing a number of different route options on the map and trying to figure out--essentially by trial and error--if there was such a route through the city), but to do something different. He took a step back and took a different look at the problem by creating what I call an abstract version of the problem at hand, which is essentially a model of the problem domain that he was trying to work with. In his mind, at least, Euler must have realized that the citizens of Königsberg were focusing their attention on the wrong part of the problem--the streets. Euler quickly came to the conclusion that the streets of Königsberg did not really matter to find a solution to the problem. The only things that mattered for his pathfinding operation were the following:
- The parts of the city
- The bridges connecting the parts of the city
Now, all of a sudden, we seem to have a very different problem at hand, which can be accurately represented in what is often regarded as the world's first graph:

Simplifying Königsberg
- Secondly, Euler solved the puzzle at hand by applying a mathematical algorithm on the model that he created. Euler's logic was simple--if I want to take a walk in the town of Königsberg, then I will have to do as follows:
- I will have to start somewhere in any one of the four parts of the city
- I will have to leave that part of the city; in other words, I will have to cross one of the bridges to go to another part of the city
- I will then have to cross another five bridges, leaving and entering different parts of the city
- Finally, I will end the walk through Königsberg in another part of the city
Therefore, Euler argues, the case must be that the first and last parts of the city have an odd number of bridges that connect them to other parts of the city (because you leave from the first part and you arrive at the last part of the city), but the other two parts of the city must have an even number of bridges connecting them to the first and last parts of the city, because you will arrive and leave from these parts of the city.
This number of bridges connecting the parts of the city has a very special meaning in the model that Euler created, the graph representation of the model. We call this the degree of the nodes in the graph. In order for there to be a path through Königsberg that only crossed every bridge once, Euler proved that all he had to do was to apply a very simple algorithm that would establish the degree (in other words, count the number of bridges) of every part of the city. This is shown in the following diagram:

Simplified town
This is how Euler solved the famous Seven Bridges of Königsberg problem. By proving that there was no part of the city that had an even number of bridges, he also proved that the required walk in the city could not be done. Adding one more bridge would immediately make it possible, but with the state of the city and its bridges at the time, there was no way one could take such Eulerian Walk of the city.
By doing so, Euler created the world's first graph. The concepts and techniques of his research, however, are universally applicable; in order to do such a walk on any graph, the graph must have zero or two vertices with odd degrees and all intermediate vertices must have even degree.
To summarize, a graph is nothing more than an abstract, mathematical representation of two or more entities, which are somehow connected or related to each other. Graphs model pairwise relations between objects. They are, therefore, always made up of the following components:
- The nodes of the graph, usually representing the objects mentioned previously: In math, we usually refer to these structures as vertices; but for this book and in the context of graph databases such as Neo4j, we will always refer to vertices as nodes.
- The links between the nodes of the graph: In math, we refer to these structures as edges, but again, for the purpose of this book, we will refer to these links as relationships.
- The structure of how nodes and relationships are connected to each other makes a graph: Many important qualities, such as the number of edges connected to a node (what we referred to as degrees), can be assessed. Many other such indicators also exist.
Now that we have discussed graphs and understand a bit more about their nature and history, it's time to look at the discipline that was created on top of these concepts, often referred to as the graph theory.
When Euler invented the first graph, he was trying to solve a very specific problem of the citizens of Königsberg, with a very specific representation/model and a very specific algorithm. It turns out that there are quite a few problems that can be addressed as follows:
- Described using the graph metaphor of objects and pairwise relations between them
- Solved by applying a mathematical algorithm to this structure
The mechanism is the same, and the scientific discipline that studies these modeling and solution patterns, using graphs is often referred to as the graph theory and is considered to be a part of discrete mathematics.
There are lots of different types of graphs that have been analyzed in this discipline, as you can see from the following diagram:

Graph types
Graph theory, the study of graph models and algorithms, has turned out to be a fascinating field of study, which has been used in many different disciplines to solve some of the most interesting questions facing mankind. Interestingly enough, it has seldom really been applied with rigor in the different fields of science that can benefit from it; maybe scientists today don't have the multidisciplinary approach required (providing expertise from graph theory and their specific field of study) to do so.
So, let's talk about some of these fields of study a bit, without giving you an exhaustive list of all applicable fields. Still, I do believe that some of these examples will be of interest for our future discussions in this book and will work up an appetite for what types of applications we will use a graph-based database, such as, Neo4j for.
For the longest time, people have understood that the way humans interact with one another is actually very easy to describe in a network. People interact with people every day. People influence one another every day. People exchange ideas every day. As they do, these interactions cause ripple effects through the social environment that they inhabit. Modelling these interactions as a graph has been of primary importance to better understand global demographics, political movements, and--last, but not least--the commercial adoption of certain products by certain groups. With the advent of online social networks, this graph-based approach to social understanding has taken a whole new direction. Companies such as Google, Facebook, Twitter, LinkedIn, and many others have undertaken very specific efforts to include graph-based systems in the way they target their customers and users, and in doing so, they have changed many of our daily lives quite fundamentally. See the following diagram, featuring a visualization of my LinkedIn network:

Rik's professional network representation
We often say in marketing taglines: Graphs Are Everywhere. When we do so, we are actually describing reality in a very real and fascinating way. Also, in this field, researchers have known for quite some time that biological components (proteins, molecules, genes, and so on) and their interactions can accurately be modelled and described by means of a graph structure, and doing so yields many practical advantages. In metabolic pathways (see the following diagram for the human metabolic system), for example, graphs can help us understand how the different parts of the human body interact with each other. In metaproteomics (the study of all protein samples taken from the natural environment), researchers analyze how different kinds of proteins interact with one another and are used in order to better steer chemical and biological production processes.

A diagram representing the human metabolic system
Some of the earliest computers were built with graphs in mind. Graph Compute Engines solved scheduling problems for railroads as early as the late 19th century, and the usage of graphs in computer science has only accelerated since then. In today's applications, use cases vary from chip design, network management, recommendation systems, and UML modeling to algorithm generation and dependency analysis. The following is an example of a UML diagram:

An example of an UML diagram
The latter is probably one of the more interesting use cases. Using pathfinding algorithms, software and hardware engineers have been analyzing the effects of changes in the design of their artifacts on the rest of the system. If a change is made to one part of the code, for example, a particular object is renamed; the dependency analysis algorithms can easily walk the graph of the system to find out what other classes will be affected by that change.
Another really interesting field of graph theory applications is flow problems, also known as maximum flow problems. In essence, this field is part of a larger field of optimization problems, which is trying to establish the best possible path across a flow network. Flow networks types of graphs in which the nodes/vertices of the graphs are connected by relationships/edges that specify the capacity of that particular relationship. Examples can be found in fields such as the telecom networks, gas networks, airline networks, package delivery networks, and many others, where graph-based models are then used in combination with complex algorithms. The following diagram is an example of such a network, as you can find it on http://enipedia.tudelft.nl/:

An example of a flow network
These algorithms are then used to identify the calculated optimal path, find bottlenecks, plan maintenance activities, conduct long-term capacity planning, and many other operations.
The original problem that Euler set out to solve in 18th century Königsberg was in fact a route planning/pathfinding problem. Today, many graph applications leverage the extraordinary capability of graphs and graph algorithms to calculate--as opposed to finding with trial and error--the optimal route between two nodes on a network. In the following diagram, you will find a simple route planning example as a graph:

A simple route planning example between cities to choose roads versus highways
A very simple example will be from the domain of logistics. When trying to plan for the best way to move a package from one city to another, one will need the following:
- A list of all routes available between the cities
- The most optimal of the available routes, which depends on various parameters in the network, such as capacity, distance, cost, CO2 exhaust, speed, and so on
This type of operation is a very nice use case for graph algorithms. There are a couple of very well-known algorithms that we can briefly highlight:
- The Dijkstra algorithm: This is one of the best-known algorithms to calculate the shortest weighted path between two points in a graph, using the properties of the edges as weights or costs of that link.
- The A* (A-star) algorithm: This is a variation of Dijkstra's original ideas, but it uses heuristics to more efficiently predict the shortest path explorations. As A* explores potential graph paths, it holds a sorted priority queue of alternate path segments along the way, as it calculates the past path cost and the future path cost of the different options that are possible during the route exploration.
Depending on the required result, the specific dataset, and the speed requirements, different algorithms will yield different returns.
No book chapter treating graphs and graph theory--even at the highest level--will be complete without mentioning one of the most powerful and widely-used graph algorithms on the planet, PageRank. PageRank is the original graph algorithm, invented by Google founder Larry Page in 1996 at Stanford University, to provide better web search results. For those of us old enough to remember the early days of web searching (using tools such as Lycos, AltaVista, and so on), it provided a true revolution in the way the web was made accessible to end users.
The following diagram represents the PageRank graph:

PageRank
The older tools did keyword matching on web pages, but Google revolutionized this by no longer focusing on keywords alone, but by doing link analysis on the hyperlinks between different web pages. PageRank, and many of the other algorithms that Google uses today, assumes that more important web pages, which should appear higher in your search results, will have more incoming links from other pages, and therefore, it is able to score these pages by analyzing the graph of links to the web page. History has shown us the importance of PageRank. Not only has Google, Inc. taken the advantage over Yahoo as the most popular search engine and built quite an empire on top of this graph algorithm, but its principles have also been applied to other fields, such as, cancer research and chemical reactions.
Now, we want to contextualize the concepts around graph databases and understand the historical and operational differences between older, different kinds of database management systems and our modern-day Neo4j installations.
To do this, we will cover the following:
- Some background information on databases in general
- A walk-through of the different approaches taken to manage and store data, from old-school navigational databases to NoSQL graph databases
- A short discussion explaining the graph database category, its strengths, and its weaknesses
This should set us up for some more practical discussions later in this book.
It's not very clear when the first real database management system was formally conceived and implemented. Ever since Babbage invented the first complete Turing computing system (the Analytical Engine, which Babbage never really managed to get built), we have known that computers will always need to have some kind of memory. This will be responsible for dealing with the data on which operations and calculations will be executed. However, when did this memory evolve into a proper database? What do we mean by a database, anyway?
Let's tackle the latter question first. A database can be described as any kind of organized collection of data. Not all databases require a management system--think of the many spreadsheets and other file-based storage approaches that don't really have any kind of real material oversight imposed on it, let alone true management systems. A database management system (or DBMS for short), then, can technically be referred to as a set of computer programs that manage (in the broadest sense of the word) the database. It is a system that sits between the user-facing hardware and software components and the data. It can be described as any system that is responsible for and able to manage the structure of the data, is able to store and retrieve that data, and provides access to this data in a correct, trustable, performant, secure fashion.
Databases as we know them, however, did not exist from the get-go of computing. At first, most computers used memory, and this memory used a special-purpose, custom-made storage format that often relied on very manual, labor-intensive, and hardware-based storage operations. Many systems relied on things like punch cards for its instructions and datasets. It's not that long ago that computer systems evolved from these seemingly ancient, special-purpose technologies.
Having read many different articles on this subject, I believe the need for general-purpose database management systems, similar to the ones we know today, started to increase due to the following:
- The number of computerized systems increased significantly.
- A number of breakthroughs in terms of computer memory were realized. Direct Access memory--memory that would not have to rely on lots of winding of tapes or punched cards--became available in the middle of the 1960s.
Both of these elements were necessary preconditions for any kind of multipurpose database management system to make sense. The first real database management systems seem to have cropped up in the 1960s, and I believe it would be useful to quickly run through the different phases in the development of database management systems.
We can establish the following three major phases over the half century that database management systems have been under development:
- Navigational databases
- Relational databases
- NoSQL databases
Let's look at these three system types so that we can then more accurately position graph databases such as Neo4j--the real subject of this book.
The original database management systems were developed by legendary computer scientists such as Charles Bachman, who gave a lot of thought to the way software should be built in a world of extremely scarce computing resources. Bachman invented a very natural (and as we will see later, graphical) way to model data: as a network of interrelated things. The starting point of such a database design was generally a Bachman diagram (refer to the following diagram), which immediately feels like it expresses the model of the data structure in a very graph-like fashion:

Bachman diagram
These diagrams were the starting points for database management systems that used either networks or hierarchies as the basic structure for their data. Both the network databases and hierarchical database systems were built on the premise that data elements would be linked together by pointers:

An example of a navigational database model with pointers linking records
As you can probably imagine from the preceding discussion, these models were very interesting and resulted in a number of efforts that shaped the database industry. One of these efforts was the Conference on Data Systems Languages, better known under its acronym, CODASYL. This played an ever so important role in the information technology industry of the sixties and seventies. It shaped one of the world's dominant computer programming systems (COBOL), but also provided the basis for a whole slew of navigational databases such as IDMS, Cullinet, and IMS. The latter, the IBM-backed IMS database, is often classified as a hierarchical database, which offers a subset of the network model of CODASYL.
Navigational databases eventually gave way to a new generation of databases, the Relational Database Management Systems. Many reasons have been attributed to this shift, some technical and some commercial, but the main two reasons that seem to enjoy agreement across the industry are as follows:
- The complexity of the models that they used. CODASYL is widely regarded as something that can only be worked or understood by absolute experts--as we partly experienced in 1999, when the Y2K problem required many CODASYL experts to work overtime to migrate their systems into the new millennium.
- The lack of a declarative query mechanism for navigational database management systems. Most of these systems inherently provide a very imperative approach to finding data: the user would have to tell the database what to do instead of just being able to ask a question and having the database provide the answer.
This allows for a great transition from navigational to relational databases.
Relational Database Management Systems are probably the ones that we are most familiar with in 21st century computer science. Some of the history behind the creation of these databases is quite interesting. It started with an unknown researcher at IBM's San Jose, CA, research facility--a gentleman called Edgar Codd. Mr. Codd was working at IBM on hard disk research projects, but was increasingly drawn into the navigational database management systems world that would be using these hard disks. Mr. Codd became increasingly frustrated with these systems, mostly with their lack of an intuitive query interface.
Essentially, you could store data in a network/hierarchy, but how would you ever get it back out?

Relational database terminology
Codd wrote several papers on a different approach to database management systems that would not rely as much on linked lists of data (networks or hierarchies) but more on sets of data. He proved--using a mathematical representation called tuple calculus--that sets would be able to adhere to the same requirements that navigational database management systems were implementing. The only requirement was that there would be a proper query language that would ensure some of the consistency requirements on the database. This, then, became the inspiration for declarative query languages such as Structured Query Language (SQL). IBM's System R was one of the first implementations of such a system, but Software Development Laboratories, a small company founded by ex-IBM people and one illustrious Mr. Larry Ellison, actually beat IBM to the market. Their product, Oracle, never got released until a couple of years later by Relational Software, Inc., and then eventually became the flagship software product of Oracle Corporation, which we all know today.
With relational databases came a process that all of us who have studied computer science know as normalization. This is the process that database modellers go through to minimize database redundancy and introduce disk storage savings, by introducing dependency. It involves splitting off data elements that appear more than once in a relational database table into their own table structures. Instead of storing the city where a person lives as a property of the person record, I would split the city into a separate table structure and store person entities in one table and city entities in another table. By doing so, we will often be creating the need to join these tables back together at query time. Depending on the cardinality of the relationship between these different tables (1:many, many:1, and many:many), this would require the introduction of a new type of table to execute these join operations: the join table, which links together two tables that would normally have a many:many cardinality.
I think it is safe to say that Relational Database Management Systems have served our industry extremely well in the past 30 years and will probably continue to do so for a very long time to come. However, they also came with a couple of issues, which are interesting to point out as they will (again) set the stage for another generation of database management systems:
- Relational Database Systems suffer at scale. As the sets or tables of the relational systems grow longer, the query response times of the relational database systems generally get worse, much worse. For most use cases, this was and is not necessarily a problem, but as we all know, size does matter, and this deficiency certainly does harm the relational model. A counter example to this could be Google's Spanner, a scalable, multi-version, globally-distributed, and synchronously-replicated database.
- Relational Databases are quite anti-relational; they are less relational than graph databases. As the domains of our applications--and therefore, the relational models that represent those domains--become more complex, relational systems really start to become very difficult to work with. More specifically, join operations, where users would ask queries of the database that would pull data from a number of different sets/tables, are extremely complicated and resource-intensive for the database management system. There is a true limit to the number of join operations that such a system can effectively perform, before the join bombs go off and the system becomes very unresponsive. See an example of explosive model.

Relational database schema with explosive join tables
- Relational databases impose a schema even before we put any data into the database and even if a schema is too rigid. Many of us work in domains where it is very difficult to apply a single database schema to all the elements of the domain that we are working with. Increasingly, we are seeing the need for a flexible type of schema that would cater to a more iterative, more agile way of developing software.
As you will see in the following sections, the next generation of database management systems is definitely not settling for what we have today, and is attempting to push innovation forward by providing solutions to some of these extremely complex problems.
The new millennium and the explosion of web content marked a new era for database management systems as well. A whole generation of new databases emerged, all categorized under the somewhat confrontational name of NoSQL databases. While it is not clear where the name came from, it is pretty clear that it was born out of frustration with relational systems at that point in time. While most of us nowadays treat NoSQL as an acronym for Not Only SQL, the naming still remains a somewhat controversial topic among data buffs.
The basic philosophy of most NoSQL adepts, I believe, is that of the task-oriented database management system. It's like the old saying goes: If all you have is a hammer, everything looks like a nail. Well, now we have different kinds of hammers, screwdrivers, chisels, shovels, and many more tools up our sleeve to tackle our data problems. The underlying assumption then, of course, is that you are better off using the right tool for the job if you possibly can and that, for many workloads, the characteristics of the relational database may actually prove to be counterproductive. Other databases, not just SQL databases, are available now, and we can basically categorize them into four different categories:
- Key-value stores
- Column-family stores
- Document stores
- Graph databases
Let's get into the details of each of these stores.
Key-value stores are probably the simplest type of task-oriented NoSQL databases. The data model of the original task at hand was probably not very complicated: Key-value stores are mostly based on a whitepaper published by Amazon at the biennial ACM Symposium on Operating Systems Principles, called the Dynamo paper. The data model discussed in this paper is that of Amazon's shopping cart system, which was required to always be available and to support extreme loads. Therefore, the underlying data model of the Key-value store family of database management systems is indeed very simple: keys and values are aligned in an inherently schema-less data model. Indeed, scalability is typically extremely high, with clustered systems of thousands of commodity hardware machines existing at several high-end implementations such as Amazon and many others. Examples of Key-value stores include the mentioned DynamoDB, Riak, Project Voldemort, Redis, and the newer Aerospike. The following screenshot illustrates the difference in data models:

A simple Key-value database
A Column-family store is another example of a very task-oriented type of solution. The data model is a bit more complex than the Key-value store, as it now includes the concept of a very wide, sparsely populated table structure that includes a number of families of columns that specify the keys for this particular table structure. Like the Dynamo system, Column-family stores also originated from a very specific need of a very specific company (in this case, Google), who decided to roll their own solution. Google published their BigTable paper in 2006 at the Operating Systems Design and Implementation (OSDI) symposium. The paper not only started a lot of work within Google, but also yielded interesting open source implementations such as Apache Cassandra and HBase. In many cases, these systems are combined with batch-oriented systems that use Map/Reduce as the processing model for advanced querying:

A simple column-family data model
Sparked by the explosive growth of web content and applications, probably one of the most well-known and most used types of NoSQL databases are in the document category. The key concept in a document store, as the name suggests, is that of a semi-structured unit of information often referred to as a document. This can be an XML, JSON, YAML, OpenOffice, or, MS Office, or whatever other kind of document that you may want to use, which can simply be stored and retrieved in a schema-less fashion. Examples of Document stores include the wildly popular MongoDB, Apache CouchDB, MarkLogic, and Virtuoso:

A simple document data model
Last but not least, and of course the subject of most of this book, are the graph-oriented databases. They are often also categorized in the NoSQL category, but as you will see later, they are inherently very different. This is not the case in the least, because the task-orientation that graph databases are aiming to resolve has everything to do with graphs and graph theory. A graph database such as Neo4j aims to provide its users with a better way to manage the complexity of the dense network of the data structure at hand.
Implementations of this model are not limited to Neo4j, of course. Other closed and open source solutions such as AllegroGraph, Dex, FlockDB, InfiniteGraph, OrientDB, and Sones are examples of implementations at various maturity levels.
So, now that we understand the different types of NoSQL databases, it would probably be useful to provide some general classification of this broad category of database management systems, in terms of their key characteristics. In order to do that, I am going to use a mental framework that I owe to Martin Fowler (from his book NoSQL Distilled) and Alistair Jones (in one of his many great talks on this subject). The reason for doing so is that both of these gentlemen and share my viewpoint that NoSQL essentially falls into two categories, on two sides of the relational crossroads:
- On one side of the crossroads are the aggregate stores. These are the Key-value, Column-family, and Document-oriented databases, as they all share a number of characteristics:
- They all have a fundamental data model that is based around a single, rich structure of closely-related data. In the field of software engineering called domain-driven design, professionals often refer to this as an aggregate, hence the reference to the fact that these NoSQL databases are all aggregate-oriented database management systems.
- They are clearly optimized for use cases in which the read patterns align closely with the write patterns. What you read is what you have written. Any other use case, where you would potentially like to combine different types of data that you had previously written in separate key-value pairs / documents / rows, would require some kind of application-level processing, possibly in batch if at some serious scale.
- They all give up one or more characteristics of the relational database model in order to benefit it in other places. Different implementations of the aggregate stores will allow you to relax your consistency/transactional requirements and will give you the benefit of enhanced (and sometimes, massive) scalability. This, obviously, is no small thing if your problem is around scale, of course. Use the following signs:

Relational crossroads, courtesy of Alistair Jones
- On the other side of the crossroads are the graph databases, such as Neo4j. One could argue that graph databases actually take relational databases as follows:
- One step further, by enhancing the data model with a more granular, more expressive method to store data, thereby allowing much more complex questions to be asked of the database, and effectively, as we will see later, demining the join bomb
- Back to its roots, by reusing some of the original ideas of navigational databases, but of course learning from the lessons of the relational database world by reducing complexity and facilitating easy querying capabilities
With this introduction and classification behind us, we are now ready to take a closer look at graph databases.
The NoSQL category of graph databases, as we have seen previously, is in a class of its own. In many ways, this is because the underlying data model of graph databases--the Property Graph data model--is of a very specific nature, which we will explain a bit further.
First of all, let's define the Property Graph data model. Essentially, it means that we will be storing our data in the graph database.
A graph structure means that we will be using vertices and edges (or nodes and relationships, as we prefer to call these elements) to store data in a persistent manner. As a consequence, the graph structure enables us to perform the following:
- Represent data in a much more natural way, without some of the distortions of the relational data model
- Apply various types of graph algorithms on these structures
In short, it enables us to treat the graph nature of that data as an essential part of our capabilities. One of the key capabilities that we will find in the remainder of this book is the capability to traverse the graph: to walk on its nodes and relationships and hop from one node to the next by following the explicit pointers that connect the nodes. This capability--sometimes also referred to as index free adjacency, which essentially means that you can find adjacent/neighbouring nodes without having to do an index lookup--is key to the performance characteristics that we will discuss in later paragraphs.
However, it is important to realize that the property graph model is not suited for all graph structures. Specifically, it is optimized for the following:
- Directed graphs: The links between nodes (also known as the relationships) have a direction.
- Multirelational graphs: There can be multiple relationships between two nodes that are the same. These relationships, as we will see later, will be clearly distinct and of a different type.
- Storing key-value pairs as the properties of the nodes and relationships.
In the different kinds of properties that can belong to the different elements of the graph structure, the most basic ones, of course, are properties assigned to vertices and edges:
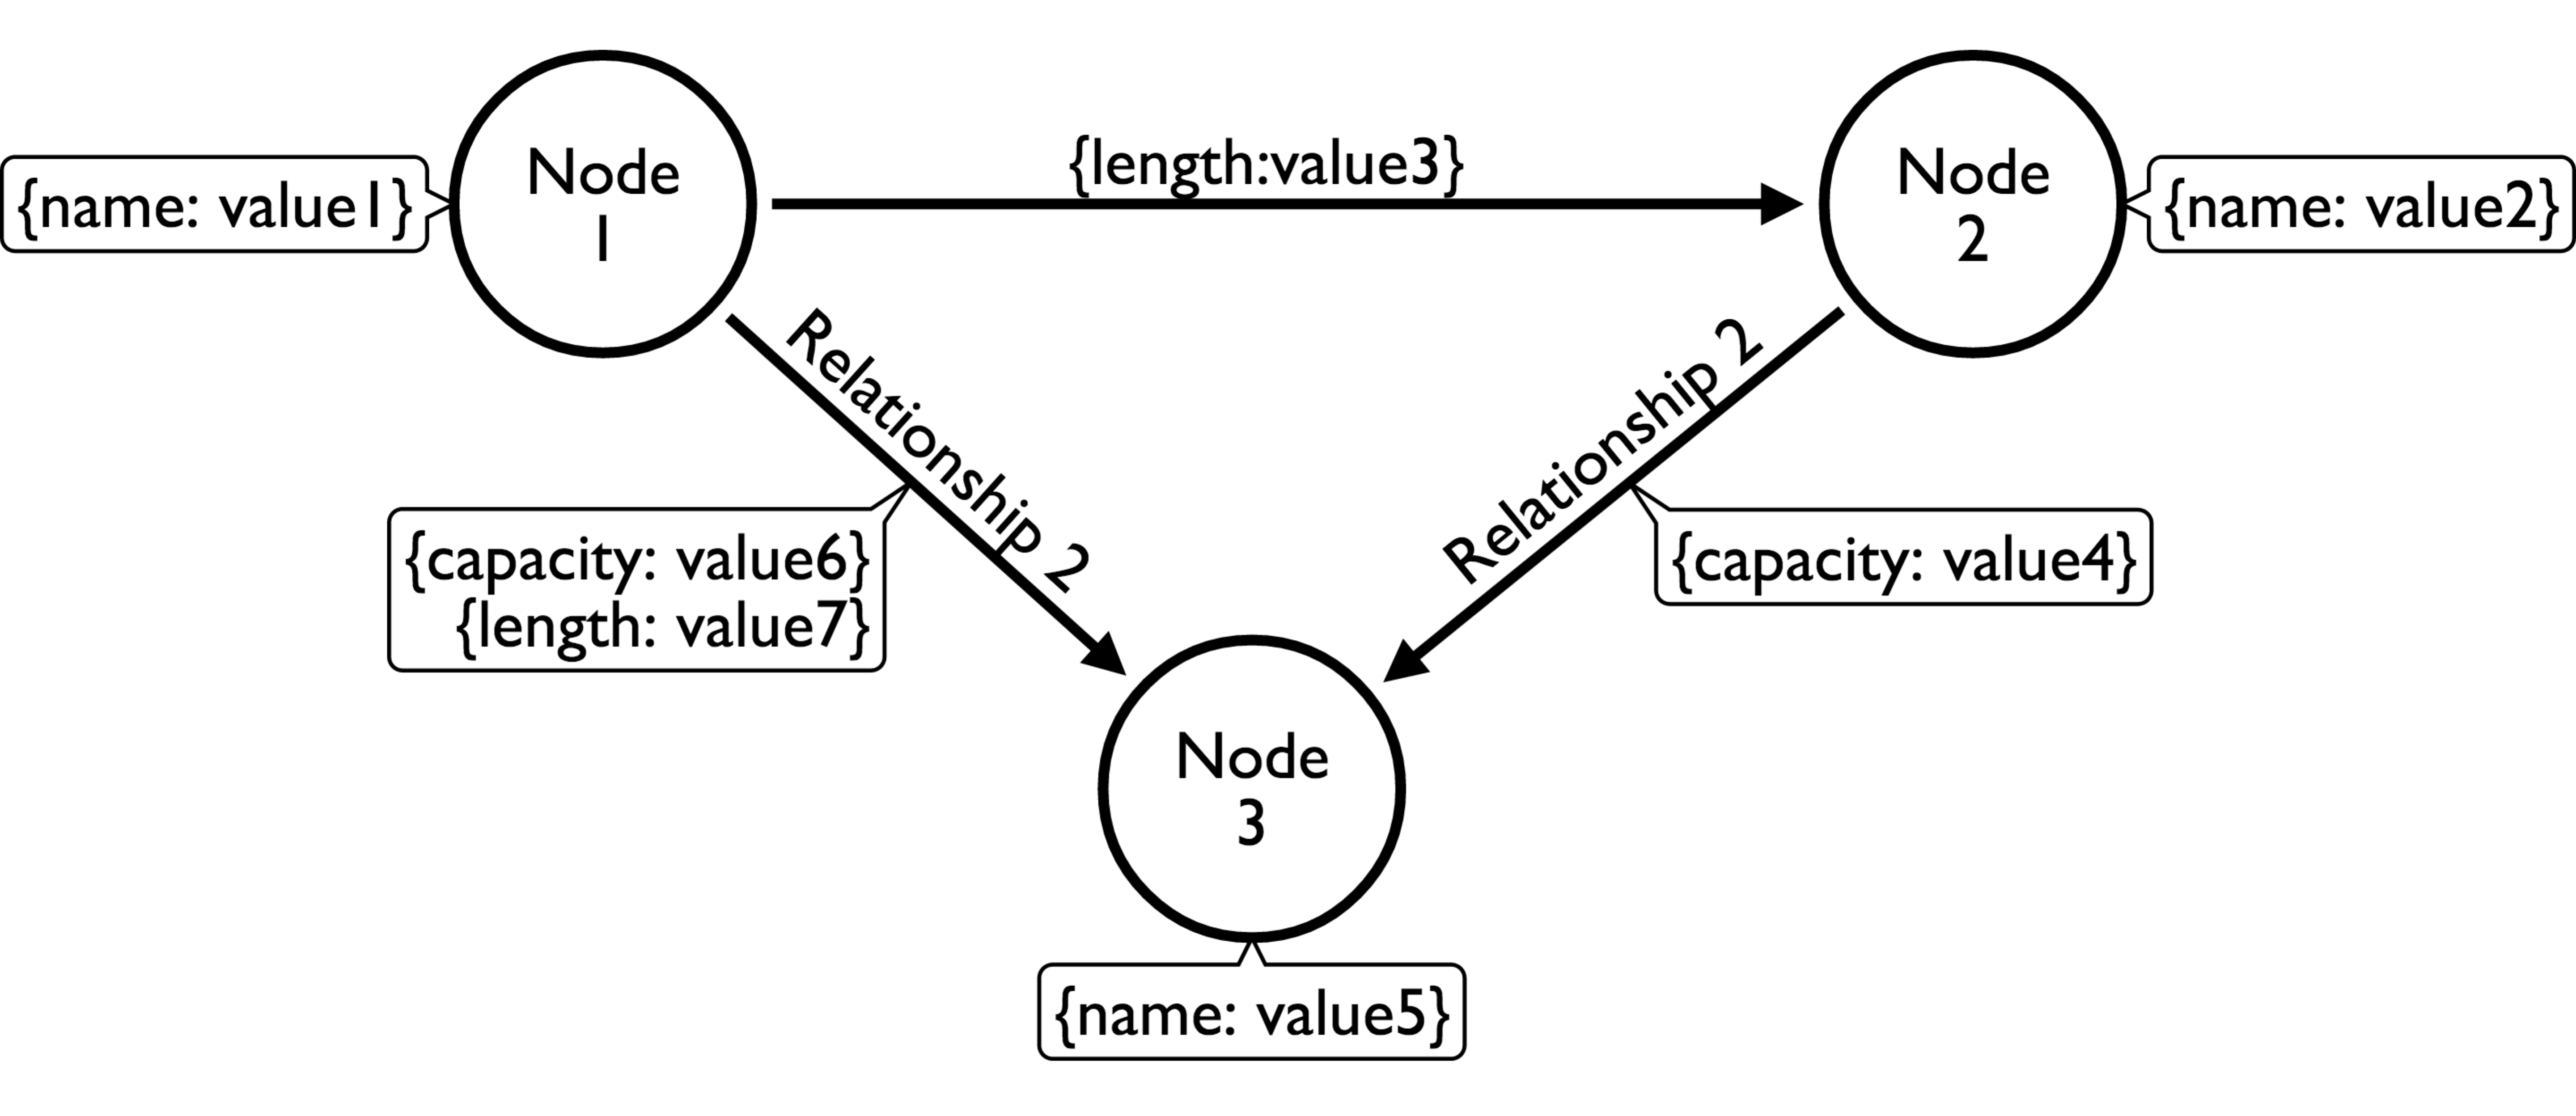
An example of a simple property graph
Let's investigate this model in a bit more detail. When looking closer at this, we find the following interesting aspects of this model:
- There is no fixed schema. The database, in and of itself, does not impose that you have to have a schema; although most software professionals will agree that having some kind of schema as you move closer to production is probably not a bad idea.
- Partly because of the schema-less nature of the database, it seems to be a very nice fit for dealing with semi-structured data. If one node or relationship has fewer or more properties, we do not have to alter the design for this; we can just deal with that difference in structure automatically and work with it in exactly the same way.
- Nodes and node properties seem to be quite easy to understand. In relational terms, one can easily compare nodes with records in a table. It's as if the property graph contains lots and lots of single-row tables, that is, the nodes of the graph. Nodes will have properties just like records/rows in a table will have fields/columns.
- Relationships are a bit different. They always have a start and endpoint, and therefore have a direction. They cannot be dangling, but can be self-referencing (the same node as the start and endpoint). However, the real power lies in the following facts:
- Relationships are explicit: They are not inferred by some kind of constraint or established at query time through a join operation. They are equal citizens in the database; they have the same expressive power as the nodes representing the entities in the database.
- Relationships can have properties too: They can have values associated with them that can specify the length, capacity, or any other characteristic of that relationship. This is terribly important and very different from anything we know from the relational world.
In Neo4j then, this data model has been enriched with a couple of key concepts that extend the core property graph model. Two concepts are important, and related but different: node labels and relationship types.
Node labels are a way of semantically categorizing the nodes in your graph. A node can have zero, one, or more labels assigned to it--similar to how you would use labels in something like your Gmail inbox. Labels are essentially a set-oriented concept in a graph structure: they allow you to easily and efficiently create subgraphs in your database, which can be useful for many different purposes, such as querying on only a part of your database content. One of the most important things that you can do with labels is create some kind of typing structure or schema in your database without having to do this yourself (which is what people used to do all the time before the advent of labels in Neo4j 2.0). A node with one label is comparable to a row in a table. There is no comparison with the (so-called) relational world for a node with several labels. Although not required, a node should have at least one label.
Relationship types achieve something similar to what you do with node labels, but with relationships. The purpose of doing so, however, is mostly very different. Relationship types are mandatory properties of relationships (every relationship must have one and only one type--two nodes can be linked by several relations) and will be used during complex, deep traversals across the graph, when only certain kinds of paths from node to node are deemed important by a specific query.
This should give you a good understanding of the basic data model that we will be using during the remainder of this book. Neo4j implements a very well-documented version of the property graph database, and as we will see later, is well-suited for a wide variety of different use cases. Let's explore the reasons for using a graph database like Neo4j a bit more before proceeding.
By now, you should have a good understanding of what graph databases are and how they relate to other database management systems and models. Much of the remainder of this book will be drilling into a bit more detail on the specifics of Neo4j as an example implementation of such a database management system. Before that, however, it makes sense to explore why these kinds of databases are of such interest to modern-day software professionals--developers, architects, project and product managers, and IT directors alike.
The fact of the matter is that there are a number of typical data problems, and database system queries are an excellent match for a graph database, but there are a number of other types of data questions that are not specifically designed to be answered by such systems. Let's explore these for a bit and determine the characteristics of your dataset and your query patterns that will determine whether graph databases are going to be a good fit or not.
When you are trying to solve a problem that meets any of the following descriptions, you should probably consider using a graph database such as Neo4j.
Complex queries are the types of questions that you want to ask of your data that are inherently composed of a number of complex join-style operations. These operations, as every database administrator knows, are very expensive operations in relational database systems, because we need to be computing the Cartesian product of the indices of the tables that we are trying to join. That may be okay for one or two joins between two or three tables in a relational database management system, but as you can easily understand, this problem becomes exponentially bigger with every table join that you add. On smaller datasets, it can become an unsolvable problem in a relational system, and this is why complex queries become problematic.
An example of such a complex query would be finding all the restaurants in a certain London neighborhood that serve Indian food, are open on Sundays, and cater for kids. In relational terms, this would mean joining up data from the restaurant table, the food type table, the opening hours table, the caters for table, and the zip-code table holding the London neighborhoods, and then providing an answer. No doubt there are numerous other examples where you would need to do these types of complex queries; this is just a hypothetical one.
In a graph database, a join operation will never need to be performed: all we need to do is to find a starting node in the database (for example, London), usually with an index lookup, and then just use the index-free adjacency characteristic and hop from one node (London) to the next (Restaurant) over its connecting relationships (Restaurant-[LOCATED_IN]->London). Every hop along this path is, in effect, the equivalent of a join operation. Relationships between nodes can therefore also be thought of as an explicitly stored representation of such a join operation.
We often refer to these types of queries as pattern matching queries. We specify a pattern (refer to the following diagram: blue connects to orange, orange connects to green, and blue connects to green), we anchor that pattern to one or more starting points and we start looking for the matching occurrences of that pattern. As you can see, the graph database will be an excellent tool to spin around the anchor node and figure out whether there are matching patterns connected to it. Non-matching patterns will be ignored, and matching patterns that are not connected to the starting node will not even be considered.
This is actually one of the key performance characteristics of a graph database: as soon as you grab a starting node, the database will only explore the vicinity of that starting node and will be completely oblivious to anything that is not connected to the starting node. The key performance characteristic that follows from this is that query performance is very independent of the dataset size, because in most graphs, everything is not connected to everything. By the same token, as we will see later, performance will be much more dependent on the size of the result set, and this will also be one of the key things to keep in mind when putting together your persistence architecture:

Matching patterns connected to an anchor node
We all know that you can implement different database queries--such as the preceding example--in different kinds of database management systems. However, in most alternative systems, these types of queries would yield terrible performance on the live database management systems and potentially endanger the responsiveness of an entire application. The reaction of the relational database management industry, therefore, has been to make sure that these kinds of queries will be done on precalculated, preformatted data that will be specifically structured for this purpose.
This means duplicating data, denormalizing data, and using techniques such as Extract, Transform, and Load (ETL), that are often used in business intelligence systems to create query-specific representations (sometimes also referred to as cubes) for the data at hand. Obviously, these are valuable techniques--the business intelligence industry would not be the billion-dollar industry that it is otherwise--but they are best suited for working with data that can be allowed to be more stale, less than up-to-date. Graph databases will allow you to answer a wider variety of these complex queries, between a web request and web response, on data that will not have to be replicated as much and therefore will be updated in near real time.
Another type of query that is extremely well-suited for graph databases is a query where you will be looking to find out how different data elements are related to each other. In other words, finding the paths between different nodes on your graph. The problem with such queries in other database management systems is that you will actually have to understand the structure of the potential paths extremely well. You will have to be able to tell the database how to jump from table to table, so to speak. In a graph database, you can still do that, but typically you won't. You just tell the database to apply a graph algorithm to a starting point and an endpoint and be done with it. It's up to the database to figure out if and how these data elements are connected to each other and return the result as a path expression for you to use in your system. The fact that you are able to delegate this to the database is extremely useful, and often leads to unexpected and valuable insights.
Obviously, the query categories mentioned are just that: categories. You would have to apply it to any of the fields of research that we discussed earlier in this chapter to really reap the benefits. We will come back to this in later chapters.
As we discussed earlier in this chapter, the whole concept of the category of Not Only SQL databases is all about task-orientation. Use the right tool for the job. So that must also mean that there are certain use cases that graph databases are not as perfectly suited for. Being a fan of graph databases at heart, this obviously is not easy for me to admit, but it would be foolish and dishonest to claim that graph databases are the best choice for every use case. It would not be credible. So, let's briefly touch on a couple of categories of operations that you would probably want to separate from the graph database category that Neo4j belongs to.
The following operations are where I would personally not recommend using a graph database like Neo4j, or at least not in isolation.
If you think back to what we discussed earlier and think about how graph databases achieve the performance that they do in complex queries, it will immediately follow that there are a number of cases where graph databases will still work, but not be as efficient. If you are trying to put together large lists of things effectively sets, that do not require a lot of joining or require a lot of aggregation (summing, counting, averaging, and so on) on these sets, then the performance of the graph database compared to other database management systems will be not as favorable. It is clear that a graph database will be able to perform these operations, but the performance advantage will be smaller, or perhaps even negative. Set-oriented databases such as relational database management systems will most likely give just as, or even more, performance.
As we discussed earlier, graph theory has done a lot of fascinating work on the analysis and understanding of graphs in their entirety. Finding clusters of nodes, discovering unknown patterns of relationships between nodes, and defining centrality and/or in-betweenness of specific graph components are extremely interesting and wonderful concepts, but they are very different concepts from the ones that graph databases excel at. These concepts are looking at the graph in its entirety and we refer to them as graph global operations. While graph databases are extremely powerful at answering graph local questions, there is an entire category of graph tools (often referred to as graph processing engines or graph compute engines) that look at the graph global problems.
Many of these tools serve an extremely specific purpose and even use specific hardware and software (usually using lots of memory and CPU horsepower) to achieve their tasks, and they are typically part of a very different side of the IT architecture. Graph processing is typically done in batches, in the background, over the course of several hours/days/weeks and would not typically be well placed between a web request and web response. It's a very different kind of ball game.
We mentioned that graphs and graph database management systems are great for complex queries--things that would make your relational system choke. As a consequence, simple queries, where write patterns and read patterns align to the aggregates that we are trying to store, are typically served quite inefficiently in a graph and would be more efficiently handled by an aggregate-oriented Key-value or Document store. If complexity is low, the advantage of using a graph database system will be lower too.
Hopefully, this gives you a better view of the things that graph databases are good at and not so good at.
Question 1: Graph theory is a very recent field in modern mathematics, invented in the late 20th century by Leonard Euler:
- True.
- False.
Question 2: Name one field that graphs are NOT used for in today's science/application fields:
- Route problems.
- Social studies.
- Accounting systems.
- Biological studies.
Question 3: Graphs are a very niche phenomenon that can only be applied to a very limited set of applications/research fields:
- True.
- False.
Question 4: Which other category of databases bears the most resemblance to graph databases?
- Navigational databases.
- Relational Databases.
- Column-family stores.
- None; graph databases are unique.
Question 5: The data model of graph databases is often described as the proprietary graph data model, containing nodes, relationships, and proprietary elements:
- True.
- False.
Question 6: Simple, aggregate-oriented queries yielding a list of things are a great application for a graph database.
- True.
- False.
In the first chapter of this book, we wanted to give you a first look at some of the concepts that underpin the subject of this book, the graph database Neo4j. We introduced the history of graphs, explained some of the principles that are being explored in the fascinating mathematical field of graph theory, and provided some examples of other academic and functional domains that have been benefiting from this rich, century-long history. The conclusion of this is plain and simple: graphs are everywhere. Much of our world is in reality, dependent on and related to many other things--it is densely connected, as we call it in graph terms. This, of course, has implications on how we work with the reality in our computer systems, how we store the data that describes reality in a database management system, and how we interact with the system in different kinds of applications.
In this chapter, we wanted to give you a bit of context before diving into the wonderful world of graph databases headfirst. It's a good idea, from an architect's point of view, to understand how graph database management systems like Neo4j came about, what problems they are trying to solve, what they are good at, and what they are perhaps less suited for.
With this in mind, we are now ready to get our hands dirty and start with actually playing around with Neo4j, the world's leading graph database.
In the next chapter, we will start applying this context to the specific part of computer science that deals with graph structures in the field of database management systems.