


Imagine you're working as an administrator of a large IT infrastructure. You just started receiving e-mails that a web application just stopped working. When you try to access the same page, it just doesn't load. What are the possibilities? Is it the router? Is it the firewall? Perhaps the machine hosting the page is down? Before you even start thinking rationally on what to do, your boss calls about the critical situation and demands explanations. In all this panic, you'll probably start plugging everything in and out of the network, rebooting the machine…and that doesn't help.
After hours of nervous digging into the issue, you've finally found the solution: the web server was working properly, but it would time out communication with the database server. This was because the machine with the DB did not receive the correct IP as yet another box ran out of memory and killed the DHCP server on it. Imagine how much time it would take to find all that manually? It would be a nightmare if the database server was in another branch of the company or in a different time zone and perhaps guys over there were still sleeping.
But what if you had Nagios up and running across your entire company? You would just go to the web interface and see that there are no problems with the web server and the machine on which it is running. There would also be a list of issues—the machine serving IP addresses to the entire company does not do its job and the database is down. If the setup also monitored the DHCP server itself, you'd get a warning e-mail that little swap memory is available on it or too many processes are running. Maybe it would even have an event handler for such cases to just kill or restart noncritical processes. Also, Nagios will try to restart the dhcpd process over the network in case it is down.
In the worst case, Nagios would speed up hours of investigation to 10 minutes. In the best case, you would just get an e-mail that there was such a problem and another e-mail that it's already fixed. You would just disable a few services and increase the swap size for the DHCP machine and solve the problem once and for all. Nobody would even notice that there was such a problem.
Nagios is a tool for system monitoring. It means that Nagios watches computers or devices on your network and ensures that they are working as they should. Nagios constantly checks if other machines are working properly. It also verifies that various services on those machines are working fine. In addition, Nagios accepts other processes or machines reporting their status, for example, a web server can directly report if it is not overloaded to Nagios.
The main purpose of system monitoring is to detect as soon as possible any system that is not working properly so that users of that system will not report the issue to you first.
System monitoring in Nagios is split into two categories of objects: hosts and services. Hosts represent a physical or virtual device on your network (servers, routers, workstations, printers, and so on). Services are particular functionalities, for example, a Secure Shell (SSH) server (sshd process on the machine) can be defined as a service to be monitored. Each service is associated with a host on which it is running. In addition, machines can be grouped into host groups.

A major benefit of Nagios' performance checks is that it only uses four distinct states—Ok, Warning, Critical, and Unknown. It is also based on plugins—this means if you want to check something that's not yet possible to do, you just need to write a simple piece of code, and that's it!
The approach to only offer three states allows administrators to ignore monitoring values themselves and just decide on what the warning/critical limits are. This is a proven concept, and is far more efficient than monitoring graphs and analyzing trends. For example, system administrators tend to ignore things such as gradually declining storage space. People often simply ignore the process until a critical process runs out of disk space. Having a strict limit to watch is much better, because you always catch a problem regardless of whether it turns from warning to critical in 15 minutes or in a week. This is exactly what Nagios does. Each check performed by Nagios is turned from numeric values (such as the amount of disk space or CPU usage) to one of the three possible states.
Another benefit is a report stating that X services are up and running, Y are in warning state, and Z are currently critical, which is much more readable than a matrix of values. It saves you the time of analyzing what's working and what's failing. It can also help prioritize what needs to be handled first, and which problems can be handled later.
Nagios performs all of its checks using plugins. These are external components for which Nagios passes information on what should be checked and what the warning and critical limits are. Plugins are responsible for performing the checks and analyzing results. The output from such a check is the status (working, questionable, or failure) and additional text describing information on the service in details. This text is mainly intended for system administrators to be able to read the detailed status of a service.
Nagios comes with a set of standard plugins that allow performance checks for almost all services your company might offer. See Chapter 4, Using the Nagios Plugins, for detailed information on plugins that are developed along with Nagios. Moreover, if you need to perform a specific check (for example, connect to a Web service and invoke methods), it is very easy to write your own plugins. And that's not all—they can be written in any language and it takes less than 15 minutes to write a complete check command! Chapter 11, Programming Nagios, talks about that ability in more detail.
There are many reasons for you to ensure that all your resources are working as expected. If you're still not convinced after reading the introduction to this chapter, here are a few important points why it is important to monitor your infrastructure.
The main reason is quality improvement. If your IT staff can notice failures quicker by using a monitoring tool, they will also be able to respond to them much faster. Sometimes it takes hours or days to get the first report of a failure even if many users bump into errors. Nagios ensures that if something is not working, you'll know about it. In some cases, event handling can even be done so that Nagios can switch to the backup solution until the primary process is fixed. A typical case would be to start a dial-up connection and use it as a primary connection in cases when the company VPN is down.
Another reason is much better problem determination. Very often what the users report as a failure is far from the root cause of the problem, such as an email system is down due to the LDAP service not working correctly. If you define dependencies between hosts correctly, then Nagios will point out that the POP3 e-mail server is assumed to be "not working" because the LDAP service that it depends upon has a problem. Nagios will start checking the e-mail server as soon as the problem with LDAP has been resolved.
Nagios is also very flexible when it comes down to notifying people of what isn't functioning correctly. In most cases, your company has a large IT team or multiple teams. Usually, you want some people to handle servers, others to handle network switches/routers/modems. There might also be a team responsible for network printers or a division is made based on geographical locations. You can instruct Nagios on who is responsible for particular machines or groups of machines, so that when something is wrong, the right people will get to know of it. You can also use Nagios' web interface to manage who is working on what issue.
Monitoring resources not only is useful for finding problems, but also saves you from having them—Nagios handles warnings and critical situations differently. This means that it's possible to be aware of situations that may become problems really soon. For example, if your disk storage on an e-mail server is running out, it's better to be aware of this situation before it becomes a critical issue.
Monitoring can also be set up on multiple machines across various locations. These machines will then communicate all their results to a central Nagios server so that information on all hosts and services in your system can be accessed from a single machine. This gives you a more accurate picture of your IT infrastructure, as well as allows testing more complex systems such as firewalls. For example, it is vital that a testing environment is accessible from a production environment, but not the other way around.
It is also possible to set up a Nagios server outside the company's intranet (for example, over a dedicated DSL) to make sure that traffic from the Internet is properly blocked. It can be used to check if only certain services are available, for example, verify that only SSH and Hypertext Transfer Protocol (HTTP) are accessible from external IP addresses, and that services such as databases are inaccessible to users.
Nagios' main strength is flexibility—it can be configured to monitor your IT infrastructure in the way you want it. It also has a mechanism to react automatically to problems and has a powerful notification system. All of this is based on a clear object definition system, which in turn is based on a few types of objects, shown as follows:
Commands: These are definitions of how Nagios should perform particular types of checks. They are an abstraction layer on top of actual plugins that allow you to group similar types of operations.
Time periods: These are date and time spans at which an operation should or should not be performed. For example, Monday–Friday, 09:00–17:00.
Hosts and host groups: These are devices along with the possibility to group hosts. A single host might be a member of more than one group.
Services: These are various functionalities or resources to monitor on a specific host. For example, CPU usage, storage space, or Web server.
Contacts and contact groups: These are people that should be notified with information on how and when they should be contacted; contacts can be grouped, and a single contact might be a member of more than one group.
Notifications: These define who should be notified of what, for example, all errors for the linux-servers host group should go to the linux-admins contact group during working hours and to the critsit-team contact group outside of working hours. Notifications are not strictly an object, but a combination of all the preceding objects and are an essential part of Nagios.
Escalations: These are an extension to notifications; they define that after an object is in same state for specific period of time, other people should get notified of certain events—for example, a critical server being down for more than 4 hours should alert IT management so that they track the issue.
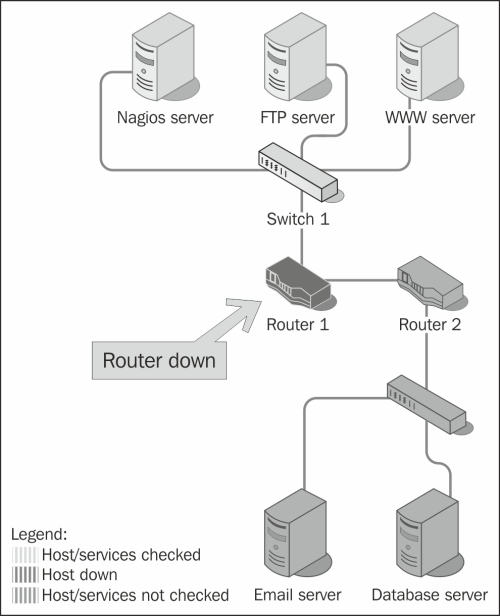
A beneficial feature of using Nagios is that it is a mature dependency system. For any administrator, it is obvious that if your router is down, then all machines accessed via it will fail. Some systems don't take that into account, and in such cases, you get a list of several failing machines and services. Nagios allows you to define dependencies between hosts to reflect actual network topology. For example, if a router that connects you to the rest of your network is down, Nagios will not perform checks for the subsequent parts and machines that are dependent on the router. This is illustrated in the following figure:
You can also define that a particular service depends on another service, either on the same host or a different host. In case one of the dependent services is down, a check for a service is not even performed.
For example, in order for your company's intranet application to function properly, both an underlying Web server and database server must be running properly. So, if a database service is not working properly, Nagios will not perform checks and/or not send notifications that your application is not working, because the root cause of the problem is that the database is not working properly. The database server might be on the same host or a different host. If the database is not working properly, if the dependent machine is down or not accessible, all services dependent on the database service will not be checked as well.
Nagios offers a consistent system of macro definitions. These are variables that can be put into all object definitions and depend on the context. They can be put inside commands, and depending on the host, service, and many other parameters, macro definitions are substituted accordingly. For example, a command definition might use an IP address of the host it is currently checking in all remote tests. It also makes it possible to put information such as the previous and current status of a service in a notification e-mail. Nagios 3 also offers various extensions to macro definitions, which make it an even more powerful mechanism.
Nagios also offers mechanism for scheduling planned downtimes. This is mainly used when maintenance of the IT infrastructure is to be carried out, and servers and/or services they provide are out of order for a period of time. You can let Nagios know that such an event will occur, and it will not send notifications about problems with hosts and/or services that have a scheduled downtime. In such cases, dependencies are also taken into consideration—if a database has a scheduled downtime, notifications for the services that depend on it will not be sent out. Nagios can also notify people of planned downtimes automatically. This allows creating an integrated process of scheduling downtimes that will also handle informing users.
Nagios works by checking if a particular host or service is working correctly and storing its status. Because the status of a service is only one of our possible values, it is crucial that it actually reflects what the current status is. In order to avoid detecting random and temporary failures, Nagios uses soft and hard states to describe what the current status is for a host or service.
Imagine that an administrator is restarting a Web server, and this operation makes connecting to the webpages unavailable for 5 seconds. Since such restarts are usually done at night to lower the number of users affected, this is an acceptable period of time. However, a problem might be that Nagios will try to connect to the server and notice it is actually down. If it would only rely on a single result, Nagios could trigger an alert that a Web server is down. It would actually be up and running again in a few seconds, but it could take a couple of minutes for Nagios to find that out.
To handle situations where a service is down for a very short time, or the test has temporarily failed, soft states were introduced. When a previous status of a check is unknown or is different from the previous one, Nagios will re-test the host or service a couple of times to make sure the change is permanent. Nagios assumes that the new result is a soft state. After additional tests have verified that the new state is permanent, it is considered a hard state.
Each host and service check defines the number of retries to perform before assuming a change is permanent. This allows more flexibility over how many failures should be treated as an actual problem instead of a temporary one. Setting the number of checks to 1 will cause all changes to be treated as hard instantly. The following figure is an illustration of soft and hard state changes, assuming that number of checks to be performed is set to 3:
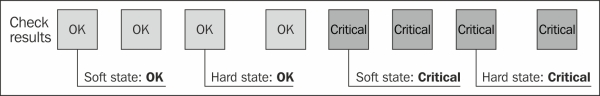
This feature is very useful for checks that should skip short outages of a service or use a protocol that might fail in case of extensive traffic—such as ICMP or UDP. Monitoring devices over SNMP is also an example of a check that can fail in cases where a single check fails; nevertheless, the check will eventually succeed during the second or third check.
The 4.0 version of Nagios is a major release, and many changes have been made since the release of Nagios 3 in 2008. This version contains both new features and multiple improvements to existing functionality.
Nagios has also changed its name —it is now called Nagios Core, which is used to indicate the core, open source project for monitoring. This was also needed as more commercial solutions using Nagios were introduced. However, Nagios Core is still often referred to as simply Nagios, and throughout this book, any reference to Nagios indicates Nagios Core.
This release introduces a new element of Nagios—libnagios.
It provides many data structures and algorithms that Nagios has already been using and allows using it in third-party applications and add-ons. This is especially useful for plugins and applications that communicate with Nagios, because they can depend on the library already being installed and can benefit from implementations optimized for performance. This functionality is described in more detail in Chapter 11, Programming Nagios, and Chapter 12, Using the Query Handler.
Another new feature is the query handler—it is a generic mechanism for communicating between the Nagios service and add-ons. It is a two-way communication protocol using Unix sockets for sending and receiving data.
It can be used to communicate with various parts of Nagios and allows easy integration with third-party solutions, such as allowing an application to run checks instead of a plugin. It can be used also for retrieving updates from service or host checks, and allows registering an application as the handler for a check or notification. The Nagios Event Radio Dispatcher (NERD), which works on top of the query handler, also allows subscribing to host and service status changes and updates.
Chapter 12, Using the Query Handler, talks about the query handler and NERD in more detail, as well as shows actual examples of using it.
Nagios 4 has introduced several minor features and improvements. Nagios 4 handling for hosts and services has been combined—this means that performing checks, sending notifications, and running events works the same for both types of objects. It is also possible to specify a parent service, which indicates dependencies between services, similar to how it works now for hosts.
An important goal of the Nagios 4 release is to improve Nagios' stability and scalability. Many parts of the Nagios internals have been optimized in terms of CPU and memory usage.
Previous versions of Nagios (up to 3.x) have worked as a single Nagios process, starting child processes to perform checks, notifications, and event handlers. This becomes an issue when running a large number of child processes because of how Unix operating systems create child processes—a process using a lot of memory consumes more resources to start a child process. Nagios 4 uses its main process for scheduling events and multiple worker processes for running the child processes. The workers do not use many resources, and are able to spawn child processes much faster.
Multiple components of Nagios were also optimized for performance. The event processing, macro expansion, and configuration parsing are now much faster, which improves startup time for Nagios as well as regular operations.
Nagios 4 also introduces a few backward incompatibilities. First, embedded Perl has been removed. This includes the Perl support, as well as all options related to it. The main reason was that this feature has caused many problems related to memory leaks, and disabling it has improved Nagios performance. This is also related to the new approach that Nagios worker processes mentioned earlier in the chapter.
It is no longer possible to define groups that include each other, that is, hostgroup1 including hostgroup2 and vice versa. This used to work in previous Nagios versions, but generates an error in Nagios 4.
The obsess_over_host and obsess_over_service options were merged as the obsess option. In Nagios 4, they are defined as aliases and will be removed in future versions of Nagios. Also, setting host and service obsess to different values is no longer possible.
All of the changes mentioned earlier in this section make Nagios 4 much less resource intensive. This allows monitoring more services and hosts without additional investment in servers. Thus, you should consider upgrading your Nagios setup even if you do not plan on using any of the new features.
In this chapter, we learned the basics of Nagios as a tool for performing system monitoring. It can be used to ensure that services are working correctly, problems are detected earlier, and appropriate people are aware when something's wrong.
We learned the basic types of objects in Nagios— commands, hosts, services, time periods, contacts, as well as object grouping. We have also found out about notifications and escalations, which can be used to notify administrators about problems.
The chapter also introduced the concept of dependencies that helps in understanding the root cause of complex problems.
We also learned the most important changes that Nagios 4 brings and how they can be used.
The next chapter will guide us through the process of setting up and configuring Nagios and the standard Nagios plugins.