


There has always been the need to quickly create user interface widgets that specialize in providing a specific service for a user or a group of users. The team at Wijmo has made a library of such widgets readily available for customized usage. This book focuses on introducing most of the common widgets and how they are used. Instant Wijmo Widgets How-to approaches tasks via a step-wise process that makes the reader's learning and practice experience worthwhile.
According to Wikipedia, a bar chart or bar graph is a chart with rectangular bars with lengths proportional to the values that they represent. The bars can be plotted vertically or horizontally. A vertical bar chart is sometimes called a column bar chart.
Before we fully jump into bar charts, it is important to have some insight into Wijmo dependencies and how to reference them in our source code.
|
Wijmo Dependency |
Download URL |
|---|---|
|
Wijmo Complete CDN (87 KB) | |
|
Wijmo Open CDN (52 KB) | |
|
jQuery 1.7.1 (minified) | |
|
jQuery UI (minified) |
http://ajax.aspnetcdn.com/ajax/jquery.ui/1.8.17/jquery-ui.min.js |
|
Wijmo complete CSS |
http://cdn.wijmo.com/jquery.wijmo-complete.all.2.0.0.min.css |
|
Wijmo theme CSS |
Having listed the requisite Wijmo dependencies, we will see how to reference them in any project and customize them further. All the latest dependencies can be found at http://wijmo.com/downloads/#wijmo-cdn.
Create an HTML file and reference the dependencies listed in the preceding table. We can achieve this by inserting the links listed in the preceding table.
<html>
    <head>
  <!--jQuery References-->
  <script src="http://ajax.aspnetcdn.com/ajax/jquery/jquery-1.7.1.min.js"
       type="text/javascript"></script>
  <script src="http://ajax.aspnetcdn.com/ajax/jquery.ui/1.8.17/jquery-ui.min.js" type="text/javascript"></script>
  <!--Wijmo Widgets JavaScript-->
  <script src="http://cdn.wijmo.com/jquery.wijmo-open.all.2.0.0.min.js"
       type="text/javascript"></script>
  <script src=http://cdn.wijmo.com/jquery.wijmo-complete.all.2.0.0.min.js"
      type="text/javascript"></script>
 <!--Theme-->
 <link href="http://cdn.wijmo.com/themes/rocket/jquery-wijmo.css" rel="stylesheet"
      type="text/css" title="rocket-jqueryui" />
 <!--Wijmo Widgets CSS-->
 <link href="http://cdn.wijmo.com/jquery.wijmo-complete.all.2.0.0.min.css"
 rel="stylesheet" type="text/css" />
    </head>
    <body></body>
</html>
The
wijbarchartobject needs a target in the HTML document to render itself to. Create adivtag within the HTML tags, with a reference ID or class forwijbarchartto render to.<div id="wijbarchart" class="ui-widget ui-widget-content ui-corner-all" style="width: 400px;height: 300px"></div>
Let us initialize the
wijbarchartobject and populate it with some data. This can be achieved via the following jQuery code:<script id="scriptInit" type="text/javascript"> //wait for the page to completely load… $(document).ready(function () { $("#wijbarchart").wijbarchart({ //define the values for x and y axes… axis: { y: { text: "Total Automobile Sales (Per Hundred Thousand)" }, x: { text: "" } }, //the hint will display on hover of the chart hint: { content: function () { return this.data.label + '\n ' + this.y + ''; } }, //The chart's title or header header: { text: "US Toyota Automobile Statistics (Dummy Data)" }, //seriesList defines the label, legend and data for x and y… seriesList: [{ label: "US", legendEntry: true, data: { x: ['Toyota Camry', 'Toyota Corolla', 'Toyota Sienna'], y: [12.35, 21.50, 30.56] } }], //define the color, stroke and opacity for the chart seriesStyles: [{ fill: "#8ede43", stroke: "#7fc73c", opacity: 0.8 }], seriesHoverStyles: [{ "stroke-width": "1.5", opacity: 1 }] }); }); </script>Now we save the code and run the widget by launching the HTML file in any web browser of our choice. The
wijbarchartobject shown will be similar to the following screenshot:
There are various aspects of the wijbarchart object one might want to customize. Let us customize the appearance of the wijbarchart object by changing the color of the bars, applying some gradient to it, and specifying the opacity.
Changing the appearance of a Wijmo bar chart is easily achievable by updating the seriesStyles property as follows:
  seriesStyles: [{
                fill: "40-#BD0070-#718680", stroke: "#1261C0", opacity: 0.5
               }]
The fill property of the object in the seriesStyles array is set to the gradient value "40-#BD0070-#718680". If we run the code after replacing the previous seriesStyles value with the new one, we will have something like this:

Another useful customization is the ability to rotate labels on the axes. This will slant the labels in a specified angle of your choice. To achieve this, we would have to update the axis property of our wijbarchart object as follows:
axis: {
                y: {
                    text: "Total Automobile Sales",

                },
                x: {
                    text: "",
                    labels: {
                        style: {
                            rotation: -45
                        }
                    }
                }
            },
Applying this axis property update to our wijbarchart object and running it will render a widget similar to this:

This completes our section on creating a simple Wijmo bar chart widget. This has obviously been a simple and painless process. We set up all references or links to the requisite Wijmo files, which are available and hosted in the Wijmo CDN, as listed in the preceding table. We continued to develop the wijbarchart object by setting the various configurations required for a proper widget display, such as the axis, hint, header, seriesList, seriesStyles, and seriesHoverStyles properties.
These configurations, also known as options, are not the only ones available for creating a bar chart widget. The team at Wijmo actually did create a ton of options for user customizations; a few useful Wijmo bar chart options are listed as follows:
animation: This option handles all animation effects, such as easing and duration. All charts are animated by default. By animation, I refer to the duration for completely drawing the chart. Its default value is{enabled: true, duration: 400}.Here is an example of how to use the
animationproperty:$("#wijbarchart).wijbarchart({ animation:{ enabled:true, duration:800 }... });footer: This option designates the footer of the chart widget. Its default value is{visible:false, style:{fill:"#fff", stroke:"none"}, textStyle:{fill:"#000", stroke:"none"}, compass:"south", orientation:"horizontal"}.Here is an example of how to use the
footerproperty:$("#wijbarchart").wijbarchart({ footer: { text:"widget footer", style:{ fill:"#f1f1f1", stroke:"#010101" } } });horizontal: This option value determines whether to render a horizontal or vertical bar chart. Its default value istrue.Here is an example of how to use the
horizontalproperty:$("#wijbarchart).wijbarchart({ horizontal: true });
For more information on Wijmo bar chart options, please visit the Wijmo bar chart wiki at http://wijmo.com/wiki/index.php/Barchart.
A column bar chart widget is slightly different from the regular bar chart widget we previously created. Remember we also had a look at some of the useful and common options used by most Wijmo developers. The last one we listed was the horizontal option of type Boolean. The default value of the horizontal option is true. This implies that the bar chart will be rendered in a horizontal layout by default.
For the creation of our first column bar chart, we shall proceed by setting the horizontal option to false, using the same code used for the previous bar chart we had created. Here's our new complete code:
<html>
    <head>
<!--jQuery References-->
<script src="http://ajax.aspnetcdn.com/ajax/jquery/jquery-1.7.1.min.js" type="text/javascript"></script>
<script src="http://ajax.aspnetcdn.com/ajax/jquery.ui/1.8.17/jquery-ui.min.js" type="text/javascript"></script>
<!--Wijmo Widgets JavaScript-->
<script src="http://cdn.wijmo.com/jquery.wijmo-open.all.2.0.0.min.js" type="text/javascript"></script>
<script src="http://cdn.wijmo.com/jquery.wijmo-complete.all.2.0.0.min.js" type="text/javascript"></script>
<!--Theme-->
<link href="http://cdn.wijmo.com/themes/rocket/jquery-wijmo.css" rel="stylesheet" type="text/css" title="rocket-jqueryui" />
<!--Wijmo Widgets CSS-->
<link href="http://cdn.wijmo.com/jquery.wijmo-complete.all.2.0.0.min.css" rel="stylesheet" type="text/css" />
</head>
<body>
<div id="wijbarchart" class="ui-widget ui-widget-content ui-corner-all" style="width: 400px;
height: 300px">
</div>

<script id="scriptInit" type="text/javascript">
        $(document).ready(function () {
    //activating the wijbarchart function on #wijbarchart
            $("#wijbarchart").wijbarchart({
            horizontal: false,//makes it vertical
            axis: { //set up the x and y axes
                y: {
                    text: "Total Automation Sales",

                },
                x: {
                    text: "",
                    labels: {
                        style: {
                            rotation: -45
                        }
                    }
                }
            },

                hint: { //hint text when hovering over chart
                    content: function () {
                        return this.data.label + '\n ' + this.y + '';
                    }
                },

                header: {//chart title
                    text: "US Toyota Automobile Statistics (Dummy Data)"
                },
       //data for chart representing each column
                seriesList: [{
                    label: "US",
                    legendEntry: true,
                    data: { x: ['Toyota Camry', 'Toyota Corolla', 'Toyota Sienna'], y: [12.35, 21.50, 30.56] }
                }],

               seriesStyles: [{
                fill: "40-#BD0070-#718680", stroke: "#1261C0", opacity: 0.7
               }],

                seriesHoverStyles: [{ "stroke-width": "1.5", opacity: 1
                }]
            });
        });
    </script>
    </body>
</html>
Notice from the preceding code, which we will hereon refer to as the main code, that we set the horizontal option to false. Now, when we run the main code, we should see a column bar chart widget as follows:

That's how simple switching from a regular bar chart to a column bar chart is. The choice between either of the two bar charts is usually dependent on user preference.
We reference the Wijmo dependencies as follows:
After the page loads, we set the
horizontalproperty tofalse.The
xandyproperties are set, andyis rotated at-45degrees, which rotates the labels for Toyota Camry, Toyota Corolla, and Toyota Sienna.We set the
hintproperty, which is displayed on hovering over the chart.We set the
headerproperty, which is displayed atop the grid.For the
seriesListproperty, we have adatasubproperty that holds data forxandy. These values are mapped one-to-one in such a way thatx['Toyota Camry']getsy[0]ory[12.35].For the
seriesStylesproperty, we set the gradient color as"40-#BD0070-#718680"and set theopacityvalue as0.7.
A stacked bar chart is a graph that is used to compare the parts that make up the whole. Each bar in the chart or graph is divided into other groupings, classifications, or combinations.
Assuming we want to compare the sex ratios of males and females in certain sports, we could have them as follows:
Bar A (Soccer): Boys 75% | Girls 25%
Bar B (Tennis): Boys 50% | 50%
Bar C (Swimming): Boys 45% | Girls 55%
The preceding statistics can be represented in a stacked bar chart. It is important to note that the major difference between a stacked and a regular bar chart is the seriesList property or option. Secondly, there's the addition of a new Boolean option called stacked, which should be set to true.
In an attempt to represent the preceding analytics via a Wijmo widget, we are going to modify our main code's document ready function as follows:
$(document).ready(function () {
            $("#wijbarchart").wijbarchart({
            stacked: true, //making a stacked bar chart
            axis: { //set up the x and y axes text and labels
                y: {
                    text: "Engagement Ratio",

                },
                x: {
                    text: "",
                    labels: {
                        style: {
                            rotation: -45
                        }
                    }
                }
            },

            hint: { //text to display on hover of chart
                 content: function () { //returns the label and y position
                      return this.data.label + '\n ' + this.y + '';
                 }
            },

            header: { //title of chart
                text: "US Sports Engagement Ratio"
            },

            seriesList: [{ //seriesList stores label and corresponding data
                label: "Soccer",
                legendEntry: true,
                data: { x: ['Boys', 'Girls'], y: [75, 25] }
            },{
                label: "Tennis",
                legendEntry: true,
                data: { x: ['Boys', 'Girls'], y: [50, 50] }
            }, {
                label: "Swimming",
                legendEntry: true,
                    data: { x: ['Boys', 'Girls'], y: [45, 55] }
                }],


            seriesStyles: [{ //set fill colors for bar chart
                fill: "#8ede43", stroke: "#7fc73c", opacity: 0.8
            }, {
                fill: "#6aaba7", stroke: "#5f9996", opacity: 0.8
            }, {
                fill: "#466a85", stroke: "#3e5f77", opacity: 0.8
            }],


            seriesHoverStyles: [{ "stroke-width": "1.5", opacity: 1
            }]
        });
    });
We updated the seriesList property of the wijbarchart object to contain the engagement ratio data for the boys and girls for each of the sports. If you successfully edit the code and run it, you'll have something like this:

We reference the Wijmo dependencies.
After the page loads, we set the
stackedproperty totrue.The
xandyproperties are set, andyis rotated at-45degrees, which rotates the labels for boys and girls.We set the
hintproperty, which is displayed on hovering over the chart.We set the
headerproperty, which is displayed atop the chart.For the
seriesListproperty, we have adatasubproperty that holds data forxandy. These values are mapped one-to-one in such a way thatx['Boys']getsy[0]ory[75].Note that the
stackedoption is set tofalseby default and updating it totruemakes thewijbarchartobject a stacked one.
To illustrate stacked bar charts with a more complex example, we are going to modify our original main code to create a stacked bar chart widget. Let's insert the following code snippet between our script tags:
    $(document).ready(function () {
            $("#wijbarchart").wijbarchart({

            stacked: true, //ensures we have a stacked bar chart
            axis: { //set the text and labels for x and y axes
                y: {
                    text: "Total Automobile Sales"
                },
                x: {
                    text: "",
                    labels: {
                        style: {
                            rotation: -45
                        }
                    }
                }
            },

                hint: { //hint to display on hover of bar chart
                    content: function () {
                        return this.data.label + '\n ' + this.y + '';
                    }
                },

                header: { //bar chart title
                    text: "US Toyota Automobile Statistics (Dummy Data)"
                },

                seriesList: [{ //list of data, legend and label for chart
                    label: "US",
                    legendEntry: true,
                    data: { x: ['Toyota Camry', 'Toyota Corolla', 'Toyota Sienna'], y: [12.35, 21.50, 30.56] }
                }],
              seriesList: [{
                    label: "US",
                    legendEntry: true,
                    data: { x: ['Toyota Camry', 'Toyota Corolla', 'Toyota Sienna'], y: [12.35, 21.50, 30.56] }
                }, {
                    label: "Japan",
                    legendEntry: true,
                    data: { x: ['Toyota Camry', 'Toyota Corolla', 'Toyota Sienna'], y: [4.58, 1.23, 9.67] }
                }, {
                    label: "Other",
                    legendEntry: true,
                    data: { x: ['Toyota Camry', 'Toyota Corolla', 'Toyota Sienna'], y: [31.59, 37.14, 65.32] }
                }],


                seriesStyles: [{ //fill color...
                    fill: "#8ede43", stroke: "#7fc73c", opacity: 0.8
                }, {
                    fill: "#6aaba7", stroke: "#5f9996", opacity: 0.8
                }, {
                    fill: "#466a85", stroke: "#3e5f77", opacity: 0.8
                }],


                seriesHoverStyles: [{ "stroke-width": "1.5", opacity: 1
                }]
            });
        });
When we run the preceding code after a proper insertion and successful formatting, we see a widget that looks similar to the following screenshot:

The preceding chart is what a stacked bar chart should look like, and this tells us how many Toyota cars were sold in the US, Japan, and other countries. However, as the title depicts, the chart focuses on US sales.
Note
The preceding chart compares the sales in the US, Japan, and other countries. Hence, we see that Toyota Sienna has the highest sales both in the US and overseas.
We can also see that Toyota Corolla has the lowest overall sales in Japan, and Toyota Sienna has its largest sales in other countries—quite a bit more than the sum of Sienna sales in the US and Japan.
This recipe concentrates on a major and common widget for animations, known as the wijexpander. We will also see how to pass, handle, and manage live data via a Wijmo widget, which will in turn provide useful information to the users.
The wijexpander object works in a way that allows the user to expand a bar or region, which could be a div HTML element, and have visibility into embedded web content such as a web page like CNN. We will see how to use the wijexpander object to display embedded web content via a given URL. Copy or recreate the following code:
<html>
<head>
<!--jQuery References-->
<script src="http://ajax.aspnetcdn.com/ajax/jquery/jquery-1.7.1.min.js" type="text/javascript"></script>
<script src="http://ajax.aspnetcdn.com/ajax/jquery.ui/1.8.17/jquery-ui.min.js" type="text/javascript"></script>
<!--Wijmo Widgets JavaScript-->
<script src="http://cdn.wijmo.com/jquery.wijmo-open.all.2.0.0.min.js" type="text/javascript"></script>
<script src="http://cdn.wijmo.com/jquery.wijmo-complete.all.2.0.0.min.js" type="text/javascript"></script>
<!--Theme-->
<link href="http://cdn.wijmo.com/themes/rocket/jquery-wijmo.css" rel="stylesheet" type="text/css" title="rocket-jqueryui" />
<!--Wijmo Widgets CSS-->
<link href="http://cdn.wijmo.com/jquery.wijmo-complete.all.2.0.0.min.css" rel="stylesheet" type="text/css" />
<style type="text/css">
    #my-wij-expander
    {
        width: 550px;
    }
    #webpage-content{
      height: 350px;
    }
</style>

</head>
<body>
<div id="my-wij-expander">
    <h3>cnn.com</h3>
    <div id="webpage-content"></div>
</div>

<script id="scriptInit" type="text/javascript">
    $(document).ready(function () {
        $("#my-wij-expander").wijexpander({
            contentUrl: "http://www.cnn.com",
            expandDirection: "top" //This expands the element
        });
    });
</script>
</html>First of all, we reference all the requisite code we need to run Wijmo.
Next, we create a
divtag where the referenced URL content from CNN will be embedded.Then, we create a script that instantiates a
wijexpanderwidget by applying the necessary configurations for our expected expansion behavior and referencing the URL with which we intend to display its content.Lastly, we add some basic styling to our content areas. If the code runs successfully, we should have a
wijexpanderobject similar to the following screenshot:
Clicking on the expansion arrow will collapse the gray
divarea, thereby revealing the hidden URL content (CNN in this case) as follows:
Here are a few other common options or configurations that would help you further customize your wijexpander widget:
disabled: This option determines whether to disable or enable the behavior of the widget. If set tofalse, the widget becomes enabled. An example is shown as follows:$("#myPrivateElement").wijexpander({ disabled: true });expandDirection: This option determines the direction that the content will expand to, as used in the preceding code. The available options for this property aretop,left,right, andbottom. An example is shown as follows:$("#my-wij-expander").wijexpander({ expandDirection: "left" });
Wijmo expanders also have events and callbacks that are activated before and/or after certain events. For more information on wijexpander widgets, visit the following link:
http://wijmo.com/wiki/index.php/Expander
Wijmo has claimed that all their charts have been optimized to support live data streaming. Data routinely gets fed into the widgets at any given frequency. This data automatically and continually recalculates and, subsequently, redraws the chart to convey useful desired information to the user. We will illustrate this using a Wijmo line chart, which displays information as a series of data points connected by straight point segments.
Enter the following code into your favorite code editor:
<html>
<head>
<!--jQuery References-->
<script src="http://ajax.aspnetcdn.com/ajax/jquery/jquery-1.7.1.min.js" type="text/javascript"></script>
<script src="http://ajax.aspnetcdn.com/ajax/jquery.ui/1.8.17/jquery-ui.min.js" type="text/javascript"></script>
<!--Wijmo Widgets JavaScript-->
<script src="http://cdn.wijmo.com/jquery.wijmo-open.all.2.0.0.min.js" type="text/javascript"></script>
<script src="http://cdn.wijmo.com/jquery.wijmo-complete.all.2.0.0.min.js" type="text/javascript"></script>
<!--Theme-->
<link href="http://cdn.wijmo.com/themes/rocket/jquery-wijmo.css" rel="stylesheet" type="text/css" title="rocket-jqueryui" />
<!--Wijmo Widgets CSS-->
<link href="http://cdn.wijmo.com/jquery.wijmo-complete.all.2.0.0.min.css" rel="stylesheet" type="text/css" />
<script id="scriptInit" type="text/javascript">
        var myX = [], myY = [];
        var randomValuesCount = 10;
        var duration = 3000;
        var dx = 0;
        var intervalRandomData = null;

        $(document).ready(function () {
            for (dx = 0; dx < randomValuesCount; dx++) {
                myX.push(dx);
//random Y data points
                myY.push(createRandomValue());
            }
      //Instantiating the wijlinechart on #wijlinechart
            $("#wijlinechart").wijlinechart({
                showChartLabels: false,
                width: 700,
                height: 425,
                shadow: false,
                animation: {
                    enabled: false
                },
                seriesTransition: {
                    enabled: false
                },
                legend: { visible: false },
                hint: { enable: false },
                header: { text: "Wijmo Live Data Simulation" },
                axis:
                {
                    y: { min: 0, max: 100, autoMin:false, autoMax: false }
                },
//creating the data points for the chart
                seriesList: [
                    {
                        data: {
                            x: myX,
                            y: myY
                        },
                        markers: {
                            visible: true,
                            type: "circle"
                        }
                    }
                ],
                seriesStyles: [{ "stroke-width": 3, stroke: "#00a6dd"}],
                seriesHoverStyles: [{ "stroke-width": 4}]

            });

            doAnimate();

            intervalRandomData = setInterval(function () {
                $("#wijlinechart").wijlinechart("addSeriesPoint", 0, { x: dx++, y: createRandomValue() }, true); //keep adding points to the series
                doAnimate();
            }, duration);
        });

        function doAnimate() {
            var path = $("#wijlinechart").wijlinechart("getLinePath", 0), //handle to the path
                markers = $("#wijlinechart").wijlinechart("getLineMarkers", 0), //handle to the markers
                box = path.getBBox(),
                width = $("#wijlinechart").wijlinechart("option", "width") / 10,
                anim = Raphael.animation({transform: Raphael.format("...t{0},0", -width)}, duration); //how we want to animate. The animation mechanism is referenced by variable anim.
            path.animate(anim); //animate the path using anim.
            if (path.shadow) {
                var pathShadow = path.shadow;
                pathShadow.animate(anim);
            }
            markers.animate(anim); //without this line, the markers will not animate or move along with the path. We also want to animate the markers using anim.
          var rect = box.x + " " + (box.y - 5) + " " + box.width + " " + (box.height + 10); //Comment A
            path.wijAttr("clip-rect", rect); //Comment B
            markers.attr("clip-rect", rect); //Comment C
            //Comments A, B, and C code lines prevent the line chart animation from going outside the chart.
        }

        function createRandomValue() {
            var val = Math.round(Math.random() * 100);
            return val;
        }

    </script>
    </head>
    <body>
    <div>
        <div>
            <h2>Streaming Live Random Data</h2>
        </div>
        <div class="main">
            <div id="wijlinechart"></div>
            <div class="demo-options"></div>
        </div>
        <div class="footer">
            <p>
        This demo simulates streaming live randomized data using the <u>getLinePath</u> and <u>getLineMarkers</u> methods.
            </p>
        </div>
    </div>
</body>
</html>
If the preceding code runs successfully, we should have an animated chart that looks like this:
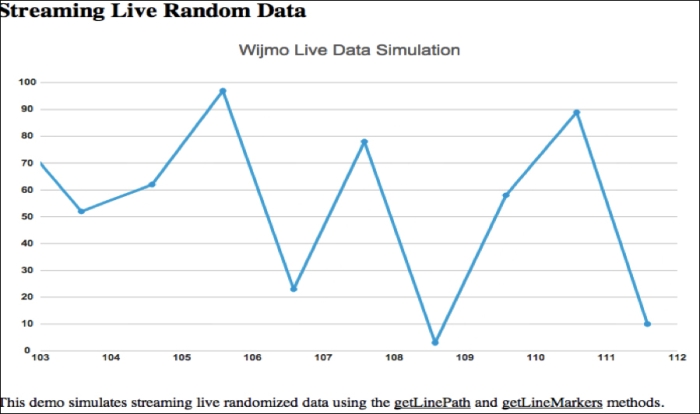
The preceding code that generated this animation is properly commented to give reasons as to why certain lines were coded the way they were. In a nutshell, anyone could customize the code to stream live data from a server or a constantly-fed spreadsheet or XML data, using the JavaScript calls within certain timed intervals. The JavaScript function setInterval() is also pretty helpful in achieving this.
Note
The preceding code is similar to the one found at http://wijmo.com/demo/explore/?widget=LineChart&sample=Streaming%20data.
A bubble chart is a chart whose data points are replaced with bubbles of various shapes and scattered across the chart. It is like a scatter chart. The Wijmo widget representing a bubble chart is referred to as a wijbubblechart object.
The data points or bubbles each have three non-dependent values, x, y, and y1 as follows:
The value
xdefines the Cartesian position along the x axisThe value
ydefines the Cartesian position along the y axisThe value
y1defines the bubble size at each point
Having understood a bubble chart and the three values that define the positions of the bubble, we can now happily proceed with an implementation. Let us create a wijbubblechart object of the percentage of college graduates in six major cities around the world. This is dummy data and doesn't reflect the actual relationship between college graduates and the health of the corresponding economy. However, this dummy data is based on the assumption that a city with more graduates per thousand will have a smarter economy. Also, this depends on the overall population of that city.
Enter the following code into your favorite code editor:
<html>
<head>
<!--jQuery References-->
<script src="http://ajax.aspnetcdn.com/ajax/jquery/jquery-1.7.1.min.js" type="text/javascript"></script>
<script src="http://ajax.aspnetcdn.com/ajax/jquery.ui/1.8.17/jquery-ui.min.js" type="text/javascript"></script>
<!--Wijmo Widgets JavaScript-->
<script src="http://cdn.wijmo.com/jquery.wijmo-open.all.2.0.0.min.js" type="text/javascript"></script>
<script src="http://cdn.wijmo.com/jquery.wijmo-complete.all.2.0.0.min.js" type="text/javascript"></script>
<!--Theme-->
<link href="http://cdn.wijmo.com/themes/rocket/jquery-wijmo.css" rel="stylesheet" type="text/css" title="rocket-jqueryui" />
<!--Wijmo Widgets CSS-->
<link href="http://cdn.wijmo.com/jquery.wijmo-complete.all.2.0.0.min.css" rel="stylesheet" type="text/css" />

<script type="text/javascript">
        $(document).ready(function () {

            $("#myWijbubblechart").wijbubblechart({
                showChartLabels: false,
                axis: {
                    y: {
                        text: "Smart Economy Rating"
                    },
                    x: {
                        text: "College Graduates(Per Thousand)"
                    }
                },
                hint: {
                    content: function () {
                        return this.data.label;
                    }
                },
                header: {
                    text: "College Graduates Vs. Health of the Economy - 2012"
                },
                seriesList: [{
                    label: "Beijing",
                    legendEntry: true,
                    data: { y: [85], x: [150], y1: [1340] },
                    markers: {
                        type: "tri"
                    }
                }, {
                    label: "New Delhi",
                    legendEntry: true,
                    data: { y: [80], x: [167], y1: [1150] },
                    markers: {
                        type: "diamond"
                    }
                }, {
                    label: "Los Angeles",
                    legendEntry: true,
                    data: { y: [92], x: [400], y1: [309] },
                    markers: {
                        type: "circle"
                    }
                }, {
                    label: "Tokyo",
                    legendEntry: true,
                    data: { y: [94], x: [250], y1: [126] },
                    markers: {
                        type: "invertedTri"
                    }
                }, {
                    label: "London",
                    legendEntry: true,
                    data: { y: [82], x: [200], y1: [140] },
                    markers: {
                        type: "cross"
                    }
                }, {
                    label: "Lagos",
                    legendEntry: true,
                    data: { y: [48], x: [374], y1: [72] },
                    markers: {
                        type: "box"
                    }
                }]
            });
        });
    </script>
    </head>

<body>
<div id="myWijbubblechart" class="ui-widget ui-widget-content ui-corner-all" style="width: 500px;
height: 300px">
</div>
</body>
</html>
If the preceding code is copied correctly and run in a browser, we should have a Wijmo bubble chart similar to the following screenshot:

To see how the
wijbubblechartobject works, we can simply examine one of the objects in theseriesListproperty, like this one:{ label: "Beijing", legendEntry: true, data: { y: [85], x: [150], y1: [1340] }, markers: { type: "tri" } },Remember that we already defined
x,y, andy1as the values of a point on the x axis, a point on the y axis, and the size of the bubble respectively. So in this case, for Beijing the value foryis set to85, and the size of the bubble,y1, is1340. ThelegendEntryproperty is set totrueso we can see Beijing in the legend area by the right of the chart.We can see the various bubbles in different shapes and a legend that tells what city each bubble represents. The
typeproperty of themarkersobject is responsible for setting the shape of the bubble.markers: { type: "tri" }
One more common aspect of the wijbubblechart object is the possibility of changing its appearance, for example, applying gradient colors, using some options, and so on. To achieve this we simply have to include a seriesStyles property as follows:
<script type="text/javascript">
$(document).ready(function () {
//instantiating wijbubblechart on #myWijbubblechart
$("#myWijbubblechart").wijbubblechart({
showChartLabels: false,
//setup the x and y axis labels
axis: {
y: {
text: "Smart Economy Rating"
},
x: {
text: "College Graduates(Per Thousand)"
}
},
//Display hint text on chart hover
hint: {
content: function () {
return this.data.label;
}
},
//title of chart
header: {
text: "College Graduates Vs. Health of the Economy - 2012"
},
//chart color fill styles
seriesStyles: [{
fill: "180-#8F8F8F-#C462AC", stroke: "#8F8F8F"
}, {
fill: "45-#C462AC-#2371B0", stroke: "#C462AC"
}, {
fill: "90-#4A067D-#0B7D19", stroke: "#4A067D"
}, {
fill: "270-#2371B0-#6AABA7", stroke: "#2371B0"
}, {
fill: "45-#0C85F0-#852E85", stroke: "#0C85F0"
}, {
fill: "180-#6AABA7-#AB6A9C", stroke: "#6AABA7"
}],
//data values for each bubble
seriesList: [{
label: "Beijing",
legendEntry: true,
data: { y: [85], x: [150], y1: [1340] },
    markers: {
                        type: "tri"
                    }
}, {
label: "New Delhi",
legendEntry: true,
data: { y: [80], x: [167], y1: [1150] },
markers: {
type: "diamond"
}
}, {
label: "Los Angeles",
legendEntry: true,
data: { y: [92], x: [400], y1: [309] },
markers: {
type: "circle"
}
}, {
label: "Tokyo",
legendEntry: true,
data: { y: [94], x: [250], y1: [126] },
markers: {
type: "invertedTri"
}
}, {
label: "London",
legendEntry: true,
data: { y: [82], x: [200], y1: [140] },
markers: {
type: "cross"
}
}, {
label: "Lagos",
legendEntry: true,
data: { y: [48], x: [374], y1: [72] },
markers: {
type: "box"
}
}]
});
});
</script>If we successfully run the preceding code, we should have a bubble chart that looks like this:

You can visit http://wijmo.com/wiki/index.php/Bubblechart for more details about Wijmo bubble charts and more advanced options available for customizing your charts.
The calendar Wijmo widget, referred to as wijcalendar, is one of the most straightforward widgets available. The wijcalendar object is a Wijmo calendar with customizable properties and configurations.
Here's a simple code that will generate a
wijcalendarobject:<html> <head> <!--jQuery References--> <script src="http://ajax.aspnetcdn.com/ajax/jquery/jquery-1.7.1.min.js" type="text/javascript"></script> <script src="http://ajax.aspnetcdn.com/ajax/jquery.ui/1.8.17/jquery-ui.min.js" type="text/javascript"></script> <!--Wijmo Widgets JavaScript--> <script src="http://cdn.wijmo.com/jquery.wijmo-open.all.2.0.0.min.js" type="text/javascript"></script> <script src="http://cdn.wijmo.com/jquery.wijmo-complete.all.2.0.0.min.js" type="text/javascript"></script> <!--Theme--> <link href="http://cdn.wijmo.com/themes/rocket/jquery-wijmo.css" rel="stylesheet" type="text/css" title="rocket-jqueryui" /> <!--Wijmo Widgets CSS--> <link href="http://cdn.wijmo.com/jquery.wijmo-complete.all.2.0.0.min.css" rel="stylesheet" type="text/css" /> <script type="text/javascript"> $(function () { $("#myWijCalendar").wijcalendar( { easing: "easeInQuad" } ); }); </script> <body> <div id="myWijCalendar" class="ui-widget ui-widget-content ui-corner-all" style="width: 500px;height: 300px"> </div> </body> </html>From the preceding script we target the
#myWijCalendarobject in the DOM, and callwijcalendar, which initializes the calendar widget and supplies"easeInQuad"to the easing property.Assuming there are no mistakes in the code, we should have a calendar widget that is similar to this:

For a list of common options that will help customize the wijcalendar object further, visit http://wijmo.com/wiki/index.php/Calendar.
A grid, in general, is similar to an Excel spreadsheet with headers per column and corresponding data per row or tuple. Customizations, edits, selections, and other forms of manipulations, such as calculations, can be carried out directly on the spreadsheet. Usually, such spreadsheets are used to gather information regarding a specific thing or event. The purpose of these grids is to visualize the relationships and correlation between data and, subsequently, to provide valuable information.
The wijgrid object is instantiated or, rather, created by the jquery.wijmo.wijgrid.js library.
First and foremost, wijgrid objects are dependent on the <table> HTML tag in a given document. So, we need to create a table and host our grid widget, the wijgrid object, on it. Here's one example of how to create a table in HTML:
//Example 1:
<table>
  <thead>
    <th>column0 Header</th>
    <th>column1 Header</th>
  </thead>
  <tbody></tbody>
</table>
Don't forget to wrap the preceding table code with the <html> and <body> tags.
Now that we have the table, we need to target it and host the wijgrid object on it. We can target any table in a given HTML document via jQuery as seen in the following example:
//Example 2:
$("table").wijgrid({
    data: [[0, "x"], [1, "y"], [2, "z"]]
});
Successfully running the preceding snippets of code, Example 1 and Example 2, will draw or display a Wijmo grid on your browser, having two columns and three rows similar to the following screenshot:

The code in Example 2 is the proper syntax for creating or hosting a wijgrid object on a table. The data property of the wijgrid function is an array with three data points. Each data point is an array, [0, "x"], [1, "y"], and [2, "z"]. The array count, or length for each array, signifies that we are going to have a grid with two columns and three (total number of arrays in data) rows, excluding the header. It is important to note that the table structure is only a framework for Wijmo to run on. Hence, the texts defined in the preceding <th> tags never get rendered. Wijmo parses these arrays by looking at the number of arrays in data, accounting for three rows, and each array in data being a row as follows:
Each array represents a row on the grid
Each data point in each array represents data for each column in the grid
Wijmo parses data and is quickly able to draw the resulting grid on your page, as seen in the preceding section.
Now let's use a better real-life example, incorporating all the Wijmo dependencies. Assume we have a group called "City Devs without Borders", and we want to create a grid of three people whose works have been significant in improving the security in Gotham city. We want a list of their names, dates of birth, and occupations in tabular format, which is best represented by a
wijgridobject.Type this code in your favorite editor:
<html>
<head>
<!--jQuery References-->
<script src="http://ajax.aspnetcdn.com/ajax/jquery/jquery-1.7.1.min.js" type="text/javascript"></script>
<script src="http://ajax.aspnetcdn.com/ajax/jquery.ui/1.8.17/jquery-ui.min.js" type="text/javascript"></script>
<!--Wijmo Widgets JavaScript-->
<script src="http://cdn.wijmo.com/jquery.wijmo-open.all.2.0.0.min.js" type="text/javascript"></script>
<script src="http://cdn.wijmo.com/jquery.wijmo-complete.all.2.0.0.min.js" type="text/javascript"></script>
<!--Theme-->
<link href="http://cdn.wijmo.com/themes/rocket/jquery-wijmo.css" rel="stylesheet" type="text/css" title="rocket-jqueryui" />
<!--Wijmo Widgets CSS-->
<link href="http://cdn.wijmo.com/jquery.wijmo-complete.all.2.0.0.min.css" rel="stylesheet" type="text/css" />
</head>
<body>
<table>
  <thead>
    <th>column0</th>
    <th>column1</th>
  </thead>
  <tbody>

  </tbody>
</table>

<script type="text/javascript">
var columns = [
    { headerText: 'First Name', dataKey: 'firstName', dataType: 'string'},
    { headerText: 'Last Name', dataKey: 'lastName', dataType: 'string' },
    { headerText: 'Date of Birth', dateKey: 'DOB', dataType: 'string' },
    { headerText: 'Occupation', dataKey: 'occupation', dataType: 'string' }
];
var content = [
    {
        firstName: 'Tochi',
        lastName: 'Eke-Okoro',
        DOB: '08/21',
        occupation: 'UI Developer'
    },
    {

        firstName: 'Ryan',
        lastName: 'Krest',
        DOB: '06/1',
        occupation: 'Attorney'
    },
    {
        firstName: 'Bruce',
        lastName: 'Romeo',
        DOB: '02/26',
        occupation: 'US Navy'
    }
];
$("table").wijgrid({
    columns: columns,
    data: content
});
</script>
</body>
</html>
Running the preceding code successfully will render a widget similar to this:

Again, here's a stepwise workflow of how the preceding wijgrid object was created in a nutshell:
Create an HTML table for
wijgridto hook on to.Create the columns and content to populate the grid. The column is an optional property of
wijgrid, which is an array of column objects. A column object also has optional properties, such asheaderText, which holds the string for the column header name;dataKey, which maps the column to a content property, such asfirstName; anddataType, which is the data's type, such asstring,dateTime, ornumber.Create the content. The content is an array of objects. Each object corresponds to the data for each row. Also, the column's
dataKeyproperty is usually mapped to one of the content properties.Finally, target the table and host the
wijgridobject on it. Set thewijgridobject's data option to our created content array. Also set thewijgridobject'scolumnsproperty to our createdcolumnsarray.Run the code to draw the
wijgridobject.
The wijgrid object provides options that add customizable features and functionalities to the grid. Some of these functionalities include things such as editing the grid via a simple click of the button, adding a row to the top of the grid, and adding a row of data to the bottom of the grid. Using JavaScript events, we can achieve this by listening to, say, a button being clicked.
Using the same example used previously, we are going to write functions to do the following:
Change the first name on the first row of the grid by clicking a button
Prepend a row of data to the top of the grid by clicking a button
Append a row of data to the bottom of the grid by clicking a button
Copy the following complete code into your editor:
<html>
<head>
<!--jQuery References-->
<script src="http://ajax.aspnetcdn.com/ajax/jquery/jquery-1.7.1.min.js" type="text/javascript"></script>
<script src="http://ajax.aspnetcdn.com/ajax/jquery.ui/1.8.17/jquery-ui.min.js" type="text/javascript"></script>
<!--Wijmo Widgets JavaScript-->
<script src="http://cdn.wijmo.com/jquery.wijmo-open.all.2.0.0.min.js" type="text/javascript"></script>
<script src="http://cdn.wijmo.com/jquery.wijmo-complete.all.2.0.0.min.js" type="text/javascript"></script>
<!--Theme-->
<link href="http://cdn.wijmo.com/themes/rocket/jquery-wijmo.css" rel="stylesheet" type="text/css" title="rocket-jqueryui" />
<!--Wijmo Widgets CSS-->
<link href="http://cdn.wijmo.com/jquery.wijmo-complete.all.2.0.0.min.css" rel="stylesheet" type="text/css" />
</head>
<body>
<table>
<thead>
<th>column0</th>
<th>column1</th>
</thead>
<tbody>
</tbody>
</table><p></p>
<button style="clear:both;" id="btnUpdate">Update First Name</button>
<button style="clear:both;" id="btnPrepend">Add Row to Grid Top</button>
<button style="clear:both;" id="btnAppend">Add Row to Grid Bottom</button>
<script type="text/javascript">
var columns = [
{ headerText: 'First Name', dataKey: 'firstName', dataType: 'string'},
{ headerText: 'Last Name', dataKey: 'lastName', dataType: 'string' },
{ headerText: 'Date of Birth', dateKey: 'DOB', dataType: 'string' },
{ headerText: 'Occupation', dataKey: 'occupation', dataType: 'string' }
];
var content = [
{
firstName: 'Tochi',
lastName: 'Eke-Okoro',
DOB: '08/21',
occupation: 'UI Developer'
},
{
firstName: 'Ryan',
lastName: 'Krest',
DOB: '06/1',
occupation: 'Attorney'
},
{
firstName: 'Bruce',
lastName: 'Romeo',
DOB: '02/26',
occupation: 'US Navy'
}
];
$("table").wijgrid({
columns: columns,
data: content
});
var newPerson = {
firstName: 'Empty firstname to update later',
lastName: 'Empty lastname to update later',
DOB: (new Date).toString(),
occupation: 'Empty occupation to update later'
}
var $obj = $("table");
$("#btnUpdate").click(function() {
data = $obj.wijgrid("data");
if(data[0].firstName == "Mije")
alert('SORRY!! First name already set to Mije') ;
data[0].firstName = "Mije";
$obj.wijgrid("ensureControl", true);
});
$("#btnPrepend").click(function() {
data = $obj.wijgrid("data");
data.unshift(newPerson); //prepend data or object to array
$obj.wijgrid("ensureControl", true);
});
$("#btnAppend").click(function() {
data = $obj.wijgrid("data");
data.push(newPerson); //append data or object to array
$obj.wijgrid("ensureControl", true);
});
</script>
</body>
</html>If the preceding code is run successfully on your browser, after pressing one of the buttons you will see a Wijmo grid similar to the following screenshot:

Let us go through the code one more time, focusing on the differences between it and the previous static wijgrid void of buttons.
Clicking on the Update First Name button will always update the first name in the first row to Mije, and if it is already set to Mije, it will alert the SORRY message.
Clicking on the Add Row to Grid Top button will prepend the dummy data, programmatically referenced by
newPerson, to thewijgridobject. ThenewPersonobject contains data for each column, including the date of birth, which in this case has been defaulted to the entry date (now) of this row, captured innew Date. For future programming exercises, or self-supervised tryouts, you could try writing functions to edit each cell of the row.Clicking on the Add Row to Grid Bottom button will append the dummy data (the same dummy data mentioned previously), referenced by
newPerson, to thewijgridobject.The
$obj.wijgrid("ensureControl", true)object ensures that we have the permission to control the Wijmo grid, else we won't see or notice any changes when the buttons are clicked.
Now we know how to edit the wijgrid object by writing functions that trigger those updates when certain events occur, for example, the click of a button. Let us see a pretty hassle-free way of editing the grid right on wijgrid itself. This is similar to editing the cell just like you would in an Excel spreadsheet, by double-clicking on it.
Change the preceding code to the following:
$("table").wijgrid({
    columns: columns,
    data: content,
    allowEditing: true
});
This will make every cell editable by simply double-clicking on it. Here is a list of cool options to further customize your wijgrid object:
$("#table").wijgrid({ allowKeyboardNavigation: true}); //allows keyboard navigation
$("#table").wijgrid({ allowPaging: true}); //allows pagination on wijgrid
$("#table").wijgrid({ allowSorting: true}); //allows wijgrid to be sorted
$("#table").wijgrid({ culture: "en"}); //sets the culture ID of the wijgrid
$("#table").wijgrid({ loadingText: "I'm Loading…"}); //sets the loading textVisit http://wijmo.com/wiki/index.php/Grid for more information about Wijmo grids
Wijmo provides a class for accessing data via a datareader object and an optional proxy parameter. The data could be stored locally via a specific format, and parsed via a datareader object. The proxy property holds the URL to the service that renders or holds the required data, which is usually in the backend and not stored on the client side.
We refer to this class as the wijdatasource class. The jquery.wijmo.wijdatasource.js library is responsible for creating the wijdatasource widget class and it contains two sample proxy and reader classes.
Assume we want to parse or simply display a list of a few popular cities of the world, and that this data will be created and stored locally in our widget as follows:
var testArr = ["London", "Brussels", "Los Angeles", "Abuja", "Johannesburg", "Paris", "Amsterdam"];
To create our List of major cities app, we can initialize a wijdatasource class and utilize our data as follows:
<html>
<head>
<title>List of major cities app!! </title>
<!--jQuery References-->
<script src="http://ajax.aspnetcdn.com/ajax/jquery/jquery-1.7.1.min.js" type="text/javascript"></script>
<script src="http://ajax.aspnetcdn.com/ajax/jquery.ui/1.8.17/jquery-ui.min.js" type="text/javascript"></script>
<!--Wijmo Widgets JavaScript-->
<script src="http://cdn.wijmo.com/jquery.wijmo-open.all.2.0.0.min.js" type="text/javascript"></script>
<script src="http://cdn.wijmo.com/jquery.wijmo-complete.all.2.0.0.min.js" type="text/javascript"></script>
<!--Theme-->
<link href="http://cdn.wijmo.com/themes/rocket/jquery-wijmo.css" rel="stylesheet" type="text/css" title="rocket-jqueryui" />
<!--Wijmo Widgets CSS-->
<link href="http://cdn.wijmo.com/jquery.wijmo-complete.all.2.0.0.min.css" rel="stylesheet" type="text/css" />
</head>
<body>
<span><h5>Hi Folks!! </h5></span>
<span>This app prints nothing to screen but logs the local data read via datareader to console...</span>

<script type="text/javascript">
// array to read {List of popular cities around the world...}
var testArr = ["London", "Brussels", "Los Angeles", "Abuja", "Johannesburg", "Paris", "Amsterdam"];
// create datareader of array
var myReader = new wijarrayreader([{name: 'label'}, {name: 'value'}, {name: 'selected',defaultValue: false}]);
// create datasource

var datasource = new wijdatasource({
    reader: myReader,
    data: testArr,
    loaded: function (data){
                // get items by data.items
                console.log(data.items)

            }
});
// load datasource, loaded event will be fired after loading.
datasource.load();
</script>
</body>
</html>
If the code is successfully run, you will see a message on your browser's screen telling you what the app does. A log of the objects is outputted to the console.
Once again, we add references to the Wijmo widget dependency files from CDN.
Next, we create the list of cities.
Next, we create the
datareaderobject that has the format for arranging our list, and we set thedatareaderobject to amyReaderhandle.Time for the real deal! We initialize the
datasourceobject as follows:var datasource = new wijdatasource({ reader: myReader, data: testArr, loaded: function (data){ // get items by data.items console.log(data.items) } });Then, we load the
datasourceobject usingdatasource.load(). Theloadedfunction, which is a property ofwijdatasource, is called afterdatasource.load()fires off. The loaded data is referenced as the parameter or argument in that function for which the items within can be referenced bydata.items.
It is also possible to load data from a prepared datasource object into a targeted UI element such as a <div> or <p> tag. This datasource object could be prepared via a proxy, which is a mechanism for retrieving data from a remote source, or locally as previously shown.
To show how to work with wijdatasource and HTML elements, let us look at one more example that utilizes local data. Assume that we have a list of some countries we want to populate in a list. Assume that we also want a selection of those cities visible only after some substring of that country is entered in an input field. We also want this event to trigger only when a button is clicked.
For instance, say we have a list containing the words Computer, Motherboard, Commute, Mother, apple, and people. If the user enters Com and clicks on the button, the output should be a new list containing Computer and Commute. Also, if the user enters ple and clicks on the button, the output should be a new list containing apple and people.
To properly illustrate this, we will make use of a Wijmo widget called wijlist. A wijlist object is simply a Wijmo list widget, which can be created by targeting a given element on the page and initiating the widget on it with the following code:
var myArr = [6,7,8,9,0];
$('.myList').wijlist('setItems', myArr);//Render the list in the client browserlist.wijlist('renderList');
The preceding code assumes the existence of a class called myList, and we initialize or host the wijlist object on all elements with a myList class. We create a local array referenced by myArr. Finally, we render the wijlist object on our browser.
Having understood what a wijlist object is and how to deploy one in our widget, we can proceed with our app. Enter the following code in your favorite editor:
<!--jQuery References-->
<html>
<head>
<script src="http://ajax.aspnetcdn.com/ajax/jquery/jquery-1.7.1.min.js" type="text/javascript"></script>
<script src="http://ajax.aspnetcdn.com/ajax/jquery.ui/1.8.17/jquery-ui.min.js" type="text/javascript"></script>
<!--Wijmo Widgets JavaScript-->
<script src="http://cdn.wijmo.com/jquery.wijmo-open.all.2.0.0.min.js" type="text/javascript"></script>
<script src="http://cdn.wijmo.com/jquery.wijmo-complete.all.2.0.0.min.js" type="text/javascript"></script>
<!--Theme-->
<link href="http://cdn.wijmo.com/themes/rocket/jquery-wijmo.css" rel="stylesheet" type="text/css" title="rocket-jqueryui" />
<!--Wijmo Widgets CSS-->
<link href="http://cdn.wijmo.com/jquery.wijmo-complete.all.2.0.0.min.css" rel="stylesheet" type="text/css" />
</head>
<body>
<div class="ui-widget">
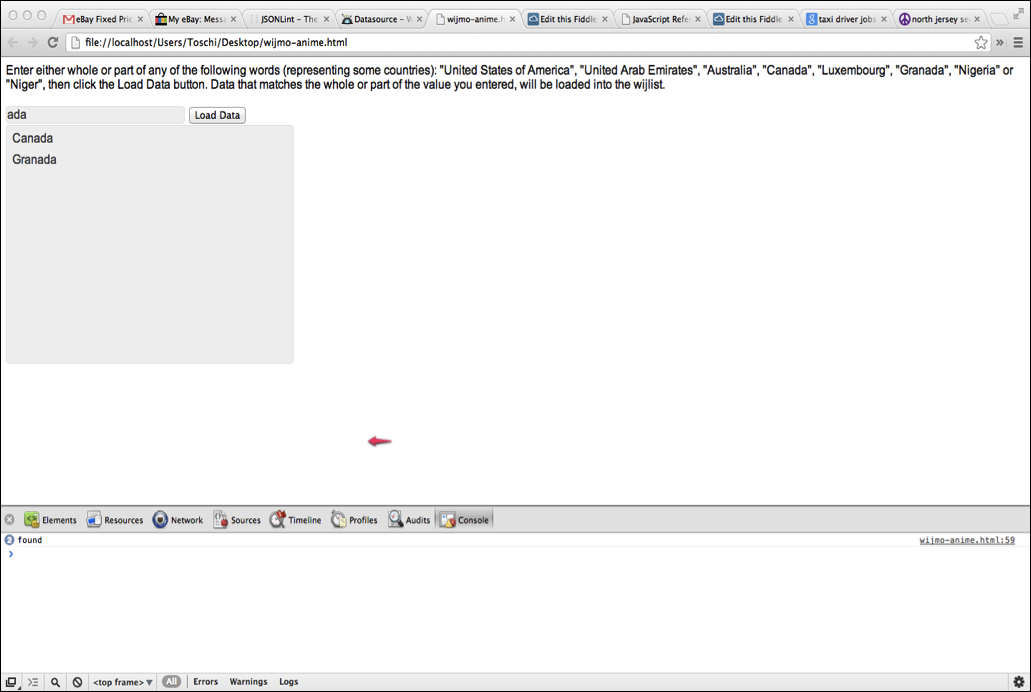
<P>Enter either whole or part of any of the following words (representing some countries): "United States of America", "United Arab Emirates", "Australia", "Canada", "Luxembourg", "Granada", "Nigeria" or "Niger", then click the Load Data button. Data that matches the whole or part of the value you entered, will be loaded into the wijlist.</p>
<input style="width: 250px" id="testInput" type="textbox" class="ui-widget-content ui-corner-all" />
<input type="button" id="loadData" value="Load Data" />
<div id="list" style="height: 300px; width: 400px;"></div>
</div>
<script>
$(document).ready(function () {
$("#list").wijlist({});
var testArray = [{
label: 'United States of America',
value: 'United States of America'
}, {
label: 'United Arab Emirates',
value: 'United Arab Emirates'
}, {
label: 'Australia',
value: 'Australia'
}, {
label: 'Canada',
value: 'Canada'
}, {
label: 'Luxembourg',
value: 'Luxembourg'
}, {
label: 'Granada',
value: 'Granada'
}, {
label: 'Nigeria',
value: 'Nigeria'
}, {
label: 'Niger',
value: 'Niger'
}];
loadList(testArray);
$('input#loadData').click(function(){
var text = $('input#testInput').val().toLowerCase();
if(text == "" || text == null){
alert('No Match');
return ;
}
var matches = [];
for(var i = 0; i < testArray.length; i++){
var newTxt = testArray[i].label.toLowerCase();
if(newTxt.indexOf(text) > -1){
//console.log('found');
matches.push(testArray[i]);
}
}
loadList(matches)
return ;
//console.log('failed');
});
function loadList(arr){
var list = $("#list");
//set the array testArray to the Wijmo list widget
list.wijlist('setItems', arr);
//Render the list in the client browser
list.wijlist('renderList');
}
});
</script>
</body>
</html>If the preceding code is successfully run, you will have something like this in your browser:
So once again, starting from the document.ready function, we will go through our code to explain how this widget works:
First of all, we create a
wijlistobject by hosting it on thedivtag withid = list.Next, we create a local array,
testArray, which will be digested by theloadListfunction. This will settestArrayas the new content of thewijlistobject.By clicking the Load Data button, we compare the text entered in the input field with
id = "testInput", and each of the items in thewijlistobject via aforloop.During the loop, we append subsequent matches to a new local array,
newList.At the end of the loop, if
newListis not empty we setnewListas the new Wijmo list data, thus overwriting the previous list data and getting a new result in our browser.
In the just-concluded example, it is important to note that we only used a local array without making reference to a wijdatasource object. Usually, some array is passed as one of the properties in the parameters of a wijdatasource object, which sets the array as a datasource object. The app we just created did not use a datasource object but a wijlist object.
To use the datasource and wijlist objects, copy the following code into your editor and run it:
<!--jQuery References-->
<html>
<script src="http://ajax.aspnetcdn.com/ajax/jquery/jquery-1.7.1.min.js" type="text/javascript"></script>
<script src="http://ajax.aspnetcdn.com/ajax/jquery.ui/1.8.17/jquery-ui.min.js" type="text/javascript"></script>
<!--Wijmo Widgets JavaScript-->
<script src="http://cdn.wijmo.com/jquery.wijmo-open.all.2.0.0.min.js" type="text/javascript"></script>
<script src="http://cdn.wijmo.com/jquery.wijmo-complete.all.2.0.0.min.js" type="text/javascript"></script>
<!--Theme-->
<link href="http://cdn.wijmo.com/themes/rocket/jquery-wijmo.css" rel="stylesheet" type="text/css" title="rocket-jqueryui" />
<!--Wijmo Widgets CSS-->
<link href="http://cdn.wijmo.com/jquery.wijmo-complete.all.2.0.0.min.css" rel="stylesheet" type="text/css" />

<div class="ui-widget">
    <P>Enter either whole or part of any of the following words (representing some countries): "United States of America", "United Arab Emirates", "Australia", "Canada", "Luxembourg", "Granada", "Nigeria" or "Niger", then click the Load Data button. Data that matches the whole or part of the value you entered, will be loaded into the wijlist.</p>
     <input style="width: 250px" id="testInput" type="textbox" class="ui-widget-content ui-corner-all" />
     <input type="button" id="loadData" value="Load Data" />
    <div id="list" style="height: 300px; width: 400px;"></div>
</div>
<script>
 $(document).ready(function () {
        $("#list").wijlist({});
       var testArray = [{
                label: 'United States of America',
                value: 'United States of America'
            }, {
                label: 'United Arab Emirates',
                value: 'United Arab Emirates'
            }, {
                label: 'Australia',
                value: 'Australia'
            }, {
                label: 'Canada',
                value: 'Canada'
            }, {
                label: 'Luxembourg',
                value: 'Luxembourg'
            }, {
                label: 'Granada',
                value: 'Granada'
            }, {
                label: 'Nigeria',
                value: 'Nigeria'
            }, {
                label: 'Niger',
                value: 'Niger'
        }];
        //var datasource = null;
        var myReader = new wijarrayreader([{name: 'label'}, {name: 'value'}, {name: 'selected',defaultValue: false}]);
            var datasource = new wijdatasource({
               reader: myReader,
               data: testArray,
               loaded: function (data){
                    // get items by data.items
                    loadList(data.items);

                }
            });
        datasource.load();
         function loadList(items){
            var list = $("#list");
            //set the array testArray to the Wijmo list widget
            list.wijlist('setItems', items);
            //Render the list in the client browser
            list.wijlist('renderList');


        }
        $('#loadData').click(function(){
          //process this section when the load Data is clicked...
          var text = $('input#testInput').val().toLowerCase();
            if(text == "" || text == null){
               alert('No Match');
               return ;
            }
          var newList = [];
            for(var i = 0; i < testArray.length; i++){
              var newTxt = testArray[i].label.toLowerCase();
                if(newTxt.indexOf(text) > -1){
                   //console.log('found');
                   newList.push(testArray[i]);
                }
            }
            if(newList.length > 0){
                loadList(newList)
                return ;
            }
            //console.log('failed');
            return ;

        });

});
</script>
</html>
In the preceding code, we actually instantiate a datasource object using the local array or data. These are all done when the page loads.
            datasource = new wijdatasource({
               reader: myReader,
               data: testArray,
               loaded: function (data){
                    // get items by data.items
                    loadList(data.items);
                }
            });
The reader property is set to myReader. This is the format for processing testArray, which is assigned to the data property of the wijdatasource object. The loaded function is called after the wijdatasource object is created, and it calls loadList(). This, in turn, renders the wijlist object in the list div. The functionality of the app, however, remains the same.
So far, we've demonstrated how to manipulate local data sources. The team at Wijmo was also aware of the possibilities of working with distributed systems that host data in remote locations, and thus provided a mechanism for digesting remote or distributed data sources over the network. This is achievable using the proxy property of the wijdatasource object. The proxy is set to the remote location of the data.
The following code was obtained from http://wijmo.com/wiki/index.php/Datasource and modified to function like our wijdatasource app, as was done previously, but makes use of a proxy now.
<html>
<head>
<script src="http://ajax.aspnetcdn.com/ajax/jquery/jquery-1.7.1.min.js" type="text/javascript"></script>
<script src="http://ajax.aspnetcdn.com/ajax/jquery.ui/1.8.17/jquery-ui.min.js" type="text/javascript"></script>
<!--Wijmo Widgets JavaScript-->
<script src="http://cdn.wijmo.com/jquery.wijmo-open.all.2.0.0.min.js" type="text/javascript"></script>
<script src="http://cdn.wijmo.com/jquery.wijmo-complete.all.2.0.0.min.js" type="text/javascript"></script>
<!--Theme-->
<link href="http://cdn.wijmo.com/themes/rocket/jquery-wijmo.css" rel="stylesheet" type="text/css" title="rocket-jqueryui" />
<!--Wijmo Widgets CSS-->
<link href="http://cdn.wijmo.com/jquery.wijmo-complete.all.2.0.0.min.css" rel="stylesheet" type="text/css" />
<style>
input#testInput{width: 250px}
</style>
</head>
<body>
<div class="ui-widget">
    <P>Enter either whole or part of any of the following words (representing some countries): "United States of America", "United Arab Emirates", "Australia", "Canada", "Luxembourg", "Granada", "Nigeria" or "Niger", then click the Load Data button. Data that matches the whole or part of the value you entered, will be loaded into the wijlist.</p>
     <input id="testInput" type="textbox" class="ui-widget-content ui-corner-all" />
     <input type="button" id="loadData" value="Load Data" />
    <div id="list" style="height: 300px; width: 400px;"></div>
</div>
<script>
 $(document).ready(function () {
        $("#list").wijlist({});
        var proxy = new wijhttpproxy({
            url: "http://ws.geonames.org/searchJSON",
            dataType: "jsonp",
            data: {
                featureClass: "P",
                style: "full",
                maxRows: 10,
                name_startsWith: 'ab'
            },
            key: 'geonames'
        });
        var datasource = null;
        var thisData = null;
        var myReader = new wijarrayreader([
        {
            name: 'label',
            mapping: function (item){
                return item.name + (item.adminName1 ? ", " + item.adminName1 : "") + ", " + item.countryName
            }
        },
        {
            name: 'value',mapping: 'name'
        }
        ]);
            datasource = new wijdatasource({
               reader: myReader,
               proxy: proxy,
               loaded: function (data){
                    // get items by data.items
                    thisData = data.items;
                    loadList(data.items);


                }
        });
        datasource.load();
         function loadList(items){
            var list = $("#list");
            //set the array testArray to the Wijmo list widget
            list.wijlist('setItems', items);
            //Render the list in the client browser
            list.wijlist('renderList');


        }
        $('#loadData').click(function(){

          //process this section when the load Data is clicked...
          var text = $('input#testInput').val().toLowerCase();
proxy.options.data.name = text;
datasource.load();
          });

   });
</script>
</body>
</html>
The preceding code pulls data from a proxy instead of local data. The data obtained has been limited to a maximum of 12, starting with ab. The functionality of our widget remains the same.
For more insight into wijdatasources, you can visit http://wijmo.com/wiki/index.php/Datasource. There are more configurations and options there that are very useful in customizing your widget.
KnockoutJS is defined on their website http://knockoutjs.com/documentation/introduction.html, as follows:
Knockout is a JavaScript library that helps you to create rich, responsive display and editor user interfaces with a clean underlying data model.
Any time you have sections of UI that update dynamically. Knockout can help you implement it more simply and is maintainable.
Here is what Wijmo says about KnockoutJS:
Wijmo now supports Knockout (KO), a JavaScript library that uses the Model View View Model (MVVM) pattern, allowing you to easily create and maintain a dynamically changing UI. You can use KO in addition to jQuery to enhance your pages with an underlying data model. For a full KO introduction, tutorials, documentation, explanation of MVVM, and more, visit http://knockoutjs.com/.
Before we get started, note that this recipe is for anyone who has a prior familiarity with KnockoutJS, occasionally referred hereafter as KO. Please visit the KO website for an introduction if you are not familiar with it.
You can easily use Knockout with Wijmo by following a few simple steps:
Add references to the latest jQuery dependencies, Wijmo widgets,
Knockout.jsfile, and KO extension library for Wijmo.Create the
ViewModelandViewobjects: add JavaScript to define the data and behavior of the UI, and add markup to createView—the visual, interactive UI.Bind the Wijmo widget(s) to
ViewModeland activate KO.
Having known what both sides, Wijmo and Knockout, have to say about the awesome Knockout library, we can proceed by creating our first Knockout-integrated widget. First of all, to integrate the KnockoutJS library into our widgets, we would have to reference the Knockout files hosted in the Wijmo CDN as follows:
 <script type="text/javascript" src="http://cdn.wijmo.com/external/knockout-2.0.0.js"></script>
  <script type="text/javascript" src="http://cdn.wijmo.com/external/knockout.wijmo.js"></script>
Assume we want to create an app or widget that can accept a measure of temperature in Celsius and return its Fahrenheit equivalent. For creating the input, we will have an input field that has a preset Celsius value and a linear gauge widget, also known as wijlineargauge, that will animate to the Fahrenheit-equivalent value. Enter the following code in your editor and run:
<!DOCTYPE html>
<html>
<head>
    <meta charset="utf-8">
    <title>Wijmo MVVM Support</title>
    <meta http-equiv="X-UA-Compatible" content="IE=edge,chrome=1" />
    <style type="text/css">
        body
        {
            font-size: 13px;
        }
    </style>
    <!-- jQuery -->
    <script type="text/javascript" src="https://ajax.googleapis.com/ajax/libs/jquery/1.7.1/jquery.min.js"></script>
    <script type="text/javascript" src="https://ajax.googleapis.com/ajax/libs/jqueryui/1.8.18/jquery-ui.min.js"></script>
    <!-- Wijmo CSS and script -->
    <link type="text/css" href="http://cdn.wijmo.com/themes/aristo/jquery-wijmo.css" rel="stylesheet" title="metro-jqueryui" />
    <link type="text/css" href="http://cdn.wijmo.com/jquery.wijmo-complete.all.2.1.0.min.css" rel="stylesheet" />
    <script type="text/javascript" src="http://cdn.wijmo.com/jquery.wijmo-open.all.2.1.0.min.js"></script>
    <script type="text/javascript" src="http://cdn.wijmo.com/jquery.wijmo-complete.all.2.1.0.min.js"></script>
    <!-- KnockoutJS for MVVM-->
    <script type="text/javascript" src="http://cdn.wijmo.com/external/knockout-2.0.0.js"></script>
    <script type="text/javascript" src="http://cdn.wijmo.com/external/knockout.wijmo.js"></script>
    <script type="text/javascript">

    <!-- when document loads, create ViewModel, and apply bindings-->
    <!-- Create ViewModel-->

        var viewModel = function () {
            var self = this;
            self.celsius = ko.observable(20);
             self.kelvin = ko.computed(function(){
                //console.log('self.celsius = ' + self.celsius);
                return self.celsius() * 273;
            }, this);
            self.fahrenheit = ko.computed(function(){
                //console.log('self.celsius = ' + self.celsius);
                return self.celsius() * 1.8 + 32;
            }, this);
            self.min = ko.observable(0);
            self.max = ko.observable(200);
        };

    <!-- Bind ViewModel-->
        $(document).ready(function () {
            var vm = new viewModel();
            ko.applyBindings(vm);
        });
    </script>
</head>
<body>
    <div class="container">
        <h2>
            Celsius Textbox - Edit Here!</h2>
        <input data-bind="value: celsius" style="width: 200px;" />
        <div>
            <h2>
                Fahrenheit Slider - Don't Edit!</h2>
            <div data-bind="wijlineargauge: {value: fahrenheit, min: min, max: max}" style="width: 800px;">
            </div>
        </div>
    </div>
</body>
</html>If the code runs successfully, you should see the following image in your browser:

The Wijmo and Knockout libraries are referenced and included in our app. The ViewModel object is created, which has all the properties necessary for our app to function properly. The self.celsius property is an observable property, which is used to calculate self.fahrenheit. Also, self.min and self.max are used to set the minimum and maximum values of the gauge respectively. Then, we apply bindings of the ViewModel object to the view elements as shown in the following code:
ko.applyBindings(vm);
To finalize this recipe, we will create one more widget that will exhibit the beauty and overall importance of KO real-time data binding. This time we want to be able to update a simple pie chart right after a value entry for male and/or female.
Enter the following code in an editor and open it in a browser:
<!DOCTYPE html>
<html>
<head>
    <meta charset="utf-8">
    <title>Wijmo MVVM Support</title>
    <meta http-equiv="X-UA-Compatible" content="IE=edge,chrome=1" />
    <style type="text/css">
        body
        {
            font-size: 13px;
        }
    </style>
    <!-- jQuery -->
    <script type="text/javascript" src="https://ajax.googleapis.com/ajax/libs/jquery/1.7.1/jquery.min.js"></script>
    <script type="text/javascript" src="https://ajax.googleapis.com/ajax/libs/jqueryui/1.8.18/jquery-ui.min.js"></script>
    <!-- Wijmo CSS and script -->
    <link type="text/css" href="http://cdn.wijmo.com/themes/aristo/jquery-wijmo.css" rel="stylesheet" title="metro-jqueryui" />
    <link type="text/css" href="http://cdn.wijmo.com/jquery.wijmo-complete.all.2.1.0.min.css" rel="stylesheet" />
    <script type="text/javascript" src="http://cdn.wijmo.com/jquery.wijmo-open.all.2.1.0.min.js"></script>
    <script type="text/javascript" src="http://cdn.wijmo.com/jquery.wijmo-complete.all.2.1.0.min.js"></script>
    <!-- KnockoutJS for MVVM-->
    <script type="text/javascript" src="http://cdn.wijmo.com/external/knockout-2.0.0.js"></script>
    <script type="text/javascript" src="http://cdn.wijmo.com/external/knockout.wijmo.js"></script>
    <script type="text/javascript">

    <!-- when document loads, create ViewModel, and apply bindings-->
    <!-- Create ViewModel-->

       var viewModel = function () {
            var self = this;
            self.boys = ko.numericObservable(50);
            self.girls = ko.numericObservable(30);
        };

    <!-- Bind ViewModel-->
        $(document).ready(function () {
            var vm = new viewModel();
            ko.applyBindings(vm);
        });
    </script>
</head>
<body>
       <!--Create View-->
    <div>
        males: <input type="text" data-bind="value: boys" />
        females: <input type="text" data-bind="value: girls" />
    </div>
<div class="piechart" data-bind="wijpiechart: { width: 600, height: 400, seriesList:
                                                     [{ label: 'Boys', data: boys },
                                                      { label: 'Girls', data: girls }
                                                      ] }">
</div>
</body>
</html>
The preceding code sets up our ViewModel object with the boys and girls numeric observable properties. Our data is then bound to the views, and finally, we bind the piechart div to the wijpiechart object, passing the necessary values for the chart.
So far so good! This was easy, clean, and straightforward. One easily notices that the views and the view model are separate with only data bindings. In real-life software development, KO eliminates embedding server-side variables and dependencies within the views. The views should be purely HTML!
If successfully run, you will see a widget in your browser similar to the following screenshot:

Themes are an important part of any web or mobile widget. The quality, seamlessness, and ease of the user interface, also referred to as the UI, determine the usability of the widget. Most developers are less attentive to UI detail and focus more on the overall prototypical functionality.
The team at Wijmo understands the importance of UIs, and has integrated the jQuery UI into the Wijmo library. Wijmo was built on top of jQuery in such a way that making a reference to the Wijmo library also embeds the jQuery library.
The essence of ThemeRoller is to enable us to customize the look and feel of our widgets or apps in general. All the sample widgets created in previous recipes have references to a Wijmo theme called rocket:
<link href="http://cdn.wijmo.com/themes/rocket/jquery-wijmo.css" rel="stylesheet" type="text/css" title="rocket-jqueryui" />
This applies the rocket theme styles to the widget. So, to change the theme, we need to reference another one, preexisting or personally customized.
To achieve this, we can make use of
jQuery ThemeRoller, which is accessible at http://jqueryui.com/themeroller/.Download a theme of your choice from the ones listed within the Gallery tab of the page. For the purposes of this tutorial, we are using UI darkness.

Click on the Download button below UI darkness; it takes you to the Download Builder page.

Now that we have downloaded the
jquery-ui-1.9.2.custom.zipfile, we need to unzip it. After extracting all the files, we navigate to the CSS file of our choice, minified or regular. For the purposes of this tutorial, we will use the minified version. There's not going to be much difference in performance, though.The CSS file, in this case, is
jquery-ui-1.9.2.custom.min.cssand we have to include the path in our project, which will replace the rocket theme's CSS file as follows:<link href=" jquery-ui-1.9.2.custom/css/ui-darkness/jquery-ui-1.9.2.custom.min.css" rel="stylesheet" type="text/css" title="UI darkness-jqueryui" />
We will redo one of the grid widgets using the new UI darkness theme we downloaded. Enter the following code in your editor and run it:
<html>
<head>
<!--jQuery References-->
<script src="http://ajax.aspnetcdn.com/ajax/jquery/jquery-1.7.1.min.js" type="text/javascript"></script>
<script src="http://ajax.aspnetcdn.com/ajax/jquery.ui/1.8.17/jquery-ui.min.js" type="text/javascript"></script>
<!--Wijmo Widgets JavaScript-->
<script src="http://cdn.wijmo.com/jquery.wijmo-open.all.2.0.0.min.js" type="text/javascript"></script>
<script src="http://cdn.wijmo.com/jquery.wijmo-complete.all.2.0.0.min.js" type="text/javascript"></script>
<!--Theme-->
<link href="jquery-ui-1.9.2.custom/css/ui-darkness/jquery-ui-1.9.2.custom.min.css" rel="stylesheet" type="text/css" title="UI darkness-jqueryui" />
<!--Wijmo Widgets CSS-->
<link href="http://cdn.wijmo.com/jquery.wijmo-complete.all.2.0.0.min.css" rel="stylesheet" type="text/css" />
</head>
<body>
<table>
  <thead>
    <th>column0</th>
    <th>column1</th>
  </thead>
  <tbody>

  </tbody>
</table>

<script type="text/javascript">
var columns = [
    { headerText: 'First Name', dataKey: 'firstName', dataType: 'string'},
    { headerText: 'Last Name', dataKey: 'lastName', dataType: 'string' },
    { headerText: 'Date of Birth', dateKey: 'DOB', dataType: 'string' },
    { headerText: 'Occupation', dataKey: 'occupation', dataType: 'string' }
];
var content = [
    {
        firstName: 'Tochi',
        lastName: 'Eke-Okoro',
        DOB: '08/21',
        occupation: 'UI Developer'
    },
    {

        firstName: 'Ryan',
        lastName: 'Krest',
        DOB: '06/1',
        occupation: 'Attorney'
    },
    {
        firstName: 'Bruce',
        lastName: 'Romeo',
        DOB: '02/26',
        occupation: 'US Navy'
    }
];
$("table").wijgrid({
    columns: columns,
    data: content
});
</script>
</body>
</html>
If the preceding code is successfully run, you will see a Wijmo grid similar to this:

Hurray! We have changed the theme for the widget!
The only thing we changed in our code was the reference or link to the theme or CSS file. We have used a theme we desire for our widget, and this is achievable as follows:
Visit the ThemeRoller site at http://jqueryui.com/themeroller/.
Click on the Gallery tab.
In the Gallery section, you will find a list of themes. Click on the Download button below the theme of interest.
In the Download Builder page, turn on or off the options you do/don't need activated in your theme.
Overwrite the previous theme's path in your project with the new CSS file, which could be minified or regular.
There goes the new theme!
What about creating our own theme from scratch?
Its as easy as A-B-C!
The team at jQuery has provided a quick way of achieving this in ThemeRoller, which can be found at http://jqueryui.com/themeroller/. So, we'll visit the ThemeRoller site and we should be right on the Roll Your Own tab. You should be able to see this page:

Open the Header/Toolbar and Content sections, and make some changes. The following screenshot shows the particular changes made for the purpose of this tutorial:

Next, click on the Download Theme button, which takes you to the Download Builder page. Here, you can turn the options on or off and then finally download the zipped theme. Unzip the file and add the path to your widget project. Navigate to the path and you will see the following screenshot:

After switching from the theme reference and running the code, we have the following screen on our browser. This is the new look of our grid:

