Download code from GitHub
Chapter 1: Implementing Cloud Infrastructure Monitoring
This book will cover all of the exam objectives for the AZ-303 exam. When relevant, you will be provided with extra information and further reading guidance about the different topics of this book.
This chapter introduces the first objective, which is going to cover Implement Cloud Infrastructure Monitoring. It will cover the various aspects of Azure Monitor. You will learn how to create and analyze metrics and alerts and how to create a baseline for resources. We are going to look at how to create action groups and how to configure diagnostic settings on resources. We are going to cover Azure Log Analytics and how to utilize log search query functions; finally, we will look at monitoring security events, networking, and cost management.
Being able to monitor all aspects of your solution is important for service health, security, reliability, and costs. With so much data available, it’s important to know how to set up alerts and query logs effectively.
The following topics will be covered in this chapter:
- Understanding Azure Monitor
- Creating and analyzing metrics and alerts
- Creating a baseline for resources
- Configuring diagnostic settings on resources
- Viewing alerts in Log Analytics
- Utilizing log search query functions
- Using Network Watcher
- Monitoring security
- Managing costs
Technical requirements
The demos in this chapter use an Azure Windows VM. To create a Windows VM in Azure, refer to the following walk-through: https://docs.Microsoft.com/en-us/azure/virtual-machines/windows/quick-create-PowerShell.
Understanding Azure Monitor
Azure Monitor is a monitoring solution in the Azure portal that delivers a comprehensive solution for collecting, analyzing, and acting on telemetry from the cloud and on-premises environments. It can be used to monitor various aspects (for instance, the performance of applications) and identify issues affecting those applications and other resources that depend on them.
The data that is collected by Azure Monitor fits into two fundamental types: metrics and logs. Metrics describe an aspect of a system at a particular point in time and are displayed in numerical values. They are capable of supporting near real-time scenarios. Logs are different from metrics. They contain data that is organized into records, with different sets of properties for each type. Data such as events, traces, and performance data are stored as logs. They can then be combined for analysis purposes.
Azure Monitor supports data collection from a variety of Azure resources, which are all displayed on the overview page in the Azure portal. Azure Monitor provides the following metrics and logs:
- Application monitoring data: This consists of data about the functionality and performance of the application and the code that is written, regardless of its platform.
- Guest OS monitoring data: This consists of data about the OS on which your application is running. This could be running in any cloud or on-premises environment.
- Azure resource monitoring data: This consists of data about the operation of an Azure resource.
- Azure subscription monitoring data: This consists of data about the operation and management of an Azure subscription, as well as data about the health and operation of Azure itself.
- Azure tenant monitoring data: This consists of data about the operation of tenant-level Azure services, such as Azure Active Directory.
Important note
Azure Monitor now integrates the capabilities of Log Analytics and Application Insights. You can also keep using Log Analytics and Application Insights on their own.
The following diagram gives a high-level view of Azure Monitor. On the left, there are the sources of monitoring data, in the center are the data stores, and on the right are the different functions that Azure Monitor performs with this collected data, such as analysis, alerting, and streaming to external systems:

Figure 1.1 – Overview of Azure Monitor capabilities
Now that we have some basic knowledge about Azure Monitor, we are going to look at how to analyze alerts and metrics across subscriptions.
Creating and analyzing metrics and alerts
To analyze alerts and metrics across Azure Monitor, we need to go to the monitoring resource inside the Azure portal. In the upcoming sections, we will set up metrics and alerts and show you how to analyze them.
Metrics
Metrics describe an aspect of a system at a particular point in time and are displayed in numerical values. They are collected at regular intervals and are identified with a timestamp, a name, a value, and one or more defining labels. They are capable of supporting near real-time scenarios and are useful for alerting. Alerts can be fired quickly with relatively simple logic.
Metrics in Azure Monitor are stored in a time-series database that is optimized for analyzing timestamped data. This makes metrics suited for the fast detection of issues. They can help to detect how your service or system is performing, but to get the overall picture, they typically need to be combined with logs to identify the root cause of issues.
You can use metrics for the following scenarios:
- Analyzing: Collected metrics can be analyzed using a chart in Metric Explorer. Metrics from various resources can be compared as well.
- Visualizing: You can create an Azure Monitor workbook to combine multiple datasets into an interactive report. Azure Monitor workbooks can combine text, Azure metrics, analytics queries, and parameters into rich interactive reports.
- Alerting: Metric alert rules can be configured to send out notifications to the user. They can also take automatic action when the metric value crosses a threshold.
- Automating: To increase and decrease resources based on metric values that cross a threshold, autoscaling can be used.
- Exporting: Metrics can be streamed to an Event Hub to route them to external systems. Metrics can also be routed to logs in the Log Analytics workspace in order to be analyzed together with the Azure Monitor logs and to store the metric values for more than 93 days.
- Retrieving: Metrics values can be retrieved from the command line using PowerShell cmdlets and the CLI, and from custom applications using the Azure Monitoring REST API.
- Archiving: Metrics data can be archived in Azure Storage. It can store the performance or health history of your resource for compliance, auditing, or offline reporting purposes.
There are four main sources of metrics that are collected by Azure Monitor. Once they are collected and stored in the Azure Monitor Metric database, they can be evaluated together regardless of their source:
- Platform metrics: These metrics give you visibility of the health and performance of your Azure resources. Without any configuration required, a distinct set of metrics is created for each type of Azure resource. By default, they are collected at one-minute intervals. However, you can configure them to run at different intervals as well.
- Guest OS metrics: These metrics are collected from the guest OS of a virtual machine. To enable guest OS metrics for Windows machines, the Windows Diagnostic Extension (WAD) agent needs to be installed. For Linux machines, the InfluxData Telegraf agent needs to be installed.
- Application metrics: These metrics are created by Application Insights. They can help to detect performance issues for your custom applications and track trends in how the application is being used.
- Custom metrics: These are metrics that you define manually. You can define them in your custom applications that are monitored by Application Insights or you can define custom metrics for an Azure service using the custom metrics API.
Tip
For more information about the InfluxData Telegraf agent, go to the InfluxData website, https://www.influxdata.com/time-series-platform/telegraf/.
Multi-dimensional metrics
Metrics data often has limited information to provide context for collected values. This challenge is addressed by Azure Monitor using multi-dimensional metrics. The dimensions of the metrics are name-value pairs that store additional data that describe the metric value. For example, a metric called available disk space could have a dimension called Drive with the values C: and D: stored inside. This value would allow the viewing of available disk space across all drives, or each drive individually.
In the next section, we are going to create a metric in the Azure portal.
Creating a metric
To display the metrics for a Windows VM (if you followed the creating a VM walk-through detailed in the Technical requirements section) in Azure Monitor, follow these steps:
- Navigate to the Azure portal by opening https://portal.azure.com.
- In the left-hand menu, select Monitor to open the Azure Monitor overview blade.
- First, we’re going to look at metrics. Therefore, in the left-hand menu, select Metrics or select the Explore Metrics button from the overview blade.
- In the Metrics overview blade, the Select a Scope may be automatically displayed; if not, click on the + Select a scope button. A new blade will open up where you can select the subscription, the resource group, and the resource type. Select the subscription that is used for the Windows VM, select the resource group, and then select the VM. You can filter by other resource types, as well:

Figure 1.2 – Selecting the resources
- Click on Apply.
- Then you can select the metric type. Select CPU Credits Consumed, for instance:

Figure 1.3 – Metric type
Tip
Take some time to look at the different metrics that you can choose from. This may be a part of the exam questions.
- You can select a different type of aggregation as well, such as the count, average, and more, in the filter box. At the top-right of the blade, you can select a different time range for your metric as well:

Figure 1.4 – Time ranges
- You can also pin this metric to the overview dashboard in the Azure portal. Therefore, click on the Pin to dashboard button, and then choose to pin it to the current dashboard or create a new dashboard for it. For now, select Pin to current dashboard:

Figure 1.5 – Pinning a metric to a dashboard
- If you now select Dashboard from the left-hand menu, you’ll see that this metric is added to it. This way, you can easily analyze this metric without needing open Azure Monitor.
Important note
Metrics are also available directly from the Azure resource blades. So, for instance, if you have a VM, go to the VM resource by selecting it. Then, in the left-hand menu, under Monitoring, you can select Metrics.
In the next section, we’re going to look at how to set up and analyze alerts in Azure Monitor.
Alerts
With alerts, Azure can proactively notify you when critical conditions occur in the Azure or on-premises environment. Alerts can also attempt to take corrective actions automatically. Alert rules that are based on metrics will provide near real-time alerting, based on the metric. Alerts that are created based on logs can merge data from different resources.
The alerts in Azure Monitor use action groups, which are unique sets of recipients and actions that can be shared across multiple rules. These action groups can use webhooks to start external actions, based on the requirements that are set up for this alert. These external actions can then be picked up by different Azure resources, such as Runbooks, Functions, or Logic Apps. Webhooks can also be used to add these alerts to external IT Service Management (ITSM) tools.
You can also set alerts for all of the different Azure resources. In the following sections, we are going to create an alert.
Creating an alert and an action group
To create an alert, follow these steps:
- From the Azure Monitor overview blade, in the left-hand menu, select Alerts. You can also go to the alerts settings by clicking on Create alert to create an alert directly.
- In the Alerts blade, click on + New alert rule in the top menu:

Figure 1.6 – Creating a new alert
- The Create rule blade is displayed. Here, you can create the rule and action groups. To create a new rule, you need to first select the resource. Click on the Select button in the RESOURCE section:

Figure 1.7 – Creating a new rule
- In the next blade, you can filter by the subscription and resource type. Select Virtual machines:

Figure 1.8 – Filtering by subscription and resource type
- Select the VM from the list and click Done.
- Now that we have selected a resource, we’re going to set up the condition. Click on Add condition.
- The condition blade is open, and so we can filter by a certain signal. Select Percentage CPU and click Done:

Figure 1.9 – Filtering on a signal
- Next, you can set the alert logic for this alert. You can choose multiple operators, set the aggregation type, and set the threshold value for this alert. Set the following:
a) Threshold: Static (in the next section, we are going to cover the difference between static and dynamic thresholds)
b) Operator: Greater than
c) Aggregation type: Average
d) Threshold Value: 90%
- Leave Evaluated based on with its default settings.
- This alert will notify you when the CPU usage of the VMs is greater than 90% over a 5-minute period. Azure Monitor will check this every minute:

Figure 1.10 – Setting condition values
- Click on Done to create this condition.
- Now, we have to create an action group to send the alert to. This is then responsible for handling the alert and taking further action on it. The action group that you create here can be reused across other alerts as well. So, in our case, we will create an email action group that will send out an email to a certain email address. After it has been created, you can add this action group to other alerts. Under Action group, select the Create new button.
- In the Action Group blade, add the following settings:
a) Action group name: Type
Send email.b) Short name: Type
email.c) Subscription: Select the subscription where the VM is created.
d) Resource group: Select Default-ActivityLogAlerts (to be created).
- Then, we have to provide the actual action. Add the following values:
a) Action name:
emailb) Action type: Email/SMS/Push/Voice
- Then, select Edit details and select the Email checkbox. Provide an email address and click on the OK button:

Figure 1.11 – Creating an action group
- Click on OK again.
- Finally, you have to specify an alert name, set the severity level of the alert, and click on Create alert rule:
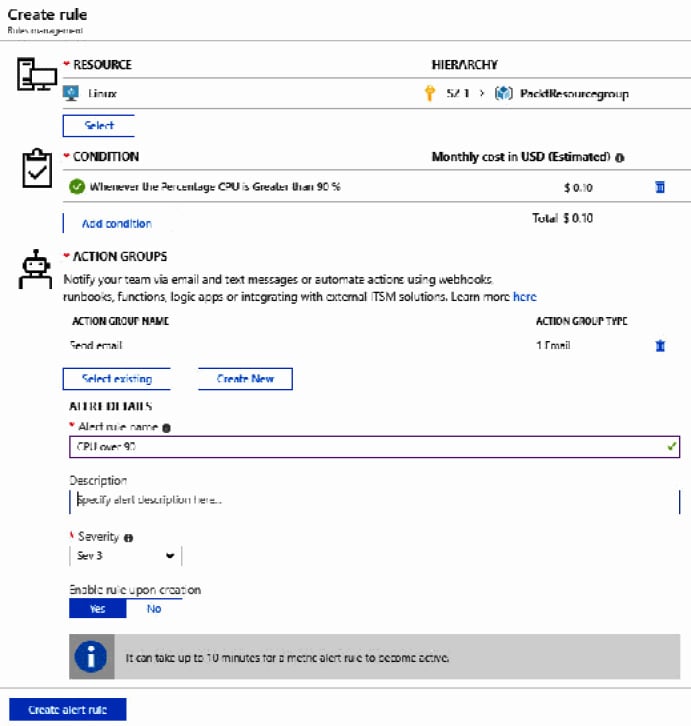
Figure 1.12 – Alert settings
We have now created an alert and an action group that will alert a user via email when the CPU goes over 90%. In the next section, we’re going to create a baseline for resources.
Creating a baseline for resources
To create a baseline for your resources, Azure offers Metric Alerts with Dynamic Thresholds. Using Dynamic Thresholds, you don’t have to manually identify and set thresholds for alerts, which is an enhancement to Azure Monitor Metric Alerts. Advanced machine learning capabilities are used by the alert rule to learn the historical behavior of the metrics while identifying patterns and anomalies that indicate possible service issues. With Dynamic Thresholds, you can create an alert rule once and apply it automatically to different Azure resources during the creation of the resources.
In the following overview, you will find some scenarios when Dynamic Thresholds to metrics alerts are recommended:
- Scalable alerting: Dynamic Thresholds are capable of creating tailored thresholds for hundreds of metric series at a time. However, this is as easy as creating an alert rule for one single metric. They can be created using the Azure portal or Azure Resource Manager (ARM) templates and the ARM API. This scalable approach is useful when applying multiple resources or dealing with metric dimensions. This will translate to a significant time-saving on the creation of alert rules and management.
- Intuitive Configuration: You can set up metric alerts using high-level concepts with Dynamic Thresholds, so you don’t need to have extensive domain knowledge about the metric.
- Smart Metric Pattern Recognition: By using a unique machine learning technology, Azure can automatically detect metric patterns and adapt to metric changes over time. The algorithm used in Dynamic Thresholds is designed to prevent wide (low recall) or noisy (low precision) thresholds that don’t have an expected pattern.
In the next section, we’re going to configure diagnostic settings on resources.
Configuring diagnostic settings on resources
You can also configure diagnostic settings on different Azure resources. There are two types of diagnostic logs available in Azure Monitor:
- Tenant logs: These logs consist of all of the tenant-level services that exist outside of an Azure subscription. An example of this is the Azure Active Directory logs.
- Resource logs: These logs consist of all of the data from the resources that are deployed inside an Azure subscription, for example, VMs, storage accounts, and network security groups.
The contents of the resource logs are different for every Azure resource. These logs differ from guest OS-level diagnostic logs. To collect OS-level logs, an agent needs to be installed on the VM. The diagnostic logs don’t require an agent to be installed; they can be accessed directly from the Azure portal.
The logs that can be accessed are stored inside a storage account and can be used for auditing or manual inspection purposes. You can specify the retention time in days by using the resource diagnostic settings. You can also stream the logs to event hubs to analyze them in Power BI or insert them into a third-party service. These logs can also be analyzed with Azure Monitor. Then, there will be no need to store them in a storage account first.
Enabling diagnostic settings
To enable the diagnostic settings for resources, follow these steps:
- Navigate to the Azure portal by opening https://portal.azure.com.
- Go to the VM again. Make sure that the VM is running, and in the left-hand menu, under Monitoring, select Diagnostic settings.
- The Diagnostic settings blade will open up. You will need to select a storage account where the metrics can be stored.
- Click on the Enable guest-level monitoring button to update the diagnostic settings for the VM:

Figure 1.13 – Enabling diagnostic settings for a VM
- When the settings are updated, you can go to Metrics in the top menu to set the metrics that are collected.
- New metrics will be available from the metrics blade after enabling diagnostic logging in Azure Monitor. You can analyze them in the same way that we did earlier in this chapter, in the Metrics section.
In the next section, we’re going to look at the Azure Log Analytics service, which is now a part of Azure Monitor as well.
Viewing alerts in Log Analytics
Azure Log Analytics is a service that collects telemetry data from various Azure resources and on-premises resources. All of that data is stored inside a Log Analytics workspace, which is based on Azure Data Explorer. It uses the Kusto Query Language, which is also used by Azure Data Explorer to retrieve and analyze the data.
Analyzing this data can be done from Azure Monitor. All of the analysis functionalities are integrated there. The term Log Analytics now primarily applies to the blade in the Azure portal where you can analyze metric data.
Before we can display, monitor, and query the logs from Azure Monitor, we need to create a Log Analytics workspace. For that, we have to follow these steps:
- Navigate to the Azure portal by opening https://portal.azure.com.
- Click on Create a resource.
- Type
Log Analyticsin the search box and create a new workspace. - Add the following values:
a) Log Analytics workspace: Type
PacktWorkspace(the name for this Log Analytics workspace needs to be unique; if the name is already taken, specify another name).b) Subscription: Select a subscription.
c) Resource group: Create a new one and call it
PacktWorkspace.d) Location: Select West US.
e) Pricing tier: Keep the default one, which is per GB.
- Click on the OK button to create the workspace.
Important note
You can also create this workspace from Azure Monitor. Go to the Azure Monitor blade, and under Insights in the left-hand menu, select More. When no workspace has been created, Azure will ask to create one.
Now that we have created a Log Analytics workspace, we can use it inside Azure Monitor to create some queries to retrieve data. We will do this in the next section.
Utilizing log search query functions
Azure Monitor is now integrated with the features and capabilities that Log Analytics was offering. This also includes creating search queries across the different logs and metrics by using the Kusto Query Language.
To retrieve any type of data from Azure Monitor, a query is required. Whether you are configuring an alert rule, analyzing data in the Azure portal, retrieving data using the Azure Monitor Logs API, or being notified of a particular condition, a query is used.
The following list provides an overview of all of the different ways queries are used by Azure Monitor:
- Portal: From the Azure portal, interactive analysis of log data can be performed. There, you can create and edit queries and analyze the results in a variety of formats and visualizations.
- Dashboards: The results of a query can be pinned to a dashboard. This way, results can be visualized and shared with other users.
- Views: By using the View Designer in Azure Monitor, you can create custom views of your data. This data is provided by queries as well.
- Alert rules: Alert rules are also made up of queries.
- Export: Exports of data to Excel or Power BI are created with queries. The query defines the data to export.
- Azure Monitor Logs API: The Azure Monitor Logs API allows any REST API client to retrieve log data from the workspace. The API request includes a query to retrieve the data.
- PowerShell: You can run a PowerShell script from command line or an Azure Automation runbook that uses
Get-AzOperationalInsightsSearchResultsto retrieve log data from Azure Monitor. You need to create a query for this cmdlet to retrieve the data.
In the following section, we are going to create some queries to retrieve data from the logs in Azure Monitor.
Querying logs in Azure Monitor
To query logs in Azure Monitor, perform the following steps:
- Navigate to the Azure portal by opening
https://portal.azure.com. - In the left-hand menu, select Monitor to open the Azure Monitor overview blade. Under Insights, select More. This will open the Log Analytics workspace that we created in the previous step.
- On the overview page, click on Logs in the top menu. This will open the Azure Monitor query editor:

Figure 1.14 – Azure Monitor query editor
- Here, you can select some default queries. They are displayed at the bottom part of the screen. There are queries for retrieving unavailable computers, the last heartbeat of a computer, and much more. Add the following queries to the query editor window to retrieve data:
The following query will retrieve the top 10 computers with the most error events over the last day:
Event | where (EventLevelName == “Error”) | where (TimeGenerated > ago(1days)) | summarize ErrorCount = count() by Computer | top 10 by ErrorCount desc
The following query will create a line chart with the processor utilization for each computer from the last week:
Perf | where ObjectName == “Processor” and CounterName
== “% Processor Time” | where TimeGenerated between (startofweek(ago(7d)) .. endofweek(ago(7d)) ) | summarize avg(CounterValue) by Computer, bin(TimeGenerated, 5min) | render timechart
Tip
Be careful, Kusto is case sensitive!
Important note
A detailed overview and tutorial on how to get started with the Kusto Query Language are beyond the scope of this book. If you want to find out more about this query language, you can refer to https://docs.microsoft.com/en-us/azure/azure-monitor/log-query/get-started-queries.
Log Analytics provides a powerful tool to explain what is happening within your Azure Infrastructure. Next, we will look at how we can use the built-in networking tools to help identify and resolve communication issues between components.
Using Network Watcher
Azure provides the Network Watcher tool for monitoring and investigating problems between devices on a Virtual Network (VNET), including the following:
- Connection Monitoring
- Performance Monitoring
- Diagnostics
- Network Security Group flow logs
Important note
A VNET is a private network you can create in your Azure subscription. VNETs are defined with set IP ranges, which in turn can be sub-divided into subnets. Some Azure services, such as VMs, must be connected to a VNET. Other services, such as App Services and Azure SQL, can optionally use VNETs to ensure traffic between them is direct and secure.
You can also see a topology map of devices to understand better the various components involved in the communication flow.
The first step in setting up the Network Watcher capabilities is to ensure it has been enabled for the region(s) you are using by following these steps:
- Navigate to the Azure portal by opening https://portal.azure.com.
- In the left-hand menu, select or search for
Network Monitor:
Figure 1.15 – Enabling Network Watcher per Region
- If the region that contains the resources you wish to monitor is set to Disabled, click the ellipses at the right and select Enable network watcher.
- On the left-hand menu, select the Topology, then select a resource group that contains resources you wish to view. In the following screenshot, I am choosing a group that includes a simple VM:
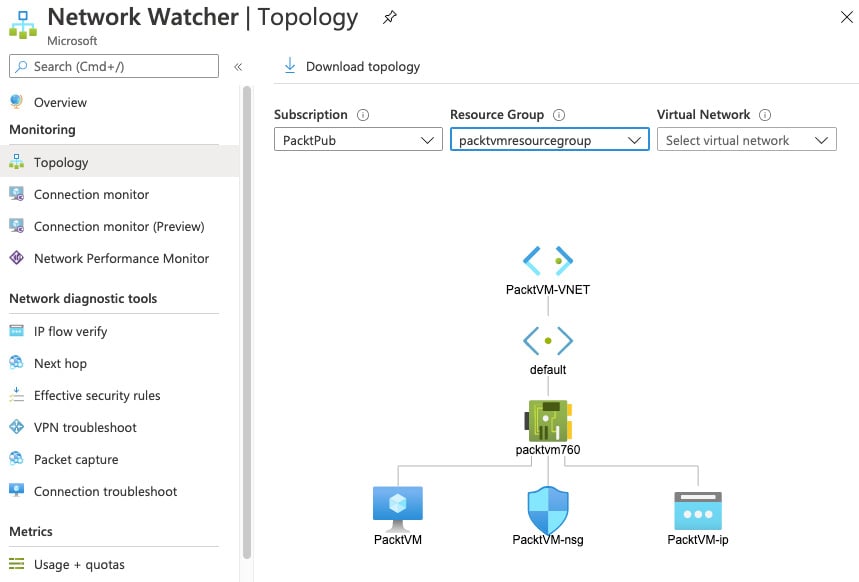
Figure 1.16 – Network Monitor Topology view
Once Network Watcher has been enabled for your region, we can now start to use the different tools, such as Connection Monitor, to troubleshoot and fix common communication problems.
Connection Monitor
When services are running, you may want to be alerted to issues with connectivity. An example might be a web server that needs to maintain a connection to a backend database server. However, the destination can be another VM, a URI, or an IP address. The URI or IP address can be either an internal resource in your Azure subscription or an external resource.
Connection Monitor allows us to set up continual monitors that can trigger alerts when communications are interrupted:
- Still in Network Watcher, on the left-hand menu, select Connection Monitor.
- Click Add to create a Connection Monitor.
- Complete the details to define a source, target, and port. For this example, instead of monitoring connection to another server, we will monitor connections to the internet, specifically to the Packt Publishing website:
a) Name:
InternetConnectionb) Virtual Machine: Source VM you wish to monitor
c) Destination:
--Specify Manually
--URI: www.packtpub.com
d) Port:
443 - Click Add:
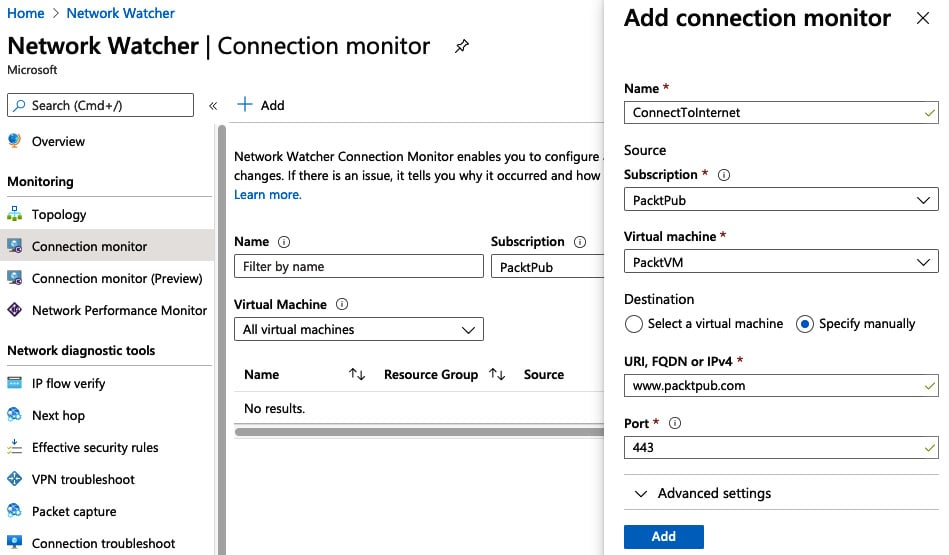
Figure 1.17 – Connection Monitor setup example
Once set up, you can select the Connection Monitor you have just created, and it will show basic details of the status and flow of traffic from source to destination. You can also set the time period to see data from the past hour up to the past 30 days as shown in the following screenshot:
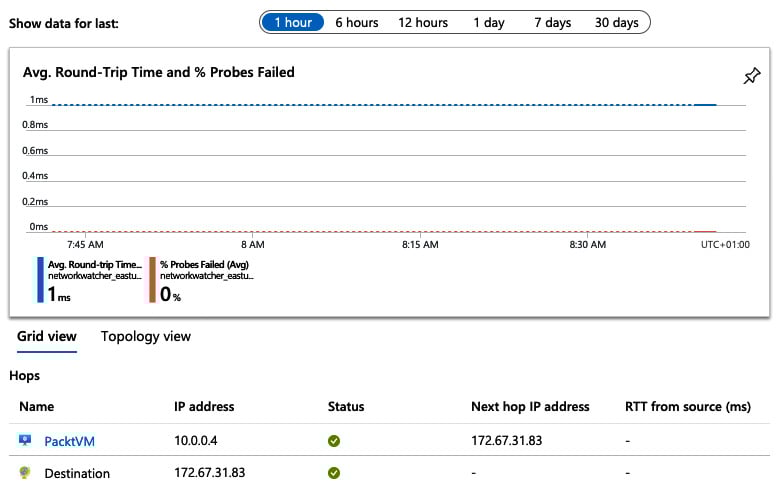
Figure 1.18 – Connection Monitor example
Connection Monitor is great for initial investigations and for setting up alerts; for more complex issues we use advanced options such as the Diagnostics tooling.
Diagnostics
When you encounter connectivity issues, Network Watcher diagnostics offers a range of tools to help pinpoint the problem.
The first step in troubleshooting connectivity issues is to confirm that traffic is flowing.
IP Flow Verify
IP Flow Verify allows you to confirm the flow of traffic from a source to a destination is working. Set up a typical test by performing the following steps:
- From the Network Watcher blade, select IP flow verify from the left-hand menu.
- Select your VM and network interface you wish to test.
- Select the desired protocol (TCP or UDP).
- Select the direction of traffic you want to check.
- Confirm the local (source) IP address and port your traffic flows on.
- Enter the remote (destination) IP address and port.
The following figure shows an example request. When the Check button is clicked, we can see a status response returned. In the example, we can see the request has failed, but importantly we see it failed because of the DenyAllOutbound Network Security Group rule:
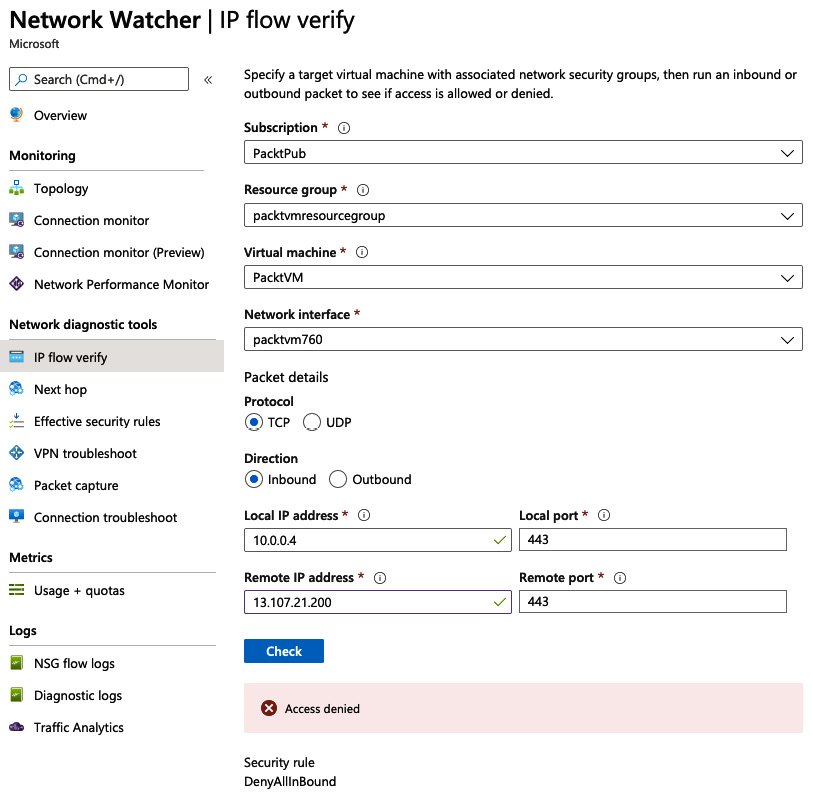
Figure 1.19 – IP flow verify example
IP flow verify helps to confirm that end-to-end communication is functioning, but if you do find problems you can use other Network Watcher tools to continue your investigations.
Next Hop
The subsequent step in identifying communications issues could be to understand the route traffic takes from point a to point b, and the Next Hop service helps with this:
- Still in Network Watcher, in the left-hand menu, click Next Hop.
- Define the source VM you wish to check connectivity from.
- Enter the IP address of the service you are attempting to reach and click the Next Hop button.
The example in the following screenshot shows the next hop to the IP address (one of the Bing.com addresses) is the Azure Internet egress appliance, and the route to it has been defined in the system route table (route tables will be covered in Chapter 4, Implementing and Managing Virtual Networking):
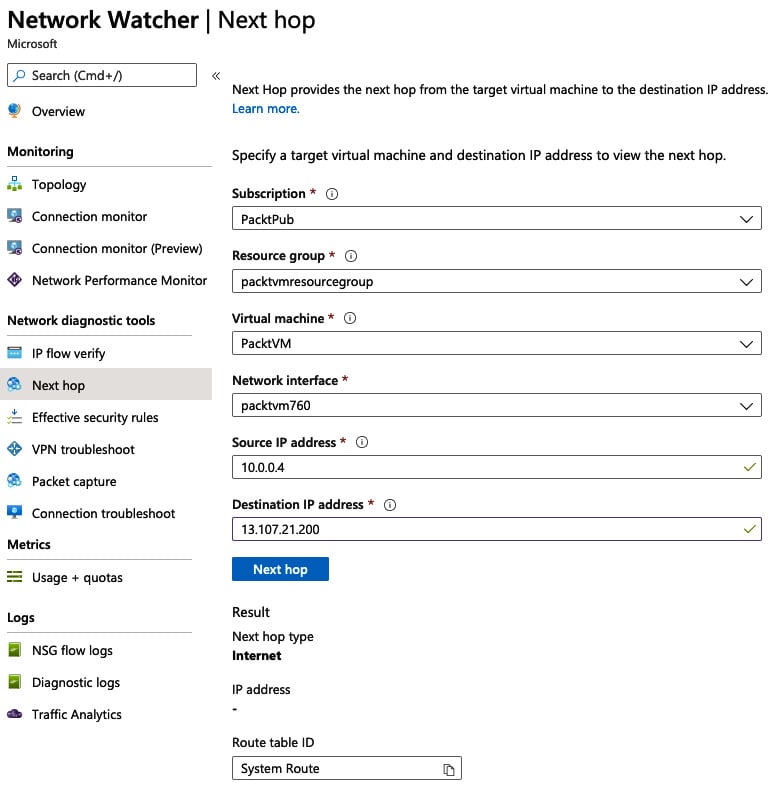
Figure 1.20 – Next Hop configuration example
Depending on the results from the IP flow verify and Next Hop tools, the next step in your troubleshooting process may be to look at access issues.
Viewing effective security rules
A common cause of issues is a misconfiguration of Network Security Groups (NSG) between devices. We cover NSGs in Chapter 10, Implementing Load Balancing and Network Security. In brief, they allow you to define firewall rules on VNETs or devices.
Restrictions on allowed IP addresses and ports can be set in multiple layers, and as such, can become complex and challenging to manage. For this reason, you can use the effective security rules option:
- Still in Network Watcher, in the left-hand menu, click Effective security rules.
- Select the Subscription, Resource group, and Virtual machine you wish to check. The following screenshot shows an example:

Figure 1.21 – Configuring the effective security rules option
- Once your VM has been selected, the effective rules will be listed, separated by NSG, Inbound rules, and Outbound rules. The following screenshot shows a typical result:
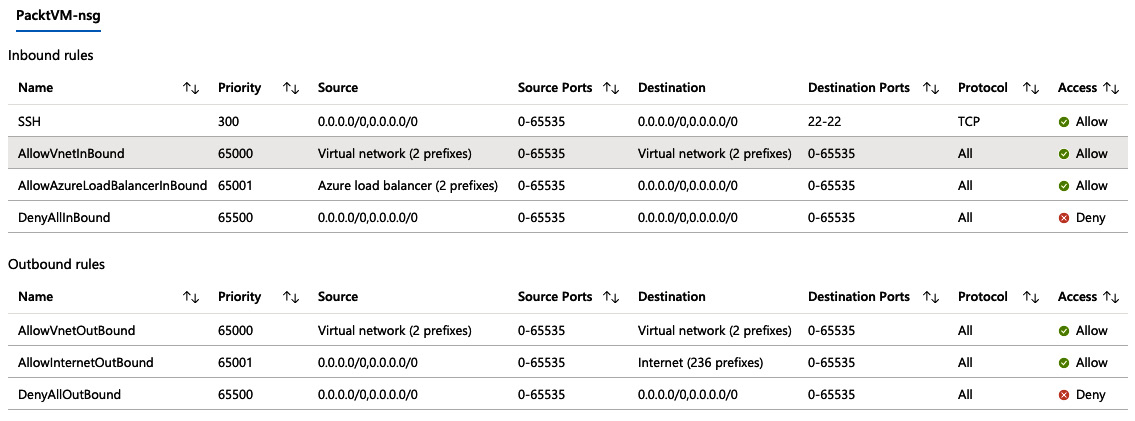
Figure 1.22 – Example of effective NSG rules in action
We will now have a look at using Packet Capture to examine the data.
Packet Capture
When everything looks OK but you are still experiencing issues, you may need to look in detail at the actual traffic being sent and received. Specialist tools are available for analyzing packet information, and through the Network Watcher, you can set up Packet Capture to collect data for a specific amount of time and then examine that traffic:
- Still in Network Watcher, in the left-hand menu, click Packet Capture.
- Select your VM.
- Choose whether to store the Packet Capture data in a storage account (we cover storage accounts and how to create them in Chapter 2, Creating and Configuring Storage Accounts), in the VM itself, or both.
- Optionally set the maximum and minimum bytes per capture or a time limit.
The following screenshot shows an example of what this looks like:

Figure 1.23 – Example packet capture setup
- Optionally click +Add Filter to enter more precise details of the source and destination for which you want to capture data, as in the following screenshot:

Figure 1.24 – Packet capture filters
- Click Save.
- The capture session will automatically start; let it run for a few minutes.
- Stop the capture by clicking the ellipsis at the right of the session you created and click Stop.
- Click on the session, and the file link will be presented in the lower pane.
- Click on the capture link to download it.
The following screenshot shows an example of how this might look:
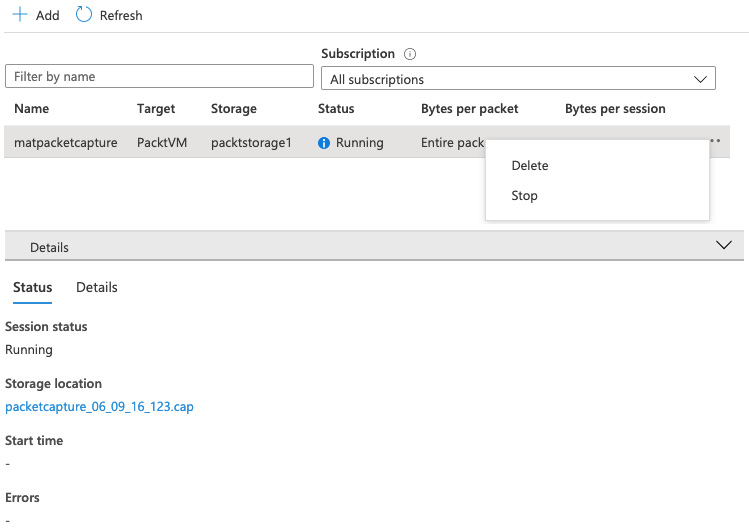
Figure 1.25 – Example Packet Capture
The Packet Capture can then be opened in a viewing tool for a detailed examination of the traffic. The following screenshot shows an example of how this might look:
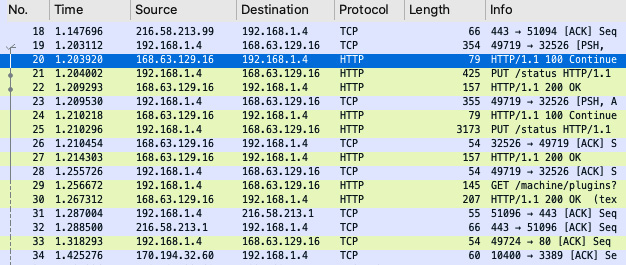
Figure 1.26 – Example traffic details from a Packet Capture
As we have seen, Network Watcher is a robust set of tools to help identify issues with connectivity and to provide a detailed analysis of the flow of traffic. Also, it is important for monitoring traffic and events for security purposes.
Monitoring security
Azure manages and protects many aspects of your solutions for you; however, it is still crucial that you monitor for intrusion events either at the platform level or in your hosted applications.
To help you monitor and protect your environment, you can use the Azure Activity log.
Activity log
Every action you perform in Azure, either directly in the portal, via PowerShell, the Azure CLI, using DevOps pipelines, or even as a result of an automated task, is logged.
These logs can be viewed at the resource level, resource group level, or subscription level. The process is the same for them all, but the following is an example of how to view subscription events:
- Navigate to the Azure portal by opening https://portal.azure.com.
- In the left-hand menu, select or search for
Subscriptions. - Select the subscription you wish to view.
- In the left-hand menu, click Activity log.
As the following screenshot shows, you are presented with a list of events showing what happened, when, and who or what initiated it. Events are grouped by the operation name, and clicking on the operation will provide more granular details of the events:

Figure 1.27 – Azure Activity Logs
Above the events are a series of filters to set the level you wish to view, over what time span, and a severity setting.
The severity can be filtered by Critical, Warning, Error, and Informational.
You can also add additional filters by clicking the Add Filter button, which then allows you to filter by the following properties:
- Resource Group
- Resource
- Resource Type
- Operation
- Event Initiated By
- Event Category
To see more detail of a particular event, follow these steps:
- From the list of events, expand the Operation Name group by clicking on the arrow, as shown in the previous screenshot.
- Now click on the event to show the summary.
- Click JSON to see more details of the event. The following screenshot shows an example:

Figure 1.28 – Example event details in JSON
- If you want to be alerted whenever this event occurs, click New Alert Rule and then create the alert as before.
Using the Event viewer and creating relevant alerts will help identify inappropriate activities within Azure, either via the console or other methods.
Monitoring security is an important and critical activity to ensure the safety of your systems and data. In the following section, we look at another equally important task—keeping control of your costs.
Managing costs
Because Azure is a Pay As You Go service, and due to the range and power of the available components, it can be easy to lose sight of costs.
Fortunately, Azure provides several tools to help monitor and alert you on your ongoing and forecast spend:
- Navigate to the Azure portal by opening https://portal.azure.com.
- In the left-hand menu, select or search for Subscriptions.
- Select the subscription you wish to view.
The overview page of a subscription shows you a high-level view of your current spend, broken down by your most costly resources, and a forecast based on currently deployed infrastructure, as shown here:
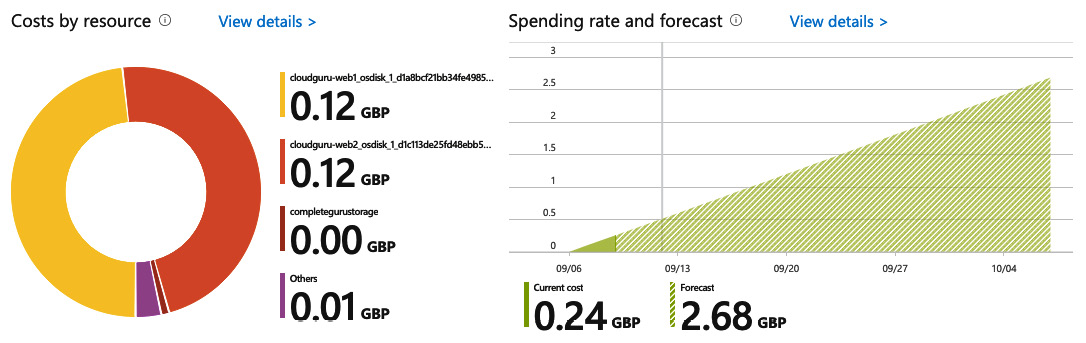
Figure 1.29 – Example costs dashboard
For a more detailed analysis, you can use the Cost Analysis tools.
Cost Analysis
In the Subscription blade, under Cost Management, click the Cost Analysis left-hand menu option. This view shows a more detailed and customizable set of charts. As shown in the following screenshot, the default view provides a breakdown by Service name, Location, and Resource group name:
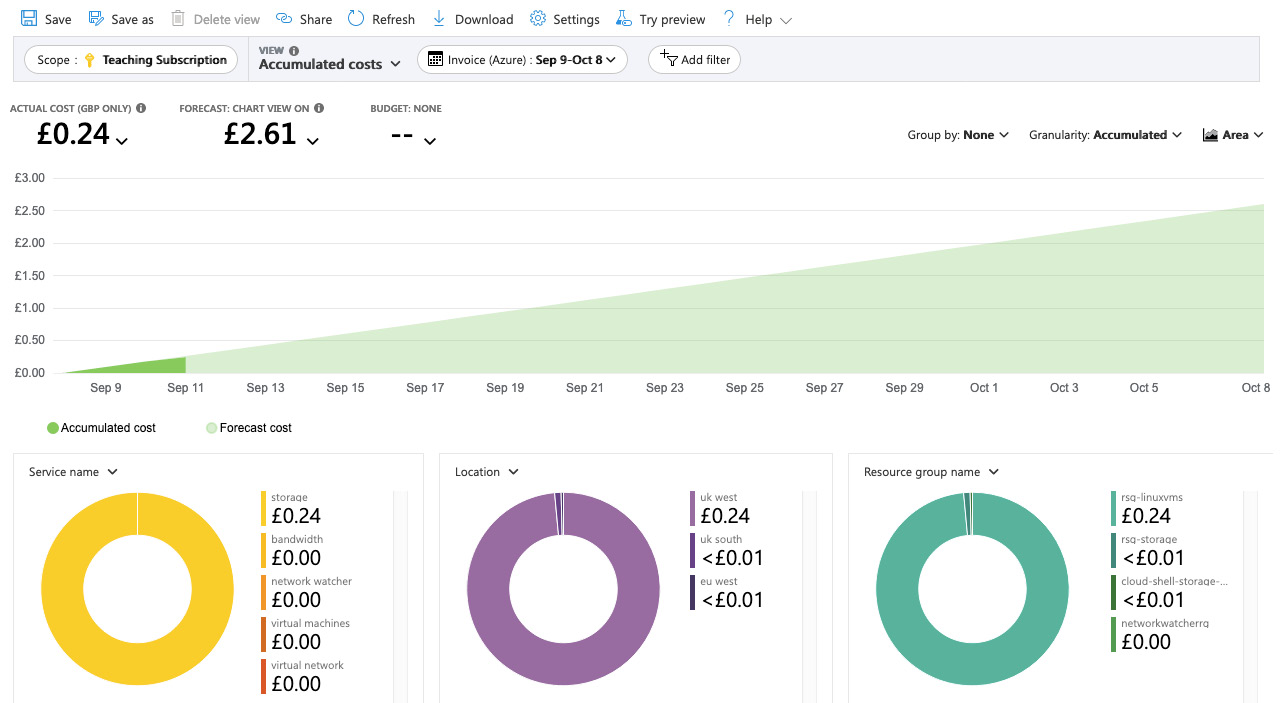
Figure 1.30 – Cost analysis details
This view can be configured as per your requirements using a mixture of the filtering and selection options in the top menu. You can view costs as charts or text and set timespans or grouping options.
As an example of what can be achieved through this view, we shall create a monthly cost per resource table that can then be exported to CSV:
- From the current Costs Analysis View, click the View menu, which by default will be Accumulated costs. The following screenshot shows the available options:

Figure 1.31 – Example subscription costs
- Change the view to Cost by Resource.
- Now select the Granularity option and change it from None to Monthly:

Figure 1.32 – Changing the Granularity to Monthly
- From the top menu, click Download, choose your export format, such as
CSV, then click Download data.
Now that we have created a monthly cost per resource table, let’s take a look at budgets.
Budgets
Being able to view your current and forecast spend is, of course, important, but even more useful is the ability to alert you when thresholds are met. For this, we can use Budgets:
- From the current Subscription blade, click the Budgets option in the left-hand menu.
- Click Add on the top menu.
- Set the name, for example,
MonthlyBudget. - Set a budget amount, for example,
30. The budget amount is specified in your local currency. - Click Next.
- Set an alert as an amount of your monthly budget. For example, if you want to be alerted when you have spent 80% of your budget, enter
80. - Assign an action group if you set one up previously.
- Enter a recipient email for whoever should be alerted when the budget alert is reached.
- Click Create.
Setting budgets doesn’t prevent you from overspending, but it will alert you when your set thresholds are met.
Summary
In this chapter, we covered the Implement and Monitor Azure Infrastructure objective. We covered the various aspects of Azure Monitor and showed how you can use metrics to monitor all of your Azure resources and alerts to get notified when certain things are happening with your Azure resources.
We saw how Log Analytics and created queries so that we can get valuable data out of the logs. We looked at how Network Watcher can help you identify and resolve connectivity problems between devices. We covered how Activity Logs can highlight and notify you of security events. Finally, we also looked at how we can use the cost reporting and alerting features to help control costs.
In the next chapter, we will cover the second part of this exam objective. We will learn how to create and configure storage accounts.
Questions
Answer the following questions to test your knowledge of the information in this chapter. You can find the answers in the Assessments section at the end of this book:
- Is Azure Log Analytics now a part of Azure Monitor?
a) Yes
b) No
- Suppose that you want to create a query to retrieve specific log data from a VM. Do you need to write a SQL statement to retrieve this?
a) Yes
b) No
- Are action groups used to enable metrics for Azure Monitor?
a) Yes
b) No
- If you need to confirm connectivity between two endpoints on a specific port, what monitoring tool could you use?
a) IP flow verify
b) Next Hop
c) Packet capture
- What Azure feature would you use to create a monetary consumption alert from a resource group?
a) Budgets from Resource Group
b) Budgets from Subscription
c) Budgets from Azure Monitor
Further reading
You can check out the following links for more information about the topics that were covered in this chapter:
- Azure Monitor overview: https://docs.microsoft.com/en-us/azure/azure-monitor/overview
- Azure Resource logs overview: https://docs.microsoft.com/en-us/azure/azure-monitor/platform/diagnostic-logs-overview
- Overview of log queries in Azure Monitor: https://docs.microsoft.com/en-us/azure/azure-monitor/log-query/log-query-overview
- Create custom views by using View Designer in Azure Monitor: https://docs.microsoft.com/en-us/azure/azure-monitor/platform/view-designer
- Azure Network Watcher:https://docs.microsoft.com/en-us/azure/network-watcher/network-watcher-monitoring-overview
- Azure Security Monitoring: https://docs.microsoft.com/en-us/azure/security/fundamentals/management-monitoring-overview