Download code from GitHub
Getting Started with QlikView
Welcome to the world of QlikView! Data analytics has become a hot topic in today's world of cutthroat competition in various sectors, such as finance, lending, and online e-commerce sites. There are a lot of data analytics tools available on the market, which are used by various organizations to keep track of data.
One of the tools that stands out is QlikView. QlikView is one of the most frequently used analytics tool on the market, due to its reliability and ease-of-use. QlikView combines a lot of the industry-standard tools, such as artificial intelligence, Internet of Things (IoT), and a unique analytics engine, to create a unique package that can be used for efficient data analysis. Sounds interesting, doesn't it? Let's dive right in to the huge world of QlikView, and learn how to create analytics applications. This chapter will serve as an introduction to QlikView and all of its quirks and features, covering the following topics:
- Installing QlikView
- Creating a document
- Important terminologies in QlikView
Prerequisites
First and foremost, let's look at the prerequisites required for this book. The main prerequisite is that QlikView needs a Windows system, and for that, you need at least Windows 7 or higher, so that you can get the best output from your QlikView dashboard. And it is also highly recommended that you should have some basic understanding of reporting and analysis using Excel, because QlikView mimics most of the features, such as expressions, and charts, which are currently present in Excel.
It also has a flavor of SQL, as you will see that you don't really have to create queries, since QlikView creates the queries for you. So, having an understanding of basic SQL queries, such as SELECT, will give you an immense boost when you are actually undoing the selection of data, or doing emerging joins in the chapter.
Installing QlikView
Let's dive right in, and download the QlikView application for our use. We will use the following steps to do that:
- Our first step is to open the web browser and go to https://www.qlik.com/us/. The following screenshot shows the landing page for the website:

- Once you get this, click on Products, and navigate to the QlikView menu item, as shown in the following screenshot:

- When you click on the QlikView menu item, you will be redirected to the page shown in the following screenshot, where we will click on the Try It Free button:

- This will redirect you to the page shown in the following screenshot, which has a registration form to be filled in:

- When you fill in the required details, and click on the Send Form button, it will redirect you to the download page, which contains a User License Agreement that we have to accept. The following screenshot shows the download page:

Once the download is completed, the installation is pretty straightforward. The installation wizard will take you through each step, and the final setup will take anywhere from 30 seconds to 2 minutes, depending on your system configuration.
Exploring QlikView
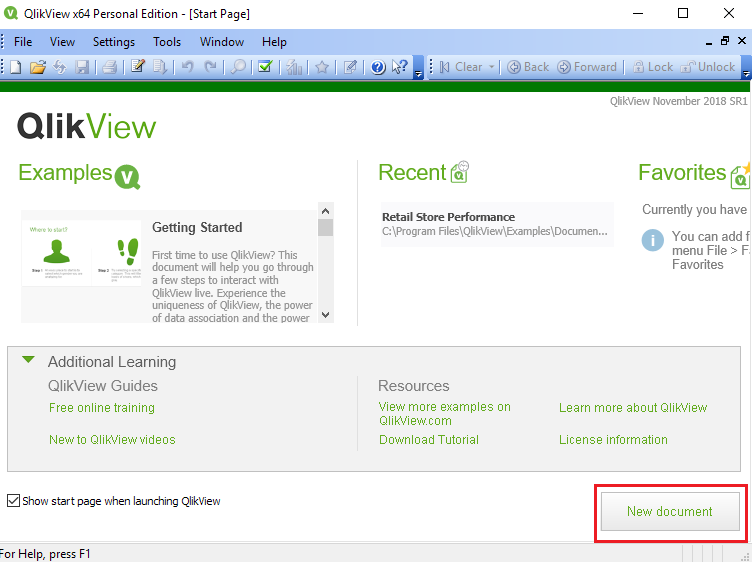
Now that we have installed QlikView, let's explore it using a few demo examples that are available. The following screenshot shows the user interface (UI) of the tool:

On the left-hand pane, it shows you the the demo examples that are bundled with the QlikView installation. On the central pane, it will show you a list of recent documents, and on the right-hand pane, it will show you any favorite document you have. So, you may have a lot of recent documents, but very few favorite documents that you want to maintain or develop. So, here you can create, or see, the list of your favorite documents. The bottom part of the UI displays some information, such as the additional learning guides and resources. And, finally, down at the bottom-right of the window, you have the option of creating a new document.
Alright, now, let's go ahead and open up a demo app. Let's open the Retail Store Performance example present in the Examples pane. This redirects you to the dashboard for the app, which looks similar to the following screenshot:

Here, we have a small app, called Retail Store Performance. In this, the Get Started button is present just above the Explore Store Performance column. There are two more columns present there, namely, Analyze Store-level Assortment and Monitor Customer Satisfaction. This is a pre-built app to give you an idea about what kind of apps you can develop, and how they'll look and feel.
So, if we click on the Dashboard tab, it shows us a dashboard view. The following screenshot shows what the Dashboard looks like:

Then, we click on the next tab, which shows the Sales view:

The Store Map shows us the map view. It has a map of all the stores, and the table containing the details of each store. The following screenshot shows what the Store Map view looks like:

The last tab is the Customer Satisfaction overview. This tab contains a summary of all the customer satisfaction scores and surveys conducted by the stores. The following screenshot shows what this tab looks like:

In the Customer Satisfaction tab, the center pane contains some demo charts, and, below that, in the table, metrics have been provided. On the left-hand side, we can see some filters, such as Region, District, and District Manager. These filters essentially sort the information on the basis of whichever value you choose, so that it becomes easy to look at specific information.
For example, if I want to see the Germany region information, I just click on the Germany value, and the information will be filtered for me. Similarly, within the Germany region, if I want to select any district, for example, District 10, then further information will be filtered for me on the basis of the district as well as the region. The following screenshot shows what this looks like:

The best part is that information will be filtered across all these tabs, and the green light on the tab is indicating that the information has been filtered based on the selection made in the current tab.
So, that's a quick introduction of QlikView using a demo app, and how filters impact the multiple colors present in the values. We will look at this in much greater detail later on. We will learn about how we can create these kinds of sheets, and put all of this information into action. In the next section, we will start creating our first document in QlikView.
Creating a document
Here, we will look at the different ways by which we can create a new document in QlikView. We will look at how to save and close a document, and, finally, we will look at how we can reopen the recently-created document. So, let's go into QlikView and see these things in action:
- As we saw in the previous section, the New document button, located at the bottom-right of the screen, can be used to create a document for use in QlikView. So, let's go ahead and click on that now:
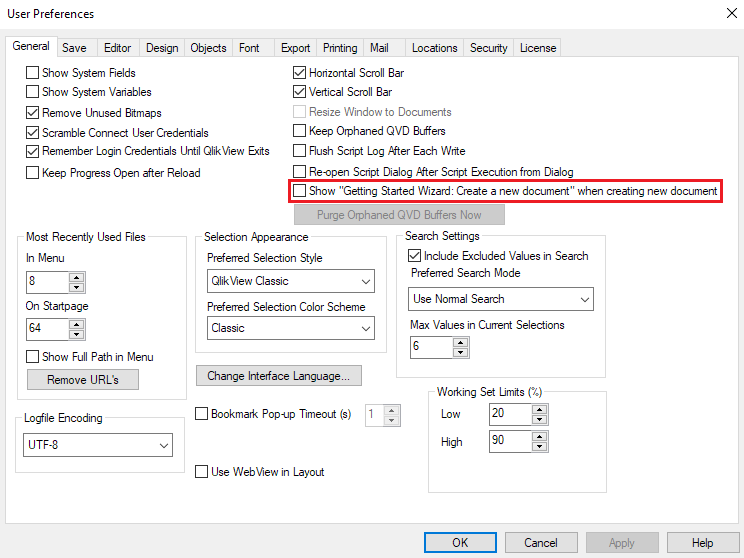
Once you create a new document, the Getting Started wizard will appear and ask you to create a new document. This wizard is divided into multiple categories, such as Data source, Data presentation, Save file, Choose chart type, Populate chart, and Selections. All of these are very standard operations within QlikView. However, once you gain some experience, you will see that this wizard doesn't offer the options that you really want. So, generally, we are going to avoid this. We want to perform all of these operations, but in our own customized way.
- Before we save, we will go into the User Preferences settings and uncheck the Show wizard option, as shown in the following screenshot:
- We will test this out now. We can see the document name is QV1 by looking at the top of the window. With the shortcut Ctrl + N, we will create a new document, which will be automatically named QV2, as seen in the title pane.
So, these are the various options that you have whenever you are creating a new document, and it is my recommendation that the wizard is not a very good option. This is because there are a number of things that, as a QlikView developer, you need to do, and it's pretty easy to do it in a custom way, rather than following a standard method, as the latter does not allow us to completely utilize all the QlikView functionality that you, as a developer, want to use.
Saving the document
Once we have created a new document, the next option we will check out is saving the document. For that, we again have multiple options.
The first option is to go into the toolbar and press the Save button there, as shown in the following screenshot:

Another option is going into the File menu and clicking Save, or pressing the shortcut Ctrl + S.
So, let's go ahead and click Save. Once we click Save, it will ask you where you want to save this QlikView document. We can save it wherever required, so I will select QV1 and save it.
Once I save it, I am pretty much done, and I can close the window. Whenever we close the document, we need to close the entire application. There are several ways to close the application, similar to opening the document.
Let's go ahead and summarize the topics that we have just covered. We have looked at the different ways to create a new document, we have looked at how we can save and close a document, and then, finally, we have looked at how to reopen a recently-created document. In the next section, we will look at QlikView in depth and its important terminologies.
Important terminologies in QlikView
Here, we're going to look at QlikView selections, QlikView architecture, and how we can answer a business question with the help of a QlikView dashboard. So, let's go ahead and learn a little bit about QlikView selections with the help of a QlikView demo dashboard.
QlikView selections
Generally, in QlikView, selections are also referred to as filters. Let's explore selections by going to QlikView and opening up the Movies Database file. Let's move to the Dashboard tab to see the selections in action:
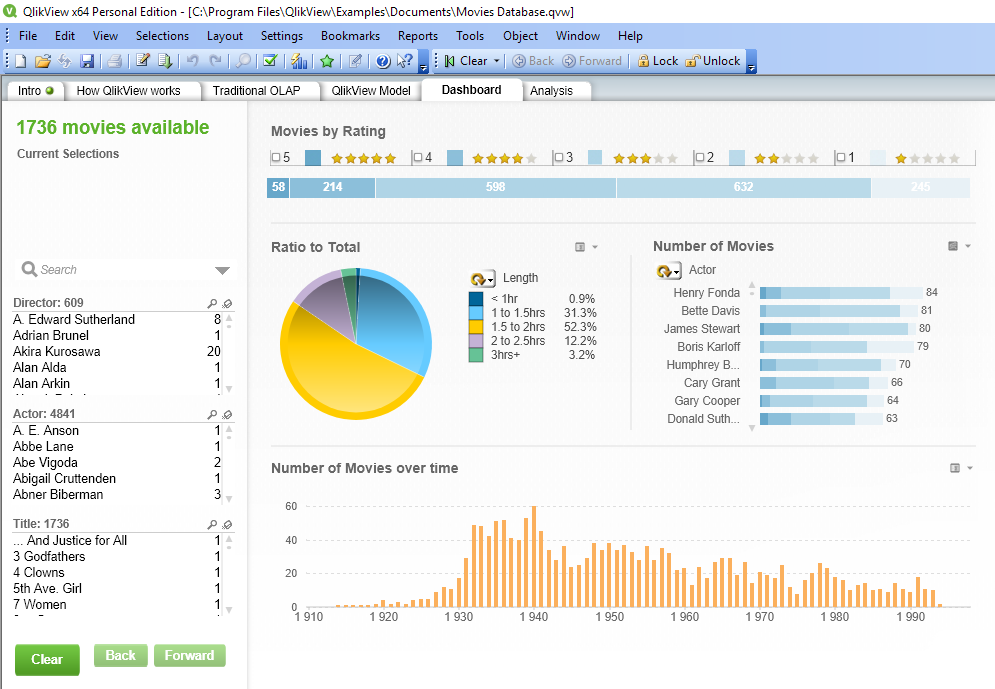
Here, we have different types of selections available, such as Director, Actor, and Title.
These can be referred to as a selection, filters, or a list box, which will be covered later. But, for now, let's go ahead and use selections as the terminology.
The selections we mentioned previously are all different types of text selections that I have at my disposal. At the top, I have some numeric selections as well, such as Movies by Rating. This has five selections for five stars, and I can select any rating between 1 to 5, and see the Dashboard view refreshed for me. For example, let's select a movie rating of 5 to see which movies have five star ratings, which gives us the following output:
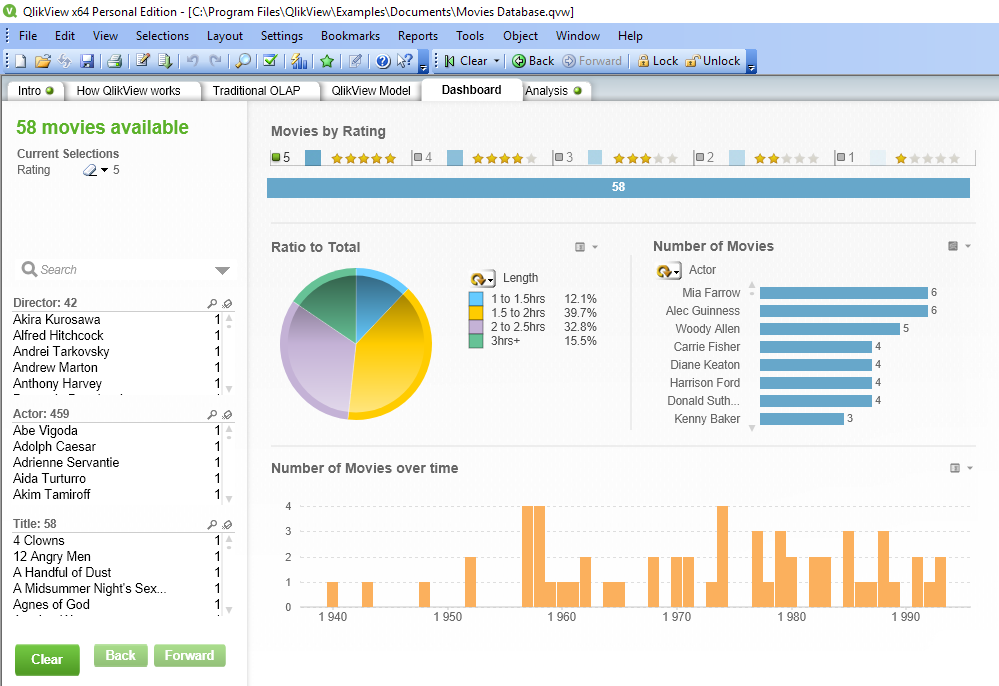
The dashboard is now filtered with the movies that got a five-star rating. With this, we understand that within QlikView, numeric filters are generally given at the top, and textual filters are generally given on the left-hand side. The placement of filters or the selections is not a mandatory requirement, it's just that, over a period of time, that's how QlikView developers have been accustomed to using the numeric and textual filters, and it has automatically become standard.
The next thing about the selections that I want you to observe in the numeric filters in the preceding screenshot, is that only 5 has been highlighted as green. It is an important rule related to the selections in QlikView, where all the values that are grayed out are not related to the selection.
Also, in the textual filters, you will see that there are a lot of values that have been grayed out. This means that all those directors have never created any movie that have been rated as a five. On the other hand, there are a few directors, such as Steven Spielberg and Woody Allen, who have a lot of five-star rated movies. For example, Woody Allen has eight different movies with five-star ratings.
So, if I am really interested in seeing which movies those are, I can click on Woody Allen to filter them. So, let's go ahead and select Woody Allen. This gives us the following screenshot:
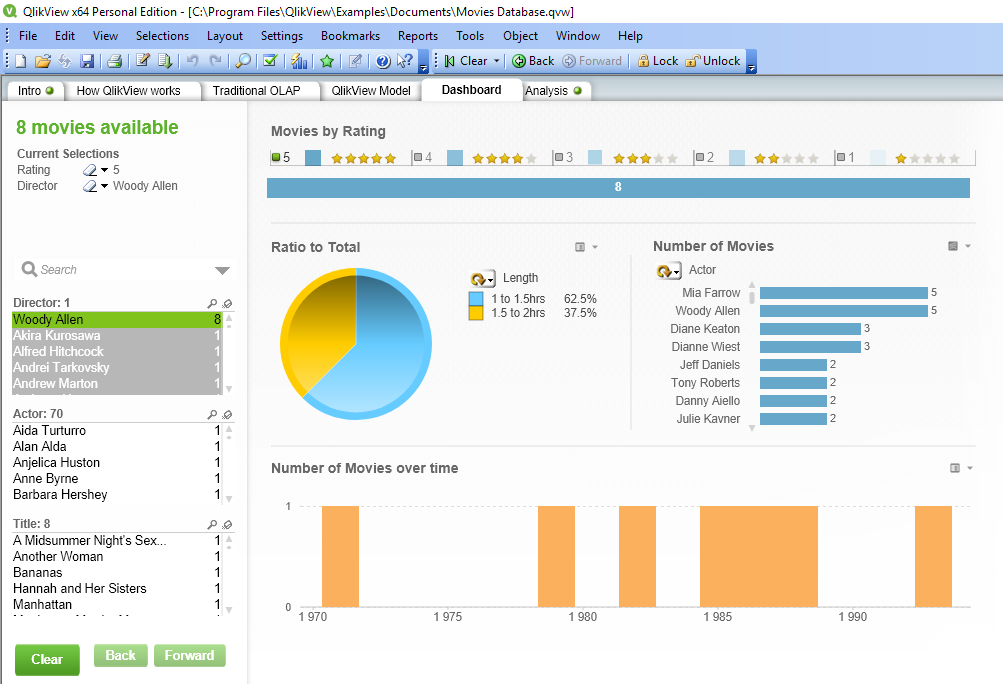
We can see eight movies in the textual filters, such as A Midsummer Night's..., Another Woman, Bananas, Hannah and Her Sisters, and many more. So, now we have an idea about the different types of selections that you have.
QlikView architecture
Now, let's look at the QlikView architecture using the following diagram:
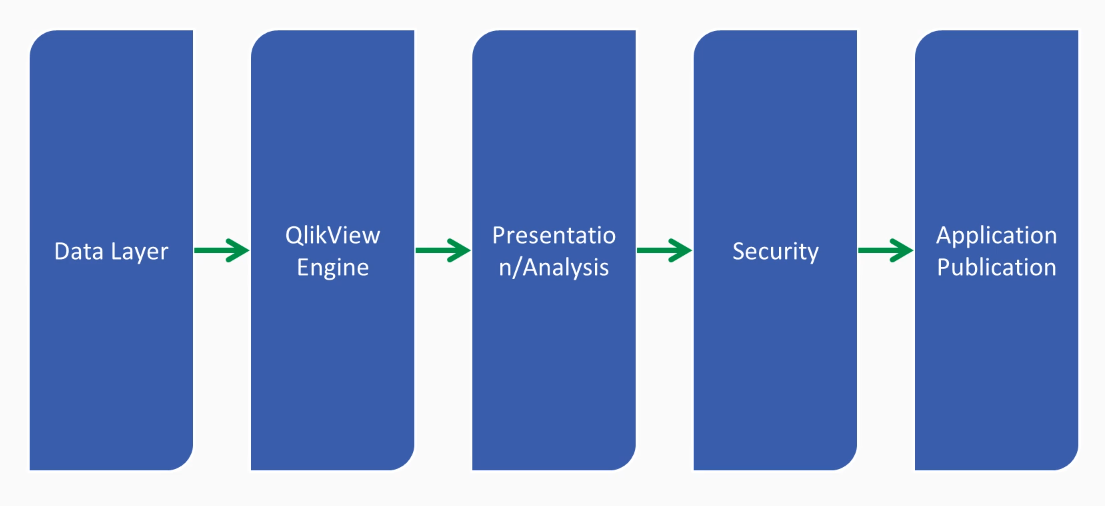
In the QlikView architecture, the very first layer is the Data Layer. You bring the data from the external resources; for example, from an Excel file, from a database, or from the web. Once you get the data into the data layer from various sources, your data gets loaded with the help of the reload option into the QlikView Engine. The QlikView Engine is responsible for creating all the joints and queries by default, using its patented in-memory logic. What that means, is that QlikView creates the logic within the table, so you don't really have to write any SQL query, but, with the help of selections, you're generating the SQL query on the fly within the QlikView system with the help of the QlikView Engine. After that, you have the Presentation/Analysis layer, where you basically create the different types of charts and visualization, as well as filters for the consumption of the end user. After this, you have a Security layer, where you secure the data to make sure that the right information is available to the right user. QlikView has a very flexible security model. After that, the final layer is Application Publication. With the help of the QlikView server, you can publish your application on a QlikView server and distribute it to your end user, and they can view the application within their browser, or mobile, or in a tab, wherever they like. So, there you have it, that's your high-level introduction about QlikView architecture.
Exploring data in QlikView
Now, let's look at the next step, which is answering a business question. So, let's go to the QlikView application we were evaluating for the first section, which was the Movies Database. Here, we have different types of selections, and, if you want to remove these selections, we can click on the Clear button.
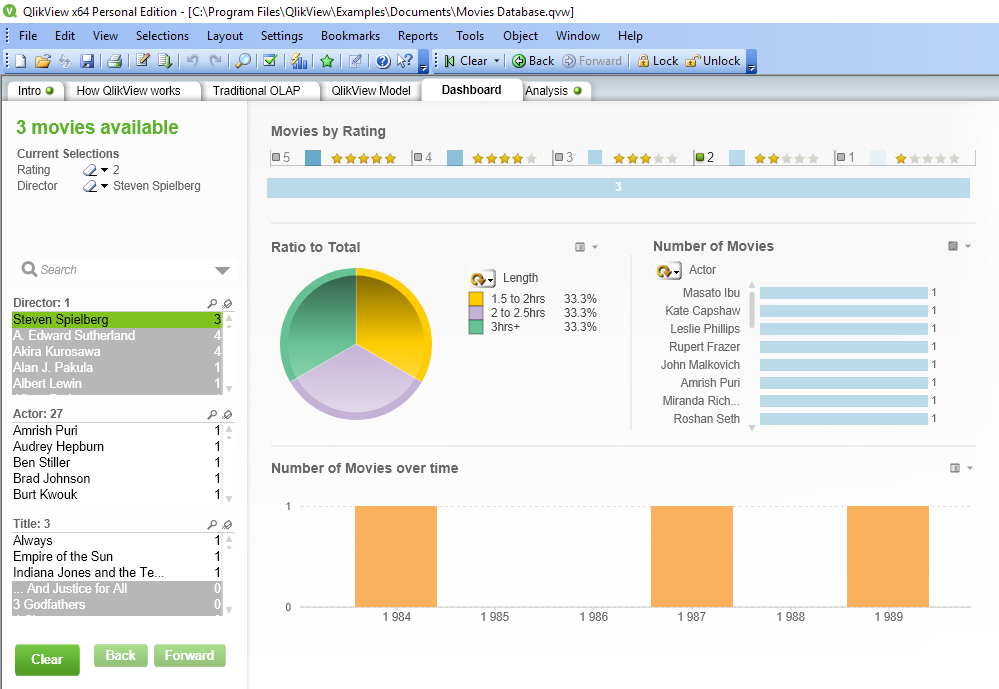
Now, if you observe, all the selections have been removed, and we can frame our business question and see, with the help of QlikView, whether we can get an answer. So, let's say I want to see all the movies that are directed by Steven Spielberg.
For that, we'll go to the search box, and start typing Steven. As we type, we can see that the characters we type are available in the Actor, Director, and Title filters. We'll expand the Director filter, and there you will see Steven Spielberg.
We'll click on that, and the dashboard automatically changes to show data related to Steven. In the numeric filters, we can see that Steven has movies that have received ratings from 2 to all the way to 5. Now, let's see which movies have received two-star ratings. We can see the Dashboard for Steven here:
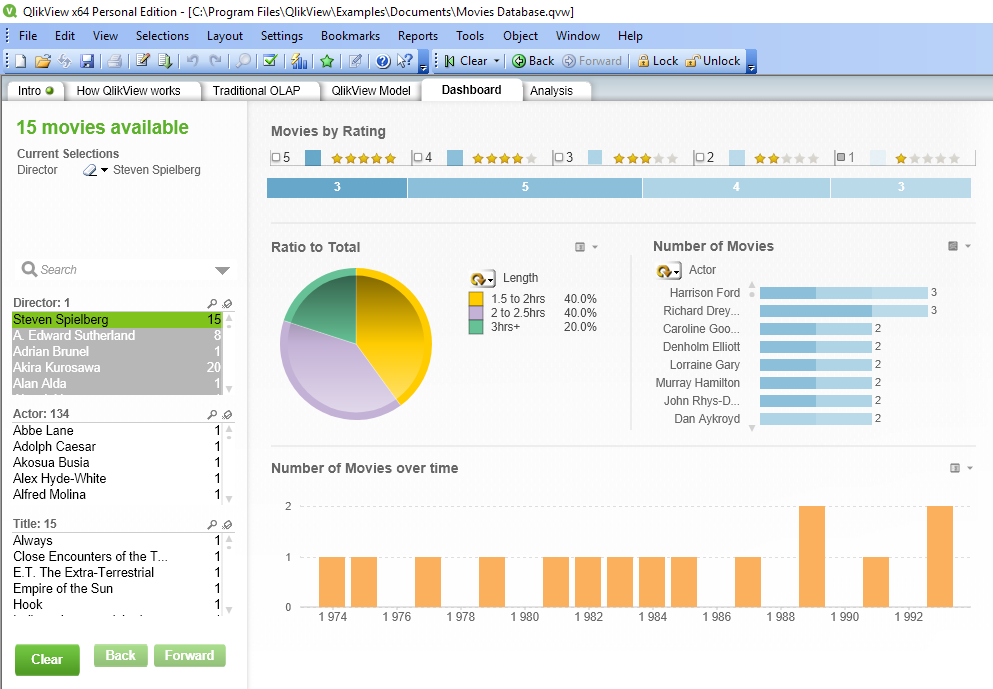
So, we'll click on the 2 numeric filter, and the Dashboard view reveals the three movies that have two-star ratings, namely Always, Empire of the Sun, and Indiana Jones and the Temple of Doom. The following screenshot shows the Dashboard view for the two-star rated movies created by Steven:
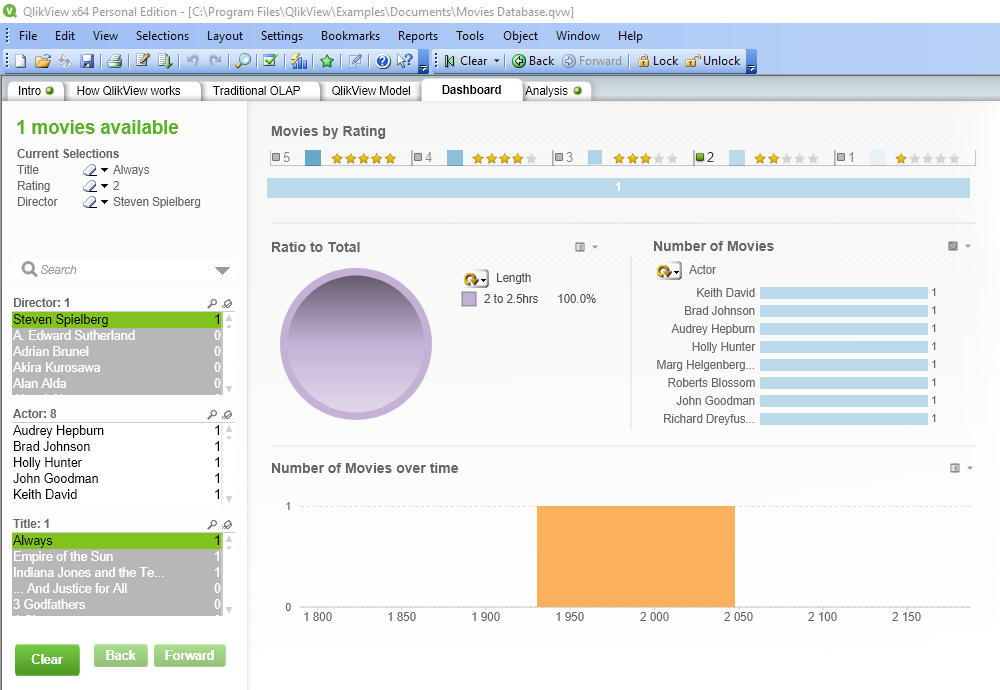
Now, let's look at the details of the movie Always. If I select Always, we'll get all the information about the movie, such as who acted in the movie and its length. The following screenshot shows this:
Now, if we want to remove the selections, there are a couple of ways in which to do so. We can either click on Clear in the toolbar, or we can click on the movie that is currently selected, which is, Always. In the same way, we can clear the Director selection, too.
But, in the Current Selections section, it is indicating that the 2 rating is still selected. We will clear that out by clicking on the 2 numeric filter. Similarly, if I am interested in looking at all the movies that have received three-star ratings, let's say, in the period from 1950 to 1960, I can select the area between 1950 to 1960 in the bar chart with the help of the selection click. This expands the bar chart view to 1950-1960. So, if I have further questions, I can go to Director, Actor, or Title, and get my answer based on the data that I have.
So, here we have looked at QlikView selections, what they are, and what green, gray, and white really mean. We have looked at the QlikView architecture at a very high level, and, finally, we have looked at how we can get our answers with the data, by going to the deepest levels of data that is available to us.
Summary
This marks the end of the first chapter. In this chapter, we looked at QlikView and learned what it is, how it works, and where it can be used. We learned how to install and configure it for use in our system. After that, we explored the various functions in QlikView by looking at one of the examples provided in the application. Finally, we looked at the various terminologies in QlikView and how they affect our work.
In the next chapter, we will look at getting data in QlikView, and creating our first app.