Download code from GitHub
If you are a Tableau user looking for information about its new features and how to use them, you are in the right place. If you are new to Tableau, start with Chapter 2, The Tableau Core, to learn about the basics and advanced features of Tableau. Throughout this book, many new features will be explained. Having finished all of the chapters, you can come back here to learn about the newest features in detail.
In this first chapter, we'll cover the new features in Tableau's 2019 releases (2019.1 and 2019.2). This chapter will be divided into two parts, as follows:
- Connector improvements
- Worksheet enhancement
- New actions
- Empowered Dashboard
- Tableau Server
For each part, each major feature has its own section. Next to the name of the feature, between brackets, the version that introduced the new feature will be specified.
Let's start with Tableau Desktop; get ready to discover many great new features!
To understand and reproduce the examples provided in this chapter, you need to know how to connect to data, build a data source, and create Worksheets and Dashboards.
Some other data source improvements are as follows:
- OAuth is enabled for a Snowflake connector (2019.1)
- You can directly use the power of spatial information in a PostgreSQL+PostGIS database without having to export or prep the data (2019.1)
- The JDBC connector was improved for better performance (2019.2)
- You can connect to on-premise Service Now deployments (2019.2)
- You can use Azure Active Directory username and password authentication (2019.2)
- Enhanced SAP Hana and Marketo connectors (2019.2)
Mapping is the star of the newest Tableau version. We'll cover the new MakePoint and MakeLine functions, as well as the new vector map. These two new features will allow you to enjoy building maps even more than before.
Since Tableau 10.2, you have been able to connect to a spatial file to create maps using the Geometry field (a Point, a Line, or a Polygon). Each new release brought new capabilities, such as using a spatial field directly from a database or the recent spatial join: Intersect. Tableau Desktop 2019.2 brings two new functionalities: MakePoint and MakeLine.
MakePoint and MakeLine are two new functions. MakePoint converts Latitude and Longitude into a spatial point. MakeLine takes two Points and creates a spatial Line. This allows you to create a path between two places on Earth by taking into account the curvature of the earth and joining spatial and nonspatial files with Latitude and Longitude.
Let's visualize the top 100 busiest air routes.
This file contains one hundred lines and provides information on the departure and arrival to airports, as well as the number of passengers.
Let's start:
- Open Tableau Desktop and select Microsoft Excel.
- Connect to the
Flights.xlsxfile you've just downloaded. - On Sheet1, create a new calculated field. Name it
Departure Pointand write the following formula:MAKEPOINT([Departure Latitude],[Departure Longitude]). - Create a second calculated field for the arrivals. Name it
Arrival Pointand write the following formula:MAKEPOINT([Arrival Latitude],[Arrival Longitude]). - You have created two calculated fields that contain spatial points that are mapping the departure and arrival airports. You can test your fields by simply double-clicking on them.
- Create a final calculated field for the routes. Name it
Air Routesand write the following formula:MAKELINE([Departure Point],[Arrival Point]). - On a blank Worksheet, double-click on Air Routes; this will automatically generate all the paths on a map.
- To finalize the visualization, add the Route Dimension in Detail to separate each path, and add the Passengers Measure in Size and Color to visually spot the busiest routes. The following screenshot shows the final results:

If, like me, you aren't new to Tableau, you will be impressed by how fast and easy it is to achieve this now. That's what we love about each new Tableau release: it always makes our analysis faster and easier to do.
As I said, mapping is the star, so let's continue with this new mapping style.
Are you ready for a smoother, faster, and more powerful than ever mapping experience? Yes, you are! Using maps in Tableau Desktop 2019.2 never felt better. Using the MapBox technology, Tableau maps now use vectors for an incredibly smooth zoom in and out.
Go ahead – open your favorite visualization that includes a map and try it yourself!

Oh! And is if this wasn't enough, there are also new data layers that you can add: Terrain, Routes, Water Labels, Cities, Point of Interest, Neighborhoods, Building Footprints, and so on. Each style has newer and richer layers. Mapping has never been so good.
The following is a list of other small visualization improvements:
- Sort Controls: On the Worksheet top menu, you'll find a new option, Show Sort Controls, which allows you to choose whether users can change the sort order. (2019.2)
- Nested sort: You can now use the nested sort feature on multiple dimensions (2019.1)
- Tooltip reference line: On the reference line configuration window, you can now modify and even totally remove the tooltip (2019.2)
Now, we'll look at the new features available for Dashboards.
Tableau's power resides in the ability to build simple and powerful visualizations and dashboards in minutes, but also to create interactivity with only a few clicks thanks to Actions. Tableau 2018.3 already introduced two new actions: Go To Sheet and Change Set Values. Tableau 2019.1 and 2019.2 continue to improve on these actions with a great enhancement for Go to URL actions and a revolutionary way of working with parameters: Change Parameter.
The Go to URL... action allows you to open a website directly inside the Dashboard or in a new window. With effect from version 2019.2, you have the ability to choose how to open the URL target in the configuration window:
- New Browser tab: Always opens the link in a new browser tab, even if a Web Page object exists in the Dashboard.
- Web Page object: Opens the URL in a Web Page object in your Dashboard. You can even have multiple Web Page objects in your Dashboard with multiple URL actions targeting each Web Page object separately.
- Browser tab if no Web Page objects exists: The default option; this opens the URL in a browser tab if there is no Web Page object.
The Change Parameter... is the newest action to be introduced in Tableau 2019.2. It allows you to change the value of a Parameter based on the value on a Worksheet. It was already possible to achieve this thanks to Extensions, but now Tableau has made it official!
- On a blank Worksheet, create a new Parameter.
- On the Parameter configuration window, name it
Salescomparison value, of the Float type with All allowable values, and then click on OK. Your Parameter configuration should look like this:
- Create a new calculated field, name it
Sales comparison, and write the following formula:SUM([Sales])-[Sales comparison value]. - Double-click on State, then put Sales in Detail and

- Open the Worksheet top menu and click on Actions….
- Click on the Add Action button and choose Change Parameter….
- Name the action
Set sales comparison valueand set it to run on Hover. In the Target Parameter list, choose Sales comparison value, and in the Value list, choose SUM(Sales). Keep the Aggregation as Sum. Your configuration window should look as follows:
- Back in your visualization, hovering over a state should change the value of the parameter and therefore allow you to quickly compare the sales of a state to the others. The following is the final result when you hover over Washington:

This new action will unlock many new opportunities so that you can create awesome interactions for your users. I can't wait to see what the Tableau Community will create!
Building Dashboards is definitely one of the most important aspects of using Tableau Desktop. Fortunately, building a simple Dashboard is also something very easy and enjoyable to do. In the process of always making our life easier, Tableau has developed a few very nice new features.
If you are not new to Tableau, I'm sure you've already made (or had to make) a Dashboard with lots of filters and legends. You know, something that looks like this:

Adding a toggle button is quite easy: select the containers (with the Select Container option when you click on an item, or use the Item hierarchy in the Layout pane), then select Add toggle button from the container options. A default toggle button is automatically added to your Dashboard. Among the button options, you'll find the ability to Show or Hide the container and edit it with the Edit Button… option.
Unzip the ToggleButtonStart.zip file and you'll find a Tableau Packaged Workbook that is the start of the example:
- Open the
ToggleButtonStart.twbxworkbook. - Select the filters and legend container, either by double-clicking on the grip part or using the Select Containers option of the items, or by using the Item hierarchy in the Layout pane. You should see the entire horizontal container with a blue outline, like this:

- Go to the option using the descending arrow and select Floating.
- Using the grip part, move the containers at the top left. Then, by selecting the left border, increase its width, as shown in the following screenshot:

- Click on the arrow to option the container options and select Add Show/Hide button.
- You can now use this button to show and hide the container with the filters and legends. To finalize the Dashboard, you can move the button next to the title, increase its size, and add a tooltip among the button options. Here's the final result:

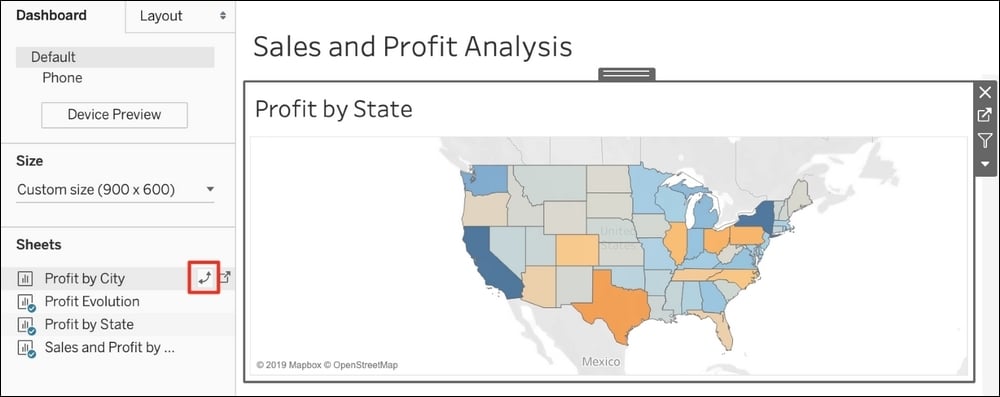
This is the kind of feature we love: simple and efficient. With Tableau 2019.2, you can now replace any Worksheet in a Dashboard with another new Worksheet. This may not sound like a big deal to newcomers, but Tableau veterans know how useful this new feature is.
- Export to PowerPoint: On Tableau Desktop, among the File top menu, you'll find the Export As PowerPoint option. On Tableau Server, you'll find the PowerPoint option when you click on the Download button in the toolbar. In Tableau 2019.2, this feature was improved to export Stories, with each Story point being a new slide (2019.1).
- Name zone: In the Item hierarchy part of the Layout pane of a Dashboard, you can now give a meaningful name to each item. This is a great feature to combine with the Show/Hide button. Here's an example (2019.1):

- Auto phone layout: Any Dashboard built with Tableau Desktop 2019.1 or later automatically starts with an automatically generated phone layout. Don't forget to remove it if you don't want it (2019.1).
That's it for Tableau Desktop. In the next section, we'll see what's new in Tableau Server.
Ask Data is without a doubt one of the most important new features of the 2019 releases. However, the change that everyone will directly spot is the totally new browsing experience, with a new way to group published content and a fresh look.
Tableau Server 2019.1 introduced Mixed Content. This new way of grouping content mixes data sources, Workbooks, flows, and sub-projects in the same view of a project. Say goodbye to different tabs for each content type. Now, you can see everything at the same time. For example, here's the view of a project, World Indicators, that contains a sub-project, Workbooks, and a data source:

Tableau Server 2019.2 pushes this change further with a totally new look and feel when navigating on Tableau Server. The new Home page displays your recently used content, your favorites, and what other Tableau users are viewing. The top menu has also totally disappeared to leave room for a new left navigation pane. Don't be afraid – the options are still the same. Here's the new Home page:

Ask Data is the first view that opens when you click on a data source. It's a new tool to query any data sources using the English language. With this new feature, Tableau Server becomes more and more easy to use for everyone. But how does it work, exactly?


Without any knowledge of how to use Tableau to create a visualization, Ask Data was able to convert some text into a visualization.

Of course, Ask Data doesn't have the flexibility of Tableau Desktop, and you don't have much control over what the result will be. However, it can easily supply a feature users have long demanded: Can you just build a big table where I can search what I want?. With Ask Data, you don't need that anymore.
Next, we'll look at a nice evolution for the alerts.
Alerts is an amazing feature that you can use to receive emails when your data satisfies a condition. With Tableau Server 2019.2, clicking on the Alerts button in the toolbar doesn't open the alert creation window anymore; instead, it opens a new pane on the right. Here's the Alerts view:

With effect from Tableau 2019.1, every Dashboard has a phone layout by default. Its new features will help you preview it.
With effect from Tableau 2019.1, you can preview the layouts on Tableau Server. Above the toolbar, a new button, Preview Device Layouts, is now available, as highlighted in the following screenshot:

Here is a list of other new features available on Tableau Server:
- New connections: You can connect to Google Big Query, Google Drive, Dropbox, and OneDrive from the web (2019.1)
- Okta improvement: Tableau Server can integrate Okta identity management for users, groups, and roles even better (2019.1)
- Site Start page: Tableau Server admins can set a start page for all users (2019.2)
- Create Parameters: You can create Parameters in web editor mode (2019.2)
- Custom view for Viewer: A Viewer role user can now create custom views (2019.2)
- Secure Rserve and TabPy connections: You can host Rserve (2019.1) and TabPy (2019.2) servers remotely from Tableau Server and secure data in transit