


Enterprise data has never been of such prominence as in the recent past. One of the dominant challenges of today's major data influx in enterprises is establishing a future-proof strategy focused on deriving meaningful insights tangibly contributing to business growth.
This chapter introduces readers to the core aspects of Big Data, standard analytical techniques, and data science as a practice in business context. In the chapters that follow, these topics are further elaborated with a step-by-step implementation guide to use Greenplum's Unified Analytics Platform (UAP).
The topics covered in this chapter are listed as follows:
Enterprise data and its characteristics
Context of Big Data—a definition and the paradigm shift
Data formats such as structured, semi-structured, and unstructured data
Data analysis, need, and overview of important analytical techniques (statistical, predictive, mining, and so on)
The philosophy of data science and its standard life cycle
Before we take a deep dive into Big Data and analytics, let us understand the important characteristics of enterprise data as a prerequisite.
Enterprise data signifies data in a perspective that is holistic to an enterprise. We are talking about data that is centralized/integrated/federated, using diverse storage strategy, from diverse sources (that are internal and/or external to the enterprise), condensed and cleansed for quality, secure, and definitely scalable.
In short, enterprise data is the data that is seamlessly shared or available for exploration where relevant information is used appropriately to gain competitive advantage for an enterprise.
Data formats and access patterns are diverse which additionally drives some of the need for various platforms. Any new strategic enterprise application development should not assume the persistence requirements to be relational. For example, data that is transactional in nature could be stored in a relational store and twitter feed could be stored in NoSQL structure.
This would mean bringing in complexity that introduces learning new interfaces but a benefit worth the performance gain.
It requires that an enterprise has the important data engineering aspects in place to handle enterprise data effectively. The following list covers a few critical data engineering aspects:
Data architecture and design
Database administration
Data governance (that includes data life cycle management, compliance, and security)
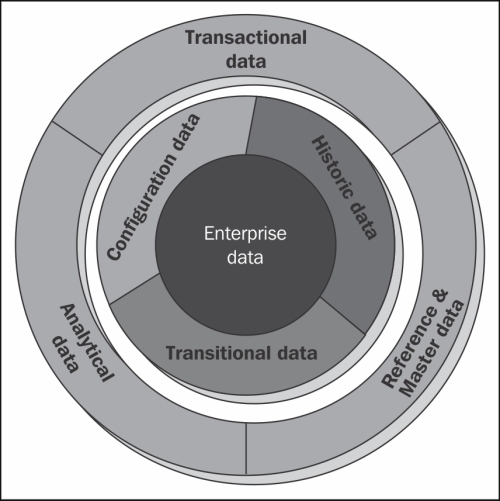
Enterprise data can be classified into the following categories:
Transactional data: It is the data generated to handle day-to-day affairs within an enterprise and reveals a snapshot of ongoing business processing. It is used to control and run fundamental business tasks. This category of data usually refers to a subset of data that is more recent and relevant. This data requires a strong backup strategy and data loss is likely to entail significant monetary impact and legal issues. Transactional data is owned by Enterprise Transactional systems that are the actual source for the data as well. This data is characterized by dynamicity. For example, order entry, new account creation, payments, and so on.
Master and Reference data: Though we see Master data and Reference data categorized under the same bucket, they are different in their own sense. Reference data is all about the data that is usually outside the enterprise and is Standards compliant and usually static in nature. On the other hand, Master data is similar in definition with the only difference that it originates from within the enterprise. Both Master and Reference data are referenced by Transactional data and key to the operation of business. This data is often non-transactional/static in nature and can be stored centralized or duplicated. For example:
Reference data: country codes, PIN, branch codes, and so on
Master data: accounts, portfolio managers, departments, and so on
Analytical data: Business data is analyzed and insights derived are presented for decision making; data classified under this category usually is not owned by the analyzing application. Transaction data from various transaction processing systems is fed for analysis. This data is sliced and diced at various levels to help problem solving, planning, and decision-support as it gives multi-dimensional views of various business activities. It is usually larger in volume and historic in nature when compared to transactional data.
In addition to the preceding categories, there are a few other important data classifications. These classifications define the character data:
Configuration data: This classification refers to the data that describes data or defines the way data needs to be used. There can be many categories of configuration data. For example, an application has many clients, and each client needs to refer to a unique set of messaging configurations (let's say a unique queue name) or information regarding how to format a report that needs to be displayed for a particular user, and so on. This classification is also referred to as metadata.
Historic data: It refers to any data that is historic in nature. Typically gives reference to facts at a given point in time. This data requires a robust archival strategy as it is expected to be voluminous. At the same time, it would not undergo any changes and is usually used as a reference for comparison. Corrections/changes to historic data can happen only in the case of errors. Examples can be, security price at a point in time, say January 20, 1996, financial transactions of an account in the first quarter of the year, and so on.
Transitional data: This is one of the most important data classifications that refer to data that is intermediary and temporary in nature. This data is usually generated to improve the data processing speed and could be kept in memory that is evicted post its use. This data might not be available for direct consumption. Example for this data classification can be an intermediary computation data that is stored and is to be used in a bigger scheme of data processing, like market value for each security to compute, and rate of return on the overall value invested.
In this section, we will understand the characteristic features of enterprise data. Each of the listed characteristics describes a unique facet/behavior that would be elaborated in the implementation perspective later in the Data Science life cycle section in this chapter. Following are a few important characteristics of enterprise data:
Included: Enterprise data is integrated and usually, but not mandatorily, centralized to all applications within an enterprise. Data from various sources and varied formats is either aggregated or federated for this purpose. (Aggregation refers to physically combining data sets into a single structure and location while federation is all about getting a centralized way to access a variety of data sources to get the required data without physically combining/merging the data.)
Standards compliance: Data is represented/presented to the application in context in a format that is either a standard to an enterprise/across enterprises.
Secure: Data is securely accessible through authorization.
Scalable: In a context where data is integrated from various sources, the need to support larger volumes becomes critical, and thus the scalability, both in terms of storage and processing.
Condensed/Cleansed/Consistent: Enterprise data can possibly be condensed and cleansed to ensure data quality against a given set of data standards for an enterprise.
Varied sources and formats: Data is mostly combined from varied sources and can continue to be stored in varied formats for optimized usage.
Available: Enterprise data is always consistent with minimal data disparity and available to all applications using it.
One of the important aspects of enterprise data that we learned in the earlier section is the data consolidation and sharing that requires unconstrained collection and access to more data. Every time change is encountered in business, it is captured and recorded as data. This data is usually in a raw form and unless processed cannot be of any value to the business. Innovative analysis tools and software are now available that helps convert this data into valuable information. Many cheap storage options are now available and enterprises are encouraged to store more data and for a long time.
In this section, we will define the core aspects of Big Data, the paradigm shift and attempt to define Big Data.
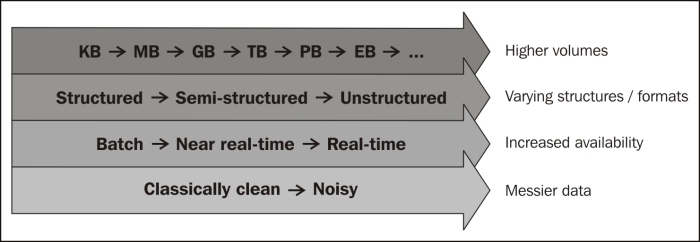
A scale of terabytes, petabytes, exabytes, and higher is what the market refers to in terms of volumes. Traditional database engines cannot scale to handle these volumes. The following figure lists the orders of magnitude that represents data volumes:

Data formats generated and consumed may not be structured (for example, relational data that can be normalized). This data is generated by large/small scientific instruments, social networking sites, and so on. This can be streaming data that is heterogeneous in nature and can be noisy (for example, videos, mails, tweets, and so on). These formats are not supported by any of the traditional datamarts, data store/data mining applications today.
Traditionally, business/enterprise data used to be consumed in batches, in specific windows and subject to processing. With the recent innovation in advanced devices and the invasion of interconnect, data is now available in real time and the need for processing insights in real time has become a prime expectation.
With all the above comes a need for processing efficiency. The processing windows are getting shorter than ever. A simple parallel processing framework like MapReduce has attempted to address this need.
With all that we tried understanding previously; let's now define Big Data.
Big Data can be defined as an environment comprising of tools, processes, and procedures that fosters discovery with data at its center. This discovery process refers to our ability to derive business value from data and includes collecting, manipulating, analyzing, and managing data.
We are talking about four discrete properties of data that require special tools, processes, and procedures to handle:
Increased volumes (to the degree of petabytes, and so on)
Increased availability/accessibility of data (more real time)
Increased formats (different types of data)
Increased messiness (noisy)
There is a paradigm shift seen as we now have technology to bring this all together and analyze it.
In this section, we will discuss various data formats in the context of Big Data. Data is categorized into three main data formats/types:
Structured: Typically, data stored in a relational database can be categorized as structured data. Data that is represented in a strict format is called structured data. Structured data is organized in semantic chunks called entities. These entities are grouped and relations can be defined. Each entity has fixed features called attributes. These attributes have a fixed data type, pre-defined length, constraints, default value definitions, and so on. One important characteristic of structured data is that all entities of the same group have the same attributes, format, length, and follow the same order. Relational database management systems can hold this kind of data.
Semi-structured: For some applications, data is collected in an ad-hoc manner and how this data would be stored or processed is unknown at that stage. Though the data has a structure, it sometimes doesn't comply with a structure that the application is expecting it to be in. Here, different entities can have different structures with no pre-defined structure. This kind of data is defined to be semi-structured. For example, scientific data, bibliographic data, and so on. Graph data structures can hold this kind of data. Some characteristics of semi-structured data are listed as follows:
Organized in semantic entities
Similar entities are grouped together
Entities in the same group may not have the same attributes
Order of attributes isn't important
There might be optional attributes
Same attributes might have varying sizes
Same attributes might be of varying type
Unstructured: Unstructured data refers to the data that has no standard structure and it could mean structure in its isolation. For example, videos, images, documents emails, and so on. File-based storage systems support storing this kind of data. Some key characteristics of unstructured data is listed as follows:
Data can be of any type
Does not have any constraints or follow any rules
It is very unpredictable
Has no specific format or sequence
Data is often a mix of structured, semi-structured, and unstructured data. Unstructured data usually works behind the scenes and eventually converts to structured data.
Here are a few points for us to ponder:
Data can be manifested in a structured way (for example, storing in a relational format would mean structure), and there are structured ways of expressing unstructured data, for example, text.
Applications that process data need to understand the structure of data.
The data that an application produces is usually in a structure that it alone can most efficiently use, and here comes a need for transformation. These transformations are usually complex and the risk of losing data as a part of this process is high.
In the next section that introduces data analytics, we will apply the multi-structured data requirements and take a deep dive on how data of various formats can be processed.
What does it need for a platform to support multi-structured data in a unified way? How native support for each varying structures can be provided, again in a unified way, abstracting end user from the complexity while running analytical processing over the data? The chapters that follow explain how Greenplum UAP can be used to integrate and process data.
To stay ahead of the times and take informed decisions, businesses now require running analytics on data that is moved in on a real-time basis and this data is usually multi-structured, characterized in the previous section. Value is in identifying patterns to make intelligent decisions and in influencing decisions if we could see the behavior patterns.
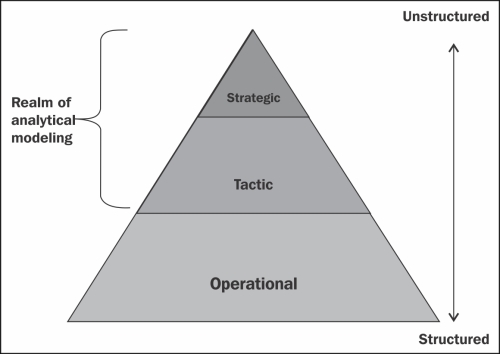
Classically, there are three major levels of management and decision making within an organization: operational, tactical, and strategic. While these levels feed one another, they are essentially distinct:
Operational data: It deals with day-to- day operations. At this level decisions are structured and are usually driven by rules.
Tactical data: It deals with medium-term decisions and is semi-structured. For example, did we meet our branch quota for new loans this week?
Strategic data: It deals with long-term decisions and is more unstructured. For example, should a bank lower its minimum balances to retain more customers and acquire more new customers?
Decision making changes as one goes from level to level.
With increasing need for supporting various aspects of Big Data, as stated previously, existing data warehousing and business intelligence tools are going through transformation.
Big Data is not, of course, just about the rise in the amount of data we have, it is also about the ability we now have to analyze these data sets. It is the development with tools and technologies, including such things as Distributed Files Systems (DFS), which deliver this ability.
High performance continues to be a critical success indicator for user implementations in Data Warehousing (DW), Business Intelligence (BI), Data Integration (DI), and analytics. Advanced analytics includes techniques such as predictive analytics, data mining, statistics, and Natural Language Processing (NLP).
A few important drivers for analytics are listed as follows:
Need to optimize business operations/processes
Proactively identify business risks
Predict new business opportunities
Compliance to regulations
Big Data analytics is all about application of these advanced analytic techniques to very large, diverse data sets that are often multi-structured in nature. Traditional data warehousing tools do not support the unstructured data sources and the expectations on the processing speeds for Big Data analytics. As a result, a new class of Big Data technology has emerged and is being used in many Big Data analytics environments. There are both open source and commercial offerings in the market for this requirement.
The focus of this book will be Greenplum UAP that includes database (for structured data requirements), HD/Hadoop (for unstructured data requirements), and Chorus (a collaboration platform that can integrate with partner BI, analytics, and visualization tools gluing the communication between the required stakeholders).
The following diagram depicts the evolution of analytics, very clearly, with the increase in data volumes; a linear increase in sophistication of insights is sought.
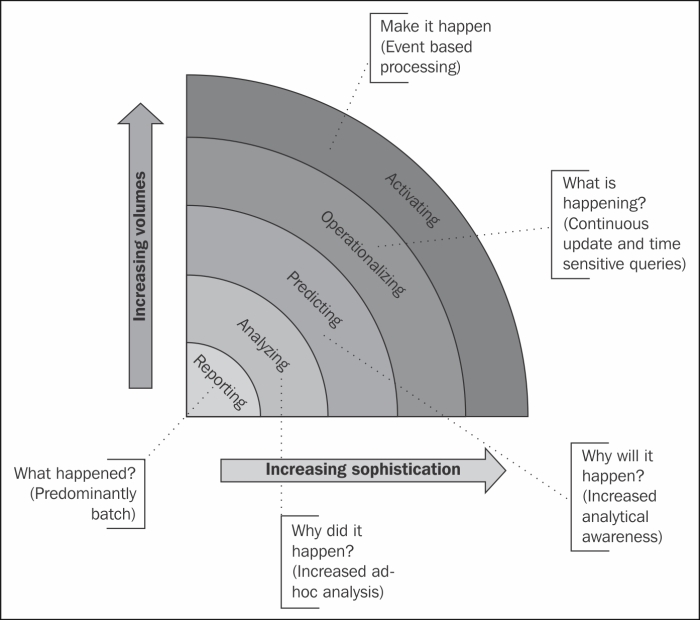
Initially, it was always Reporting. Data was pre-processed and loaded in batches, and an understanding of "what happened?" was gathered.
Focus slowly shifted on to understanding "why did it happen?". This is with the advent of increased ad-hoc data inclusion.
At the next level, the focus has shifted to identifying "why will it happen?", a focus more on prediction instead of pure analysis.
With more ad-hoc data availability, the focus is shifted onto "what is happening?" part of the business.
Final focus is on "make it happen!" with the advent of real-time event access.
With this paradigm shift, the expectations from a new or modern data warehousing system have changed and the following table lists the expected features:
|
Challenges |
Traditional analytics approach |
New analytics approach |
|---|---|---|
|
Scalability |
N |
Y |
|
Ingest high volumes of data |
N |
Y |
|
Data sampling |
Y |
N |
|
Data variety support |
N |
Y |
|
Parallel data and query processing |
N |
Y |
|
Quicker access to information |
N |
Y |
|
Faster data analysis (higher GB/sec rate) |
N |
Y |
|
Accuracy in analytical models |
N |
Y |
A few of the analytical techniques we will be further understanding in the following chapters are:
Descriptive analytics: Descriptive analytics provides detail on what has happened, how many, how often, and where. In this technique, new insights are developed using probability analysis, trending, and development of association over data that is classified and categorized.
Predictive analytics: Predictive modeling is used to understand causes and relationships in data in order to predict valuable insights. It provides information on what will happen, what could happen, and what actions can be taken. Patterns are identified in the data using mathematical, statistical, or visualization techniques. These patterns are applied on the new data sets to predict the behavior.
Prescriptive analytics: Prescriptive analytics helps derive a best possible outcome by analyzing the possible outcomes. It includes Descriptive and Predictive analytic techniques to be applied together. Probabilistic and Stochastic methods such as Monte Carlo simulations and Bayesian models to help analyze best course of action based on "what-if" analysis.
Data analytics discussed in the previous section forms an important step in a data science project. In this section, we will explore the philosophy of data science and the standard life cycle of a data science project.
Data science is all about turning data into products. It is analytics and machine learning put into action to draw inferences and insights out of data. Data science is perceived to be an advanced step to business intelligence that considers all aspects of Big Data.
The following diagrams shows the various stages of data science life cycle that includes steps from data availability/loading to deriving and communicating data insights until operationalizing the process.

This phase is all about discovering the current problem in hand. The problem statement is analyzed and documented in this phase.
In this phase, we identify the key stakeholders and their interests, key pain points, goals for the project and failure criteria, success criteria, and key risks involved.
Initial hypotheses needs to be formed with the help of domain experts/key stakeholders; this would be the basis against which we would validate the available data. There would be variations of hypotheses that we would need to come up with as an initial step.
There would be a need to do a basic validation for the formed hypotheses and for this we would need to do a preliminary data exploration. We will deal with data exploration and process in the later chapters at length.
This phase forms one of the crucial initial steps where we analyze various sources of data, strategy to aggregate/integrate data and scope the kind of data required.
As a part of this initial step, we identify the kind of data we require to solve the problem in context. We would need to consider lifespan of data, volumes, and type of the data. Usually, there would be a need to have access to the raw data, so we would need access to the base data as against the processed/aggregated data. One of the important aspects of this phase is confirming the fact that the data required for this phase is available. A detailed analysis would need to be done to identify how much historic data would need to be extracted for running the tests against the defined initial hypothesis. We would need to consider all the characteristics of Big Data like volumes, varied data formats, data quality, and data influx speed. At the end of this phase, the final data scope would be formed by seeking required validations from domain experts.
The previous two phases define the analytic project scope that covers both business and data requirements. Now it's time for data exploration or transformation. It is also referred to as data preparation and of all the phases, this phase is the most iterative and time-consuming one.
During data exploration, it is important to keep in mind that there should be no interference with the ongoing organizational processes.
We start with gathering all kinds of data identified in phase 2 to solve the problem defined in phase 1.This data can be either structured, semi-structured, or unstructured, usually held in the raw formats as this allows trying various modeling techniques and derive an optimal one.
While loading this data, we can use various techniques like ETL (Extract, Transform, and Load), ELT (Extract, Load, and Transform), or ETLT (Extract, Load, Transform, and Load).
Extract, Transform, and Load: It is all about transforming data against a set of business rules before loading it into a data sandbox for analysis.
Extract, Load, and Transform: In this case, the raw data is loaded into a data sandbox and then transformed as a part of analysis. This option is more relevant and recommended over ETL as a prior data transformation would mean cleaning data upfront and can result in data condensation and loss.
Extract, Transform, Load, and Transform: In this case, we would see two levels of transformations:
Level 1 transformation could include steps that involve reduction of data noise (irrelevant data)
Level 2 transformation is similar to what we understood in ELT
In both ELT and ETLT cases, we can gain the advantage of preserving the raw data. One basic assumption for this process is that data would be voluminous and the requirement for tools and processes would be defined on this assumption.
The idea is to have access to clean data in the database to analyze data in its original form to explore the nuances in data. This phase requires domain experts and database specialists. Tools like Hadoop can be leveraged. We will learn more on the exploration/transformation techniques in the coming chapters.
This phase has two important steps and can be highly iterative. The steps are:
Model design
Model execution
In the model designing step, we would identify the appropriate/suitable model given a deep understanding of the requirement and data. This step involves understanding the attributes of data and the relationships. We will consider the inputs/data and then examine if these inputs correlate to the outcome we are trying to predict or analyze. As we aim to capture the most relevant variables/predictors, we would need to be vigilant for any data modeling or correlation problems. We can choose to analyze data using any of the many analytical techniques such as logistic regression, decision trees, neural networks, rule evolvers, and so on.
The next part of model design is the identification of the appropriate modeling technique. The focus will be on what data we would be running in our models, structured, unstructured, or hybrid.
As a part of building the environment for modeling, we would define data sets for testing, training, and production. We would also define the best hardware/software to run the tests such as parallel processing capabilities, and so on.
Important tools that can help building the models are R, PL/R, Weka, Revolution R (a commercial option), MADlib, Alpine Miner, or SAS Enterprise Miner.
The second step of executing the model considers running the identified model against the data sets to verify the relevance of the model as well as the outcome. Based on the outcome, we would need further investigation on additional data requirements and alternative approaches to solving the problem in context.
Now comes the important part of the life cycle, communicating/publishing the key results/findings against the hypothesis defined in phase 1. We would consider presenting the caveats, assumptions, and limitations of the results. The results are summarized to be interpreted for a relevant target audience.
This phase requires identification of the right visualization techniques to best communicate the results. These results are then validated by the domain experts in the following phase.
Measuring the effectiveness is all about validating if the project succeeded or failed. We need to quantify the business value based on the results from model execution and the visualizations.
An important outcome of this phase is the recommendations for future work.
In addition, this is the phase where you can underscore the business benefits of the work, and begin making the case to eventually put the logic into a live production environment.
As a result of this phase, we would have documented the key findings and major insights as a result of the analysis. The artifact as a result of this phase will be the most visible portion of the process to the outside stakeholders and sponsors, and hence should clearly articulate the results, methodology, and business value of the findings.
Finally, engaging this whole process by implementing it on production data completes the life cycle. The following steps include the engagement process:
Execute a pilot of the previous formulation.
Run assessment of the outcome for benefits.
Publish the artifacts/insights.
Execute the model on production data.
Define/apply a sustenance model.
Data analytics life cycle blog by Steve Todd: http://www.innovationexcellence.com/blog/tag/data-analytics-lifecycle/
3D Data Management: Controlling Data Volume, Velocity and Variety,Doug Laney, Gartner
Scaling Facebook to 500 Million Users and Beyond by Robert Johnson: http://www.facebook.com/note.php?note_id=409881258919
In this chapter, we covered details on understanding enterprise data, its features and categories. We then moved on to define Big Data with the core data definition from enterprise data. We also looked at the paradigm shift that Big Data has brought in and how the market is gearing up to use the technology advancements to handle the Big Data challenges. We also saw how traditional approaches no longer fit the Big Data context and new tools and techniques are being adopted. We also familiarized you with data analytics techniques, their purpose, and a typical data science life cycle.
In the next chapter, we will learn about Greenplum UAP. We will take a deep dive into the differentiating architectural patterns that make it suitable for advanced and Big Data analytics. In terms of hardware as well as software, we would be drilling into each of the modules and their relevance in the current context on analytics in discussion.