In this section, we will discuss the different sampling methods used in research. Broadly speaking, in the real world, it is not easy or possible to get the whole population data for many reasons. For instance, the costs of gathering data are expensive in terms of money and time. Collecting all the data is impractical in many cases and ethical issues are also considered. Taking samples from the population can help us overcome these problems and is a more efficient way to collect data. By collecting an appropriate sample for a study, we can draw statistical conclusions or statistical inferences about the population properties. Inferential statistical analysis is a fundamental aspect of statistical thinking. Different sampling methods from probability strategies to non-probability strategies used in research and industry will be discussed in this section.
There are essentially two types of sampling methods:
- Probability sampling
- Non-probability sampling
Probability sampling
In probability sampling, a sample is chosen from a population based on the theory of probability, or it is chosen randomly using random selection. In random selection, the chance of each member in a population being selected is equal. For example, consider a game with 10 similar pieces of paper. We write numbers 1 through 10, with a separate piece of paper for each number. The numbers are then shuffled in a box. The game requires picking three of these ten pieces of paper randomly. Because the pieces of paper have been prepared using the same process, the chance of any piece of paper being selected (or the numbers one through ten) is equal for each piece. Collectively, the 10 pieces of paper are considered a population and the 3 selected pieces of paper constitute a random sample. This example is one approach to the probability sampling methods we will discuss in this chapter.
Figure 1.4 – A random sampling example
We can implement the sampling method described before (and shown in Figure 1.4) with numpy. We will use the choice method to select three samples from the given population. Notice that replace==False is used in the choice. This means that once a sample is chosen, it will not be considered again. Note that the random generator is used in the following code for reproducibility:
import numpy as np
# setup generator for reproducibility
random_generator = np.random.default_rng(2020)
population = np.arange(1, 10 + 1)
sample = random_generator.choice(
    population,    #sample from population
    size=3,        #number of samples to take
    replace=False  #only allow to sample individuals once
)
print(sample)
# array([1, 8, 5])
The purpose of random selection is to avoid a biased result when some units of a population have a lower or higher probability of being chosen in a sample than others. Nowadays, a random selection process can be done by using computer randomization programs.
Four main types of the probability sampling methods that will be discussed here are as follows:
- Simple random sampling
- Systematic sampling
- Stratified sampling
- Cluster sampling
Let’s look at each one of them.
Simple random sampling
First, simple random sampling is a method to select a sample randomly from a population. Every member of the subset (or the sample) has an equal chance of being chosen through an unbiased selection method. This method is used when all members of a population have similar properties related to important variables (important features) and it is the most direct approach to probability sampling. The advantages of this method are to minimize bias and maximize representativeness. However, while this method helps limit a biased approach, there is a risk of errors with simple random sampling. This method also has some limitations. For instance, when the population is very large, there can be high costs and a lot of time required. Sampling errors need to be considered when a sample is not representative of the population and the study needs to perform this sampling process again. In addition, not every member of a population is willing to participate in the study voluntarily, which makes it a big challenge to obtain good information representative of a large population. The previous example of choosing 3 pieces of paper from 10 pieces of paper is a simple random sample.
Systematic sampling
Here, members of a population are selected at a random starting point with a fixed sampling interval. We first choose a fixed sampling interval by dividing the number of members in a population by the number of members in a sample that the study conducts. Then, a random starting point between the number one and the number of members in the sampling interval is selected. Finally, we choose subsequent members by repeating this sampling process until enough samples have been collected. This method is faster and preferable than simple random sampling when cost and time are the main factors to be considered in the study. On the other hand, while in simple random sampling, each member of a population has an equal chance of being selected, in systematic sampling, a sampling interval rule is used to choose a member from a population in a sample for a study. It can be said that systematic sampling is less random than simple random sampling. Similarly, as in simple random sampling, member properties of a population are similarly related to important variables/features. Let us discuss how we perform systematic sampling through the following example. In a class at one high school in Dallas, there are 50 students but only 10 books to give to these students. The sampling interval is fixed by dividing the number of students in the class by the number of books (50/10 = 5). We also need to generate a random number between one and 50 as a random starting point. For example, take the number 18. Hence, the 10 students selected to get the books will be as follows:
18, 23, 28, 33, 38, 43, 48, 3, 8, 13
The natural question arises as to whether the interval sampling is a fraction. For example, if we have 13 books, then the sampling interval will be 50/13 ~ 3.846. However, we cannot choose this fractional number as a sampling interval that represents the number of students. In this situation, we could choose number 3 or 4, alternatively, as the sampling intervals (we could also choose either 3 or 4 as the sampling interval). Let us assume that a random starting point generated is 17. Then, the 13 selected students are these:
17, 20, 24, 27, 31, 34, 38, 41, 45, 48, 2, 5, 9
Observing the preceding series of numbers, after reaching the number 48, since adding 4 will produce a number greater than the count of students (50 students), the sequence restarts at 2 (48 + 4 = 52, but since 50 is the maximum, we restart at 2). Therefore, the last three numbers in the sequence are 2, 5, and 9, with the sampling intervals 4, 3, and 4, respectively (passing the number 50 and back to the number 1 until we have 13 selected students for the systematic sample).
With systematic sampling, there is a biased risk when the list of members of a population is organized to match the sampling interval. For example, going back to the case of 50 students, researchers want to know how students feel about mathematics classes. However, if the best students in math correspond to numbers 2, 12, 22, 32, and 42, then the survey could be biased if conducted when the random starting point is 2 and the sampling interval is 10.
Stratified sampling
It is a probability sampling method based on dividing a population into homogeneous subpopulations called strata. Each stratum splits based on distinctly different properties, such as gender, age, color, and so on. These subpopulations must be distinct so that every member in each stratum has an equal chance of being selected by using simple random sampling. Figure 1.5 illustrates how stratified sampling is performed to select samples from two subpopulations (a set of numbers and a set of letters):
Figure 1.5 – A stratified sample example
The following code sample shows how to implement stratified sampling with numpy using the example shown in Figure 1.5. First, the instances are split into the respective strata: numbers and letters. Then, we use numpy to take random samples from each stratum. Like in the previous code example, we utilize the choice method to take the random sample, but the sample size for each stratum is based on the total number of instances in each stratum rather than the total number of instances in the entire population; for example, sampling 50% of the numbers and 50% of the letters:
import numpy as np
# setup generator for reproducibility
random_generator = np.random.default_rng(2020)
population = [
  1, "A", 3, 4,
  5, 2, "D", 8,
  "C", 7, 6, "B"
]
# group strata
strata = {
    'number' : [],
    'string' : [],
}
for item in population:
    if isinstance(item, int):
        strata['number'].append(item)
    else:
        strata['string'].append(item)
# fraction of population to sample
sample_fraction = 0.5
# random sample from stata
sampled_strata = {}
for group in strata:
    sample_size = int(
        sample_fraction * len(strata[group])
    )
    sampled_strata[group] = random_generator.choice(
            strata[group],
            size=sample_size,
            replace=False
    )
print(sampled_strata)
#{'number': array([2, 8, 5, 1]), 'string': array(['D', 'C'], dtype='<U1')}
The main advantage of this method is that key population characteristics in a sample better represent the population that is studied and are also proportional to the overall population. This method helps to reduce sample selection bias. On the other hand, when classifying each member of a population into distinct subpopulations is not obvious, this method becomes unusable.
Cluster sampling
Here, a population is divided into different subgroups called clusters. Each cluster has homogeneous characteristics. Instead of randomly selecting individual members in each cluster, entire clusters are randomly chosen and each of these clusters has an equal chance of being selected as part of a sample. If clusters are large, then we can conduct a multistage sampling by using one of the previous sampling methods to select individual members within each cluster. A cluster sampling example is discussed now. A local pizzeria plans to expand its business in the neighborhood. The owner wants to know how many people order pizzas from his pizzeria and what the preferred pizzas are. He then splits the neighborhood into different areas and selects clients randomly to form cluster samples. A survey is sent to the selected clients for his business study. Another example is related to multistage cluster sampling. A retail chain store conducts a study to see the performance of each store in the chain. The stores are divided into subgroups based on location, then samples are randomly selected to form clusters, and the sample cluster is used as a performance study of his stores. This method is easy and convenient. However, the sample clusters are not guaranteed to be representative of the whole population.
Non-probability sampling
The other type of sampling method is non-probability sampling, where some or all members of a population do not have an equal chance of being selected as a sample to participate in the study. This method is used when random probability sampling is impossible to conduct and it is faster and easier to obtain data compared to the probability sampling method. One of the reasons to use this method is due to cost and time considerations. It allows us to collect data easily by using a non-random selection based on convenience or certain criteria. This method can lead to a higher-biased risk than the probability sampling method. The method is often used in exploratory and qualitative research. For example, if a group of researchers wants to understand clients’ opinions of a company related to one of its products, they send a survey to the clients who bought and used the product. It is a convenient way to get opinions, but these opinions are only from clients who already used the product. Therefore, the sample data is only representative of one group of clients and cannot be generalized as the opinions of all the clients of the company.
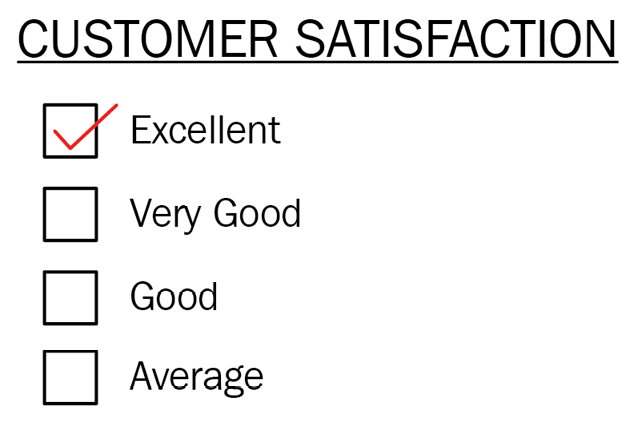
Figure 1.6 – A survey study example
The previous example is one of two types of non-probability sampling methods that we want to discuss here. This method is convenience sampling. In convenience sampling, researchers choose members the most accessible to the researchers from a population to form a sample. This method is easy and inexpensive but generalizing the results obtained to the whole population is questionable.
Quota sampling is another type of non-probability sampling where a sample group is selected to be representative of a larger population in a non-random way. For example, recruiters with limited time can use the quota sampling method to search for potential candidates from professional social networks (LinkedIn, Indeed.com, etc.) and interview them. This method is cost-effective and saves time but presents bias during the selection process.
In this section, we provided an overview of probability and non-probability sampling. Each strategy has advantages and disadvantages, but they help us to minimize risks, such as bias. A well-planned sampling strategy will also help reduce errors in predictive modeling.

 United States
 Great Britain
 India
India
 Germany
 France
 Canada
 Russia
 Spain
Spain
 Brazil
 Australia
 Singapore
 Canary Islands
 Hungary
 Ukraine
 Luxembourg
 Estonia
 Lithuania
 South Korea
 Turkey
 Switzerland
 Colombia
 Taiwan
 Chile
Chile
 Norway
 Ecuador
 Indonesia
 New Zealand
 Cyprus
 Denmark
 Finland
 Poland
 Malta
Malta
 Czechia
 Austria
 Sweden
 Italy
Italy
 Egypt
Egypt
 Belgium
 Portugal
 Slovenia
 Ireland
 Romania
 Greece
 Argentina
 Netherlands
 Bulgaria
 Latvia
 South Africa
 Malaysia
 Japan
Japan
 Slovakia
 Philippines
 Mexico
 Thailand