


 Download code from GitHub
Chapter 1: Introducing AI in Power BI
Everyone wants to be working with data. Organizations are keen on relying more on data-driven decisions instead of intuition-driven decisions. To be driven by data, we need to extract insights from data. Thankfully, Power BI is a great tool to visualize and share what the data tells us. To better understand what trends and learning we can derive from data, we can use techniques from the field of data science.
Data science and artificial intelligence (AI) are becoming increasingly popular approaches to extracting insights from data. Among other things, this is because these tools allow us to work with unstructured data, which we couldn't work with before. And this helps us to more quickly find complicated trends and patterns in the data.
In this book, we will focus on using Microsoft Power BI as a data exploration and visualization tool. And we will take some parts of the Azure cloud to give us the power to train models and integrate this with Power BI.
But first, let's start with some of the groundwork. We need to understand what AI is, to properly scope our projects and run them successfully. We need to know what is possible and how we go from a simple dataset to an AI model before we get into the details of each step of the process. That is why we will first dive into the following questions:
- What do we expect from a data analyst?
- What is AI?
- Why should we use AI in Power BI?
- What are our options for AI in Power BI?
Let's start with covering the basics.
What do we expect from a data analyst?
Every company is looking for different insights and is working with different types and sets of data. Even though you will find data analysts across several organizations, their actual day-to-day work can greatly differ. When reading this book, you will pick up whatever is useful to you, and you will probably skip over irrelevant parts. Nevertheless, it is good to go over what we expect you to know and be familiar with.
First, we will discuss what it means to be a data analyst, the assumptions we make, and why we chose to use this job title. Next, we will go over what you should already know about Power BI and where you can find this information if you feel you need to brush up on that knowledge.
What is a data analyst?
You could call yourself a business intelligence engineer, a business intelligence specialist, a database administrator, or simply a data analyst. Whatever your job title is, you picked up this book because you work with Power BI and want to learn more about it. With all these different titles nowadays, it becomes challenging to understand what your base knowledge should be. For simplicity and consistency, we will refer to a person working with Power BI as a data analyst.
Why a data analyst? Because in this book, we will assume that you are familiar with working with data in Power BI and are able to do the following:
- Prepare data
- Model data (creating a data model in Power BI, not a machine learning model)
- Visualize data
- Analyze data
- Deploy and maintain Power BI deliverables
On the other hand, we'll assume you're unfamiliar with the field of data science. We'll approach all AI features in Power BI from the point of view of this persona. In this book, we'll introduce the machine learning models behind the AI features, to make sure enough is understood to use the features correctly. However, we won't go into the full complexities of all models, as this is not a book targeted at the data scientist, who already has a lot of knowledge about mathematical and statistical methods used in AI.
There are two main skills important for when you are venturing into AI in Power BI: connecting to and visualizing data. Let's elaborate a little bit more on these two topics so that you know what is expected of you before you continue.
Connecting to data
So, assuming we are all data analysts, let's look at our core tasks. The very first thing we need to do to work with data, is get access to data. From a technical perspective, we can very easily connect Power BI to various data sources, whether we have data stored in cloud databases, Azure or otherwise, or whether we have local files we want to connect to. Power BI will allow us to do so and will even allow us to schedule an automatic refresh to visualize new data as long as we set up a gateway connection between the network within which the data resides and the Power BI service.
What kind of data can you work with? Any kind! You can connect to structured data, formatted nicely in tables, semi-structured data, often in the form of JSON, or even unstructured data to insert images into your Power BI reports. This also means data can come from a variety of sources. You can collect Twitter data (semi-structured) which contains tweet text, date of creation, number of retweets, likes, and hashtags used. You can collect sales and marketing data to understand which products you have sold, when you sold them, and which ad campaigns you were running that may have had an effect on your sales. Or maybe you are looking at the supply and demand for your warehouses and stores to make sure you plan the logistics of stocking your stores accordingly.
Since data can be generated by so many different sources, and can come in so many different formats, we also want to think about how we extract that data and get it ready to build reports on. Power BI has a lot of standard connectors to allow you to connect to data. A best practice here, however, is that you have a pipeline handling data orchestration before you even connect Power BI to it. Such a process is often called an ETL (Extract-Transform-Load) or ELT (Extract-Load-Transform) pipeline in which we connect to our sources generating data, extract the data, load it into a database, and transform it if necessary. Although similar tasks can be done by Power BI, we prefer working with ETL tools such as Azure Data Factory to handle these kind of orchestration pipelines when we are working with large amounts of data.
ETL or ELT?
ETL is an established and commonly used approach to extract data from sources. The purpose is often to transform it and load it into a structured database such as an Azure SQL Database and fit the data nicely into columns and rows. This is very well suited for transactional data, where we want to get quick results. However, with the emergence of cloud, the newer approach, ETL, is getting more traction. By extracting and loading the data into a data storage that can store unstructured data, such as an Azure Storage Account or Azure Data Lake, we can dump data in the cloud without having to worry about schemas. This also makes it easier to reuse the same data and transform it in different ways, depending on the insights you want to extract.
Long story short, a lot can and probably should already happen to your data before you even open Power BI. Be aware of the process that may have occurred before data enters Power BI. Whatever source we use for Power BI will influence the options we have within Power BI, as well as the performance of the reports we create. In this book, we will work mostly with preprocessed data, available through files stored on public websites or cloud databases. For some projects with AI, however, we will need to process data before bringing it into Power BI to make sure we can work with it.
Visualizing data
Lastly, the reason we are using Power BI is because we want to tell a story with our data. We want to convert data into valuable and intuitive insights that everyone within our organization can read for their own use. In the context of AI, this may be one of the most important skills of a data analyst, as will be explained in later sections.
So, what do we mean by telling a story? Humans are much more susceptible to stories than listening to data. If we say there is a 70% chance it is going to rain, do you bring an umbrella? It's hard to decide. If someone tells you to bring an umbrella, you will probably do it. Even though we want to make more data-driven decisions, humans are not naturally driven by data. We are driven by stories, which we find more intuitive. That also means that we cannot just give AI insights to humans. We need to translate the output of an AI model to make sure it is understandable for people. That means we need to use the data to tell stories.
The way we can do it within Power BI is by making use of the visuals it offers. We have the option to use standard visuals, import visuals from the marketplace, or create our own visuals using Python or R. Understanding when to use what and how to combine different visuals into a report is an important skill of a data analyst, and a skill we assume you have when reading this book. Throughout the book, remember that to gain people's trust, we need to speak their language and not just throw numbers at them to make them change their behavior.
In this book, we will focus on how we can use Power BI to perform AI. That means that you, as a data analyst, are already familiar with the different types of data you can get into Power BI from the different sources available to you. You should already be familiar with how to create visuals to form a report in Power BI. In later chapters, we will highlight features that are relevant when preparing your data for AI and to actually implement AI. But first, let's talk more about what AI is.
What is AI?
AI is a term often used to show that organizations use state-of-the-art technologies. Interestingly, this term has already existed for over 60 years. Back then, it was defined as the science and engineering of making intelligent machines (Professor John McCarthy, Stanford University, accessed June 2021, http://jmc.stanford.edu/artificial-intelligence/what-is-ai/). Unfortunately for us, that leaves a lot open for interpretation, which is also why the term AI has had so many different meanings over the years.
AI often goes hand in hand with data science, which is a field combining science, engineering, mathematics, and statistics. Its purpose is very much in the name: it's the science of extracting insights from data, to make sense out of the very raw data we might get from any applications or databases we have. Using this field, we can get data, clean it up, train a model based on that data, and integrate that model into our applications to generate predictions on new incoming data.
To fully grasp what AI can do, we need to understand a couple of different terms, often used together with AI: machine learning, deep learning, supervised learning, and unsupervised learning. Next to that, it helps to be familiar with a typical structure of the process it takes to create an AI model.
Understanding the definition of AI
We can find many different definitions for AI, which generally have three main aspects in common:
- Computers
- Executing an intelligent task
- Like a human would do it
Computers come in different forms and can mean software or hardware; it can be an application running locally on someone's laptop or an actual robot. The part of the definition of AI which is more open to interpretation is the intelligent task executed like a human would. What do we consider intelligent? If we think about an intelligent task performed by a human, we could also take the example of a calculator. The more expensive calculators are able to make complex calculations within seconds, which would take a mathematician some time to figure out. However, if you asked someone whether a calculator should be considered AI, the answer would most probably be no.
So, then the question arises: what is intelligence? Fortunately, there are many philosophers who are spending their academic life on answering this question, so let's assume that is outside the scope of this book. Instead, let's agree that the threshold of what is considered to be AI evolves over the years. With new developments come new expectations. Whereas we first considered beating the world champion in chess to be the ultimate level of AI, we now wonder whether we can create fully autonomous self-driving cars.
Some of these new developments have been new types of algorithms that allow us to train even more intelligent models. These algorithms are often categorized as machine learning and deep learning algorithms and are important to understand to know when to use what. We will explore both of these terms in more detail.
Understanding machine learning
If we think back to our simple yet high-performing calculator, you can imagine the intelligence of such a machine being created by a rule-based system. Adding one plus one is always two. This kind of mathematical rule and many others can be programmed into a calculator to empower it to count. This approach is also called using regular expressions and can still be very useful today. It is considered the most rudimentary approach to accomplishing AI but can still yield quick and clear results.
If you want smarter AI, however, you might want to work with techniques where a model is not fully programmed based on rules we humans decide on, but instead is self-learning. Because of this term, it is often thought AI is self-improving and will continuously improve over time until it reaches the singularity. What self-learning actually means is that we do not have to explicitly tell AI how to interpret data coming in. Instead, we show AI a lot of examples and, based on those examples, the model we train will decide how a pattern of variable values influence a specific prediction.
For example, what if you sell laptops and you want to advertise the right laptop to the right person? You could work with a rule-based system where you would create groups based on demographic data, such as women younger than 30, women who are 30 or older, and the same for men younger than 30 and men who are 30 or over. We would have four different groups we would use different marketing strategies on, assuming that every woman younger than 30 has the same requirements when buying a new laptop.
Instead of this, we of course want to pick up on patterns we may not have realized ourselves but can still be found in the data. That is when we would use machine learning to have a self-learning model that looks at the data and learns which variables or features make you interested in specific laptop requirements. It could very well be that, based on this self-learning, we find out that we have different groups we should use different marketing strategies on. For example, we may have a subgroup of both men and women under 30 who love to play online games and need different requirements than men and women under 30 who only use their laptop for work.
Compared to regular expressions, using machine learning to accomplish AI is considered a more sophisticated approach. To create a machine learning model, we take our data, and we choose an algorithm to train a model. These terms are visualized in Figure 1.1:
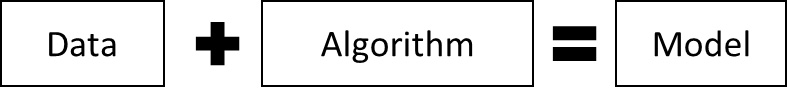
Figure 1.1 – Creating a machine learning model
As seen in Figure 1.1, the data you have and the algorithm you choose are the inputs, and the model you train is the output. The algorithm we select will decide how we want to look at our data. Do we want to classify our data? Do we want to create a regression model where we want to predict a numeric value? Or do we want to cluster our data into different groups? This information is encapsulated in the algorithm you choose when training a model.
Now that we understand what machine learning is, how does it then differ from deep learning?
Understanding deep learning
Machine learning has already opened up a world of possibilities for data scientists. Instead of spending hours and hours exploring data and calculating correlations, covariances, and other statistical metrics to find patterns in the data, we could just train a model to find that pattern for us.
Machine learning was initially done with structured data fitting nicely into columns and rows. Soon, people wanted more. Data scientists wanted to also be able to classify images or to understand patterns in large text documents. Unfortunately, the algorithms within machine learning could not handle these kinds of unstructured data very well, mostly because of the complexity of the data itself. It is said that an image says a thousand words and it is indeed true that even one single pixel of an image holds a lot of information that can be analyzed in many different ways.
With the emergence of cloud computing and the improvements in processing units, a new subfield within machine learning arrived. Instead of the simpler CPUs (Central Processing Units), we now have the more powerful GPUs (Graphical Processing Units) that can process complex data such as images at a much faster rate. With more power comes more cost, but thanks to the cloud, we have GPUs available on demand and only have to pay for when we use them.
Once we had the processing power, we still needed different algorithms to extract the patterns in these kinds of unstructured data. Since we wanted to perform these tasks just like humans would do it, researchers turned to the brain and looked at how the brain processes information. Our brain is made up of cells that we call neurons, which process information on many different layers. So, when looking at unstructured data, researchers tried to recreate a simplified artificial neural network in which these neurons and layers are simulated. This turned out to work very well and resulted in the subfield of deep learning. Now, we can take images and classify them or detect objects in them using the subfield we call Computer Vision. And we can use Natural Language Processing (NLP) to extract insights from text.
We have now talked about AI, machine learning, and deep learning. In Figure 1.2, a visual overview is shown of these three terms:
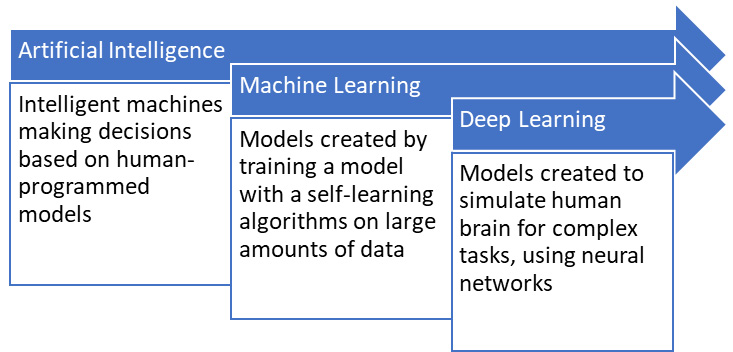
Figure 1.2 – Overview of AI, machine learning, and deep learning
As seen in Figure 1.2, the three terms we just discussed are related to each other. AI is often considered to be the umbrella term for anything we do to let a machine execute an intelligent task like a human would do it. One approach to this has been machine learning, in which we train models not by teaching them the rules, but by letting the models learn themselves. All we do is offer the data and algorithm (which defines the task) to train a model. And lastly, we have deep learning as a subfield of machine learning, in which special algorithms are used to better handle complex tasks such as understanding patterns in unstructured data.
Besides these three main terms that are necessary to understand before working with AI in Power BI, we also need to make a distinction between supervised and unsupervised learning. These two approaches divide the algorithms we will use into two categories. Understanding the difference between them helps us to know what we need to include in our datasets that we will use as input for a model we want to train.
Understanding supervised and unsupervised learning
The purpose of AI is that you want to predict something. You want to predict something such as whether someone is more likely to buy a washing machine or a new fridge. Or you want to predict how many apples you will sell on a given day so that you know how much to supply your store with. What we want to predict is often called a label or tag. Sometimes we have training data that includes that label, and sometimes we do not.
If we run a store that sells apples, we can take our historical data, which we can combine with extra data such as weather data and day of the week. On cold Mondays, no one may want to buy apples but on sunny Fridays, you may run out of apples before noon. Because we can see in our historical data how many apples we have sold in the past when specific conditions were met, we have training data that includes a label, namely number of apples sold. If we know the label, we call this supervised learning.
What about the laptops we were selling? Let's say we have customer data including demographic information such as age and gender. But we may also have data on what they use the laptops for: online games or work. In this case, we do not know how many different groups we should create different marketing strategies for. So, the groups we want to categorize them into do not exist in the training data. Therefore, we have no labels in our training data and thus are doing unsupervised learning.
It is good to make the distinction between these different terms because it will help you understand what is required from your data and what you can expect from the model. Finally, let's zoom in to the different types of algorithms that we can expect to use throughout this book.
Understanding algorithms
When you have decided you want to apply AI to your data, we now know that we need to have data and an algorithm to create a model. We will discuss the requirements of the data in later chapters in much more detail. That leaves us with understanding how to use algorithms. Understanding how to work with algorithms is considered to be the data scientist's expertise as it lies at the cross-section of mathematics and statistics. However, even if we do not build models ourselves, or aspire to becoming full-on data scientists, it is still beneficial to understand the main types of algorithms we can work with.
The most important thing we need to know is that by choosing the right algorithm, we dictate how we want to look at the data and what kind of pattern should be detected by the model. If we talk about supervised learning – where we know the label we want to predict – we often talk about regression or classification. With regression, we try to predict a numeric value, whereas with classification the label is categorical (two or more categories).
Understanding regression algorithms
Imagine you work for a company that supplies electricity to households all across the country. You will have collected a lot of data on your customers, such as where they live, what type of house they live in, the number of people who make up that household, and the size of the house. For existing customers, you know how much energy they have consumed in previous years. For new customers, you want to predict what their energy consumption will be so that you can make a good estimation on what the costs will be for them.
Our data may look something like the table shown in Figure 1.3, where we have historical data for two existing customers, and we want to predict the energy consumption in kWh for the third, new customer:
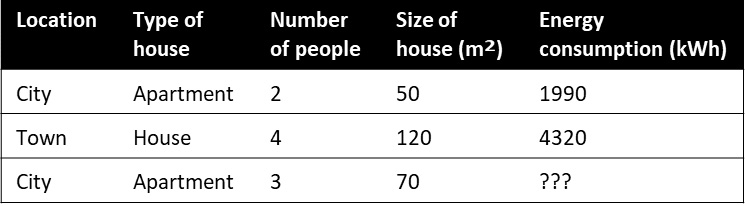
Figure 1.3 – Data for three customers on household characteristics as well as energy consumption
In this example, we know the label: energy consumption. So, we know that we are doing supervised learning. The variable we want to predict has a numerical value (for example 1990 kWh, 4320 kWh, or anything in between). Therefore, this is a simple example of a regression model. There are different algorithms we could choose within the subset of regression to train such a model. The choice may depend on things such as how complicated you want to allow your model to be, how explainable you want your model to be, and how much compute and time you want to spend on training your model. Some examples of such algorithms are linear regression, decision forest regression, and boosted decision tree regression.
Understanding classification algorithms
After we trained our model with one of these algorithms and our historical data, we were able to correctly predict for our new customer what the energy consumption will be and how much they will be spending per month. Our new customer has agreed to buy electricity from us but wants to know more about potential ways to save energy. This brings us to the idea of working more proactively with solar panels. If people have solar panels on their roofs, they can generate electricity themselves on sunny days and save money. We, of course, want to help them with this investment and the installation of solar panels.
Some customers may already have solar panels, some may approach us to talk about solar panels, and some may have never given it a thought. We want to reach out to customers and advertise the solar panels that we sell, but we do not want to annoy or spend marketing budget on customers who already have them.
So, what we want to do now is make an inventory of which of our customers already has solar panels. Sure, we could check with each and every household to see whether they have solar panels, but that seems like a big task that takes too much time and energy. And not every household may react to the survey we would send out to collect that data. We therefore decide we are going to see whether we can predict it. We can collect some sample data, train a model that can predict whether that customer has solar panels, and use those insights to target the right households.
This sample data may look like the data shown in Figure 1.4. We again have historical or known data, and we have a label. Since we know the label for our sample data, we are doing supervised learning. In this case, however, we are not trying to predict a numeric value. The label we try to predict is solar panels, and can either be yes or no. So, we have two categories, making it a classification problem; more specifically, a binary or two-class classification problem:
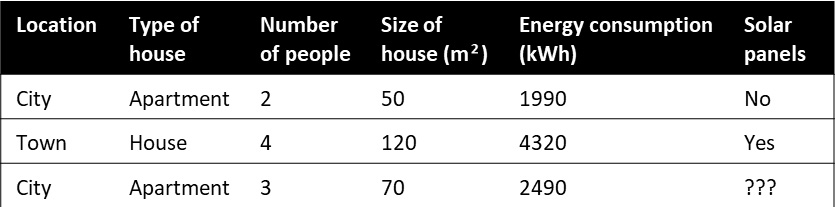
Figure 1.4 – Household characteristics and the solar panels label
Again, there are different algorithms we could choose from when we know we want to do classification. First of all, it matters whether we have two or three or more classes for our label. Next, we again can choose how complex or explainable we want our model to be with options such as a two-class logistic regression or decision forest algorithm to train our model with.
Finally, let's take look at one more simple example so that we have seen different types of algorithms we can work with. Imagine we are still supplying electricity to people all across the country, but now a new competitor has entered the market. We are afraid this new business will take away some of our customers, so we want to offer people nice benefits to convince them to stay with us. We do not want to offer this to all our customers, to save money, meaning we need to make a good assessment on who will leave us.
We have not had many customers leaving us yet, and we want to prevent this from happening. This does mean, however, that we do not have a label; we do not have enough data on the variable we want to predict. In this case, we might want to cluster our customers, and divide them into different groups: those who will leave us for the competitor, and those who will not. We may have some customers that have left us. Based on the little data we have, we can use an algorithm such as K-means clustering to find similar data points to the customers who left us to create these groups and target those that are on the verge of leaving us with attractive deals to make sure they stay with us.
Working with algorithms requires an understanding of the mathematics and statistics behind them. To use them to train models, we rely on data scientists bringing that knowledge to our team so that we can make more data-driven decisions. To work with the AI features in Power BI, we are not expected to become data science experts. It does, however, help to understand the choices being made to realize what the potential and restrictions are of using AI on our data.
Now that we know what AI is and how we can use different algorithms to train our model, let's take a step back and have a look at the complete data science process. How do we take data from beginning to end? And how we can we do so successfully?
What is the data science process?
Just like every project, training a model consists of multiple phases. And just like many projects, these phases are not necessarily linear. Instead, we want to take an iterative approach when developing an AI solution. First, let´s have a look at what the phases of the data science process look like.
The very first thing we need to think about is what we are doing this for. Why do we want to use AI? What is the model going to do? Even though it is good to drive innovation, we want to avoid using AI just because everyone else is doing it. Nevertheless, identifying an appropriate use case for AI can be challenging as many applications are relatively new and unknown. So, what is then a good use case? Of course, it depends on the area of business, but in each area, there is some low-hanging fruit that we can identify. Most commonly, we can think of using AI to predict how to invest marketing budgets, how to increase sales, how to monitor for predictive maintenance, or how to find outliers and anomalies in your data such as risk assessments.
After deciding on the use case, and essentially the scope, it becomes easier to think about what data to use and what metrics to evaluate the model on to know whether it will be successful or not. The next step is then to actually get the data. From a technical perspective, this could mean collecting data, building a new data orchestration pipeline to continuously extract data from a source such as a website or CRM system, or simply getting access to a database that already exists within the organization. Some hurdles may arise here. To train a good model, we need good data. And our data may not meet the requirements of having the right quantity or quality. There may also be Personally Identifiable Information (PII) data that needs to be masked or excluded first before we are allowed to work with that data.
Assuming that data is acquired by the data scientist, they can finally use their expertise to build the model. To build a model, we need data and an algorithm. The data we have received may need some processing. We may want to check for biases in the data, impute missing values, or transform data to make it more useful for our model. This phase is called pre-processing or feature engineering. The purpose is to end up with features that will serve as the input for our model.
Once we have a set of features, often in the form of variables structured as columns in a table, we can actually train the model. This means we try out algorithms and evaluate the models trained by looking at the resulting metrics provided by the different models. This phase by itself is very iterative and can require multiple models being trained (sometimes in parallel). After evaluating the model, based on the requirements from the use case, it can also lead to going back one or more phases to either redefine the use case, get different data, or alter the choices made in feature engineering.
Once it has been decided that a good enough model has been trained, the final phase can finally be executed. What exactly has to happen during this phase will depend on how the model's insights are being consumed. One example of how we can integrate the model is in a client application, where data is generated or collected in that application and is sent to the model to get real-time predictions back, which are also used in applications. Another common example is using a model for batch analysis of data. In this case, we can integrate the model into our data orchestration pipeline to make sure we use powerful compute to process a large amount of data. Whether it is real-time or batch predictions we want to generate, this is a final and crucial step we need to take into consideration when going through the data science process as shown in Figure 1.5:

Figure 1.5 – The five data science process phases
The data science process is not a linear process but understanding the five phases we most likely will iterate through can help us in knowing when to do what. A good project starts with a clearly defined use case, we then acquire data, prepare it through feature engineering, train a model with that data, and finally we integrate our model into our applications or Power BI reports.
Integrating AI with Power BI is of course especially interesting for the data analyst. In the next section, we will try to answer the question why this is a match made in heaven.
Why should we use AI in Power BI?
The question of why we should use AI in Power BI is twofold. First of all, we may wonder why we should use AI to begin with, and secondly, we may wonder why we should use the features in Power BI. To answer the former, we need an understanding of what AI can do, which is covered in earlier sections. To answer the latter, we need to understand why AI is not being adopted yet by most organizations.
The problems with implementing AI
There is an undeniably large interest in anything AI related. Unfortunately, like many new technologies, everyone loves to talk about it, but only few actually do it. There are many reasons why the adoption of AI is lower than expected (McKinsey Survey on AI Adoption from 2018, accessed June 2021, https://www.mckinsey.com/featured-insights/artificial-intelligence/ai-adoption-advances-but-foundational-barriers-remain). The most obvious one seems to be the lack of skills. In previous sections, we discussed what AI is and how we can create models. We discussed how, to train a model, we need to choose an algorithm and that this requires data science knowledge, which is, among other things, a combination of mathematics and statistics. Consequently, a large reason of why companies do not use AI is because they do not have employees with the expertise in building these models and understanding the math behind it.
This is not the biggest roadblock. Many software vendors already recognized this problem some time ago and created tools and services directed at the citizen data scientist, democratizing the technology and making it available for everyone who wants to use it, regardless of whether you have a degree in data science. These easy-to-use tools should not replace any AI investments but do raise the question of why AI is not being used more.
The answer may be because people do not know about it. This has less to do with actual data scientists being hired but more with the rest of the organization. At the higher levels, leadership does not know how to form clear strategies or a practical vision around AI. At the lower levels, employees do not know how to use AI in their day-to-day work and even when AI insights are provided for them to work with, they often end up not trusting the machine as opposed to their own intuition. It seems that for both leadership as well as employees, the problem lies with an incomplete understanding of what AI can do and recognizing the possibilities and restrictions of AI.
Even when companies have recognized the potential, created a clear strategy on implementing AI, and hired the right people for it, they face issues. When you ask a data scientist what the most challenging part of their job is, they rarely mention training the model. The most common hurdle revolves around the data. Either for political or technical reasons, data scientists cannot get access to the right data. The data they need might not even exist. And even when they do get access to the right data, it is often not of good quality or of enough quantity to train a good model with.
And finally, to really implement AI into your business processes, you not only need data scientists, but you also need a whole team. You need data engineers to help you with extracting data from their sources, clean the data at scale, and offer it to the data scientists who can then train a model. After a model is trained, you need to make sure the insights are offered to the business in an intuitive way, for which you will need software engineers to integrate the model into the client applications or data analysts to visualize the insights from the models in your Power BI reports.
In other words, to create an end-to-end solution and implement AI in an enterprise environment, you need an interdisciplinary approach, and a collaboration between different departments, where, preferably, you also want to ensure that everyone has a basic understanding of what AI can do to build trust and enhance adoption.
Why AI in Power BI is the solution
Now that we understand the problem, we can get an idea of what could be the solution. Since there are many reasons there is a slow adoption of AI, here is an overview:
- Lack of data science skills
- Incomplete understanding of AI
- Not enough, or not good enough, data
- No collaboration between departments
Unfortunately, finding skilled data scientists is very challenging. The alternative can be to train your employees, which is something that will also help against an incomplete understanding of AI that is seen across different layers of organizations. To collect better or more data, we need to know what we are doing it for. Why should we invest in this and what will be the benefit? And to stimulate collaboration between departments, we need to create understanding and trust.
One tool that can help with all of these things is Power BI. Compared to data scientists, companies have significantly more data analysts who are familiar with working with data and who are either already working with Power BI or will easily adapt to working with it. That means that data analysts already know the importance of good data and have access to data. Using Power BI, we try to tell a story with the insights we generate from data, to help people make data-driven decisions. Data analysts know how to convey numbers into intuitive facts. They can help convey AI output into information that can be understood and trusted by anyone within and outside the organization. This can consequently also help with facilitating collaboration between departments as Power BI can already be used across different departments.
The only blocker is that those using Power BI are often not familiar with AI. They might not have the data science expertise, but they are the ones who can work very well with them. By combining AI with Power BI, we can educate others, to help the business create clearer AI strategies and to help end users gain trust over the model's output and how it can help them in their business processes.
That is why this book covers the different AI options in Power BI. They include low-hanging fruit to get started with today, to show the possibilities of AI. But Power BI can also integrate with sophisticated models that have been trained by data scientists. It is therefore a logical starting point to adopt AI at a larger scale within your organization.
Now that we understand why it is so beneficial to use AI in Power BI, let's have a look at our options.
What are our options for AI in Power BI?
If we think about what we can do with AI in Power BI, there are roughly two categories we could put the options in. First of all, we have the low-hanging fruit: the easy projects with which we can start today. And second, we have the ability to create our own models and integrate these with our Power BI reports that give us more flexibility but require a larger time investment.
Out-of-the-box options
The easy AI options in Power BI can also be referred to as out-of-the-box AI features. These models are pre-built by Microsoft, meaning that we do not need to spend time on collecting data to train the model, nor do we need the expertise to choose the right algorithm. That already saves us time on the most challenging phases in the data science process!
For most of these features, the models are already integrated with Power BI and all we have to do is consume them. For others, we have the option to add a little bit of our own data to customize it to our business scenario. That means that there is some kind of base model under the hood that is already trained by Microsoft on data collected by Microsoft (check the Privacy Agreement for the service you are working with to see whether your data is being used). We then add our own data so that Microsoft can finish training a model in a fraction of the time it would take us to create the same model ourselves from scratch.
Next to that, we can also see these models being offered in various ways. We have integrated models in Power BI that are accessible through rich visuals, also known as AI visuals. We have integrated models that can be used with a specific type of data, such as the forecasting we can add when plotting time-series data. And finally, we can use the Cognitive Services, a collection of Azure services consisting of pre-built models that we can very easily integrate with any application through the use of APIs.
Creating your own models
The advantage of using pre-built models is that you save time and money when getting started with AI. The disadvantage of using these kinds of models from any software vendor is that you have less control and less flexibility over the design of your model. If, instead, you want to create your own models, you do need access to data science expertise to make the right decisions when training a model.
Still, there are many situations in which we want to make sure we create a model that is specifically designed for our use case. In this book, we'll assume we want to work with Microsoft's cloud platform Azure to easily integrate any machine learning model with Power BI. We have three main options in Azure when training our own model:
- Using Automated Machine Learning to train multiple models (in parallel), choose the best one, and integrate that one with our data pipeline.
- Using the Azure Machine Learning Designer to create a model.
Both of these options require less data science expertise than the final option:
- Using the Azure Machine Learning workspace to train and deploy model based on training scripts that are created from scratch. The latter is what data scientists are often trained to do. They are comfortable in Python or R and most commonly use open source libraries such as Scikit-learn, PyTorch, or TensorFlow to train models.
Whatever option you go for, the purpose is that you are in full control over the training data, and you can choose which algorithms to use when training a model. This means it can take more skill, time, and compute power to get to the same end result as when we use out-of-the-box models. Both pre-built models as well as self-built models therefore serve their purpose and for each use case it should be evaluated which approach works best.
Summary
In this chapter, we discussed what skills you bring in as a data analyst, what you need to know about AI, and why combining AI and Power BI helps in the adoption of AI, and gave you a sneak peek into what we will cover in the rest of this book, namely the options for AI in Power BI. Not all options may be relevant for you or your organization, but at least subsequent chapters will provide you with a clear overview of what is possible so that you can educate yourself and others. Hopefully, this will give you the understanding of AI needed to help your company create a clear strategy on how to become a more data-driven organization that uses AI at a large scale.
In the next chapter, we will focus on the first input we need to train a model: the data. We will talk about how we can explore our data so that we understand what the input will be or what we need to do to make sure it is the right dataset for the job.
