Download code from GitHub
Observability 101
Observability is the hot new tech buzzword. Observability is confused with many other practices, such as monitoring, tracing, logging, telemetry, and instrumentation. But observability is a superset of all these, and all are required to achieve observability. It includes measuring your infrastructure, application, and user experience to understand how they are doing and then acting on the findings with predictive or reactive solutions.
One of the benefits of working with older technologies was the limited set of defined failure modes. Yes, things broke, but you would know what went wrong at any given time, or you could find out quickly because many older systems repeatedly failed in the same ways. As systems became more complex, the possible failures became more abundant. To address the possible failures of these complex systems, monitoring tools were created. We kept track of our application performance with monitoring, data collection, and time-series analytics. This process was manageable for a while but quickly got out of hand.
Modern systems are extraordinarily complex, with everything depending on open source libraries and turning into cloud-native microservices running on Kubernetes clusters. Further, we develop them faster than ever, and the possible failure modes multiply as we implement and deploy these distributed systems more quickly.
When something fails, it’s no longer obvious what caused it. Nothing is perfect; every software system will fail at some point, and the best thing we can do as developers is to make sure that when our software fails, it’s as easy as possible for us to fix it. Standard monitoring, which is always reactive, cannot fix this problem, and it can only track known unknowns. The new unknowns mean that we have to do more work to figure out what’s going on. Observability goes beyond mere monitoring (even of very complicated infrastructures) and is instead about building visibility into every layer of your business. Increased visibility gives everyone invested in the business more significant insight into issues and user experience, and creates more time for more strategic initiatives, instead of firefighting issues.
In this chapter, we are going to cover the following topics:
- What is observability?
- The need for observability in a distributed application environment
- Building blocks of observability
- Benefits of observability
Technical requirements
For this chapter, you must have a basic understanding of application deployment and operations.
Some basic coding skills are also required. We will use some code samples to illustrate concepts, but we will keep it simple and focus less on the code and more on the ideas explained.
Finally, we will use the Python language for all the code samples if not explicitly stated otherwise.
What is observability?
If you are reading this book, the odds are you have already read about or heard the term observability elsewhere, and have decided to apply it to your AWS workloads. You are in the right place. But even being a book for the practitioner, we can’t start this book without defining some terms. They will become our guide for the rest of this book, helping us drive our discussions. Let’s start with the main one: observability.
The engineer Rudolf E. Kálmán coined the term observability (abbreviated as o11y) in 1960.
In his 1960 paper, Kálmán describes what he calls observability in the field of control theory: the measure of how well someone can infer a system’s internal states from knowledge of its external signals/outputs.
Observability is another borrowed term, in the same way as software architecture, software engineering, and design patterns. We borrow a complex, mathematical term from an older, more mature field and make it ours in our younger computing field. And to do that, we need to make it softer to make it usable.
So, in this book, we will say an application has observability if the following is true:
- You can read any variable that affects the application state
- You can understand how the application reached that state
- You can execute both the aforementioned points without deploying any new code
So, your application is observable if you can answer questions that you knew you should ask, but you can also answer questions that you didn’t know you needed to ask.
So far, we have defined what observability is. But if you are like me, the first time I saw a description of observability like the one provided here, it didn’t help me understand it or even what made it different from our old friend: monitoring. But I like examples, so let me try to do a better job to help you. In the next section, we will see a small application example, we will apply monitoring practices to keep our application up and running, and we will fail. Let’s discuss why we failed and how observability principles can improve the situation in our sample scenario.
The need for observability in a distributed application environment
Let’s suppose you want to create the definitive Hello World program so that no other developer will need to implement it again. But you want to add a minor new feature: the users can give their names, and the application should remember them, all based on modern REST APIs. So, you implement something as follows:
from flask import Flask, request
import os.path
app = Flask(__name__)
@app.route("/")
def hello_world():
    name = request.args.get('name')
    if name:
        with open("name.txt", "w") as text_file:
             text_file.write(name)
    name_file = None
    if os.path.exists("name.txt"):
        with open("name.txt") as text_file:
             name_file = text_file.read()
    if name_file:
        return {
            "msg" : f"Hello, {name_file}!"
        }
    return {
        "msg": "Hello, World!"
    }
In this small example, written in the Python (https://www.python.org) language and using the Flask (https://flask.palletsprojects.com/en/2.0.x/) web framework, we have an optional name query parameter, which, if we receive it, we store in a file. Anyway, we always read from the file, and if there’s something in it, we return a friendly hello to our old, returning friend. Otherwise, we return an also friendly but generic Hello, World! message.
We can see an example of user interaction with our REST API here:
> curl http://127.0.0.1:5000/
{"msg":"Hello, World!"}
> curl http://127.0.0.1:5000/?name=User
{"msg":"Hello, User!"}
> curl http://127.0.0.1:5000/
{"msg":"Hello, User!"}
Our local tests show the implementation works as intended, so we are ready to shock and revolutionize the world. Our organization follows best practices, so we need to define and monitor key application metrics before we deploy our application in production. After years of deploying and monitoring applications, we, as software engineers, start to understand what can go wrong and what to keep an eye on. Usually, applications can be CPU-, memory-, or I/O-intensive. Given that our application writes and reads data to/from a file, we decided a key metric is input/output operations per second (IOPS). We add the necessary tools to monitor it and the CPU and memory just in case. We also create dashboards to have visual clues of our current state, and we implement alarms to notify us when we think we are reaching any system limits. This all looks good, so let’s open the gates for our beloved users!
But after a few users start to use our application, reports of unexpected behaviors begin to pour into our issue system. Some users sent their names, but the application failed to store them. Or even worse, some users received the names of other users in a significant data privacy leak. Nobody wants to be in the news because of that.
What happened to our perfect, simple, little application? During the deployment, our operations teams used a typical deployment pattern to increase the application’s scalability and availability, as shown in the following diagram:

Figure 1.1 – Load balancing requests to multiple servers
Many of you may recognize the pattern described in this diagram. For many years, even on-premises operations teams have deployed multiple nodes of the same application behind a load balancer, which distributes incoming requests in a round-robin fashion to all of them. In this way, you can quickly scale the number of requests the application can handle by the number of nodes, and if a node fails, the load balancer automatically redirects new requests to the yet-available nodes.
We look at our configured metrics and we are clueless. None of our metrics helps us solve the problem. We deploy new metrics. We watch the problem occur a couple of times again (with new, angry users). And after debugging a bit, we find that the users who could not see their names after sending them received responses from servers that did not have their names stored in the local storage. Even worse, the users receiving other users’ names received responses from servers that stored names from other users. What a mess!
Postmortem time: what happened, and how can we prevent it from happening again? When our operations team deployed our application behind a load balancer, we had multiple nodes, not just one anymore. New nodes could appear and disappear. This failure of nodes, combined with the fact we keep the application state in the individual nodes, causes the issue.
This is a simplistic, even silly, example of the jump in complexity from the local, single-user development environment to a distributed, multi-node, auto-scaling production environment. Our code is simple, and because of that, we thought nothing could go wrong. But there are many things outside our application code we don’t understand entirely. Still, we take them for granted: the CPU run queue, the kernel multi-threading, the language virtual machine, the network stack, the load balancing strategy… and many more. They all contain the application state and the potential root cause for an issue.
This simple example shows that an initially observable application, deployed as a standalone process, as many monoliths are, no longer remains observable as soon as we use modern techniques such as multiple nodes and load balancing. Those components added more complexity and issues we didn’t expect. As our user base grows and we split our monolithic application into many related services, what was the right observability tool before may not be the right tool now. This mismatch can catch us off guard because the complexity jump is exponential. As a terrifying example, see the following graph:

Figure 1.2 – Real-time graph of microservice dependencies at http://amazon.com in 2008
In our small example, we applied the usual techniques under the monitoring umbrella. The practice of monitoring is good enough for monolithic and small-scale distributed applications. And in this book, we will start with them, and we will progress, showing you the right tools for the job. With some experience, operations teams can reduce the potential failure space from hundreds, maybe thousands, of possibilities to a few. But we expect our businesses to grow, and with it, the supporting applications. The number of possible application and error states grows exponentially. As soon as our application reaches a specific size, at any moment, a call in the middle of the night can quickly become a sleepless night while we try to navigate the maze of our metrics to find the right set of inputs that have caused a new, unforeseen issue.
Modern applications have gotten good at accounting for failures that can be caught by tests and use established techniques such as autoscaling and failovers to make the application more resilient. As we catch up on known variables and take action to monitor them, the unknown unknowns are left. The issues we often see in modern applications are emergent failure modes, which happen when many unlikely events line up to degrade the performance of the system or even take it down. These scenarios are challenging to debug, which entails the need for observability.
If we want to understand any application state without deploying new code, we need to collect as much context as possible and store it all. We need mechanisms to query, slice, and summarize this data in new ways. Some of this complexity may not fit in our human brains anymore, so the support of machine learning tools is a must. Dashboards and alarms continue to be necessary for the well-known failure states, but to reach the next step, we need new tools in our tool belt.
So far, we have seen what observability is and how it evolved from more traditional monitoring practices to support more complex systems. We saw the need to collect more data and answer questions we didn’t know we should answer. In the next section, we will see the basic observability components and how they relate.
Building blocks of observability
There are three fundamental building blocks of observability: metrics, logs, and traces. Each plays a specific role in infrastructure and application monitoring, so you need to understand what they bring to the table. They can be called the golden triangle of observability, as depicted in the following figure:
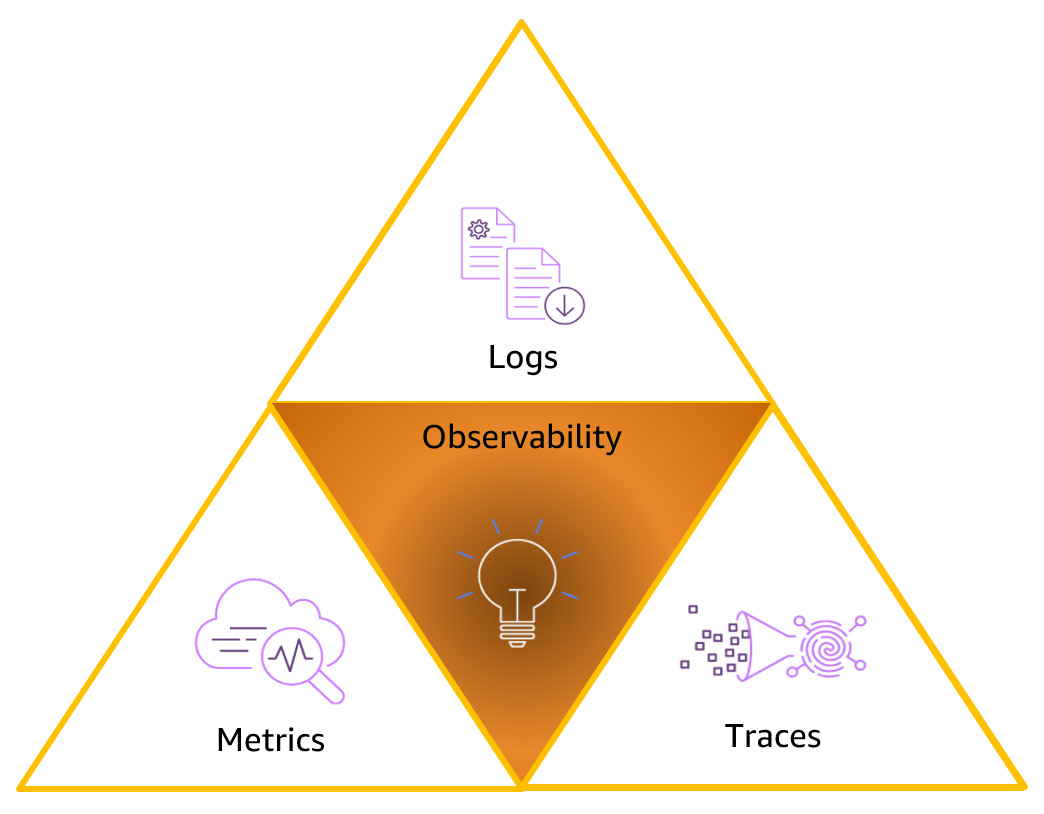
Figure 1.3 – Observability building blocks
Now, let’s try to understand the three building blocks.
Metrics
Metrics are measurements of resource usage or behavior of your system over time. They might be low-level measurements of system resources, such as the CPU, memory utilization, disk space, or the number of I/O operations per second. They could also be high-level indicators, such as how the user interacts with your system – for example, how many customer requests, the number of clicks on a web page, the number of products added to the shopping cart, and so on.
Everything from the operating system to the application can generate metrics, and a metric is composed of a name, a timestamp, a field representing some value, and potentially a unit. Metrics are a prominent place to start observability.
For many years, metrics have been the starting point to measure a system’s health, representing the data on which monitoring systems are built to give a holistic view of your environment, automate responses to events, and alert humans when something needs their attention. In the following figure, you can see a simple example of a CPU utilization metric:
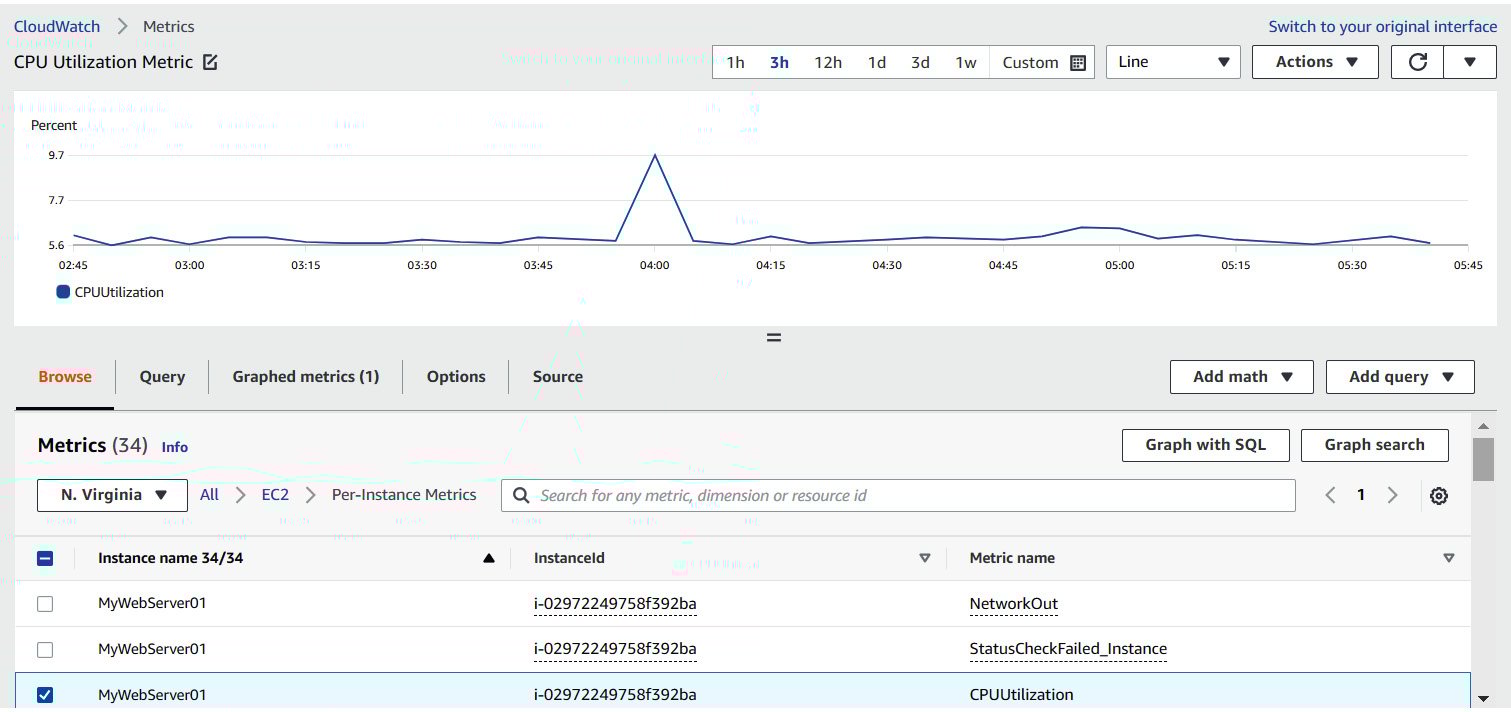
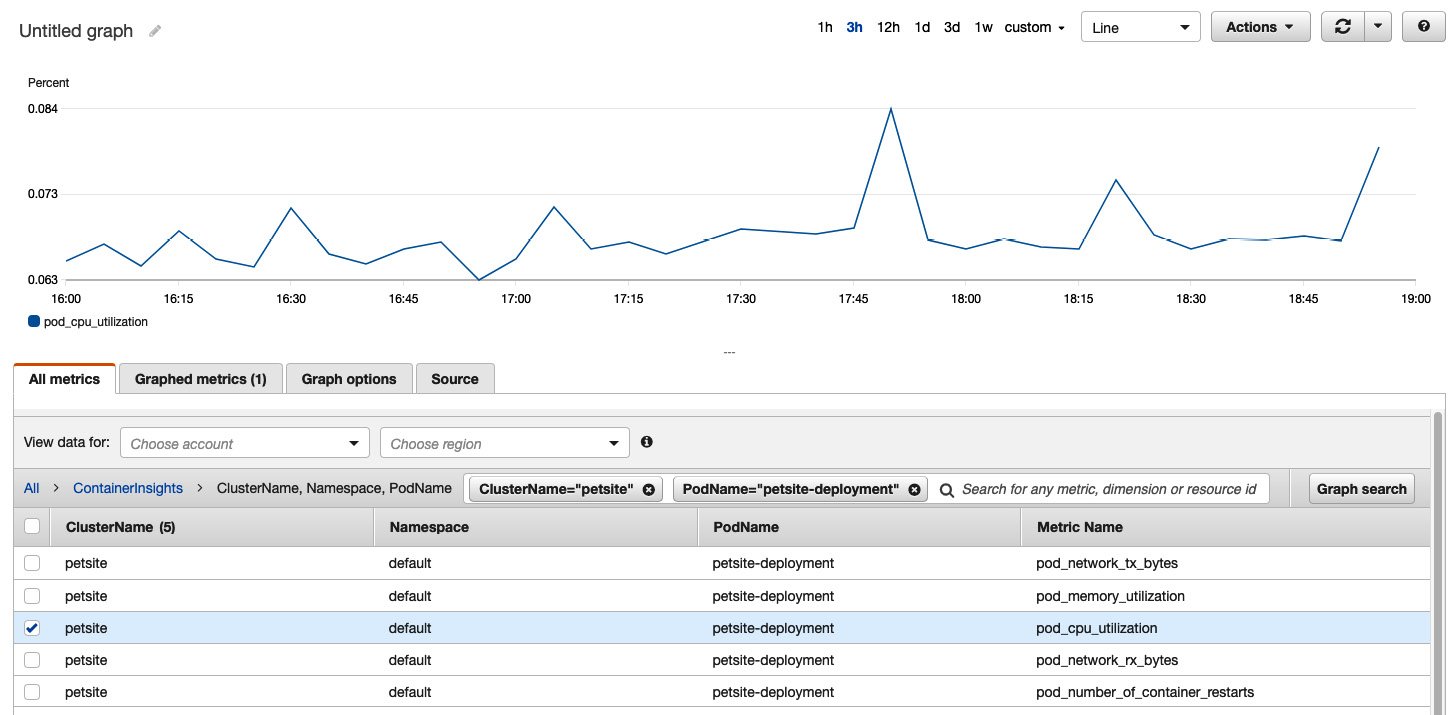
Figure 1.4 – A CloudWatch metric
When a solution expands to hundreds or thousands of microservices, the risk of false positives and false negatives increases, causing alarm fatigue. The root cause of this alarm fatigue is twofold.
First, we are keeping old habits from the monolithic times, when we had a single system to care for, and operations engineers did their best to keep it up all the time. The objective was to avoid failures entirely. We collect metrics and establish healthy/unhealthy thresholds for many of them. And on every unexpected outage, a postmortem evaluation of the causes will point out which metrics/alarms were missing in a rinse-and-repeat fashion.
Second, for any highly distributed and scalable system:
Everything Fails All the Time
The mechanisms and controls we use on monolithic or small-scale applications are not the right choices on higher scales because failures are expected. The question now is whether the issues are or aren’t affecting our end customer experience or business processes and not whether a single service is up and running.
That’s why we see a change in the metrics being used to notify operation engineers that something is wrong, from low-level metrics (CPU, memory utilization, and disk space), to aggregated metrics related to the user experience and business outcomes (web page time to interact, error rate, and conversion rate).
We will look at different tools for collecting and analyzing metrics in this book.
Logs
Event logs, or simply logs, are probably the oldest and simplest way to expose the internal state of an application. A log is a file or collection of files that contains the history of all the clues the application developers decided to leave to someone else. In case of issues, they could read it and understand the application’s steps until the failure. See the following example:
import logging
logging.basicConfig(format='%(asctime)s - %(name)s - %(levelname)s - %(message)s',filename='example.log', encoding='utf-8', level=logging.DEBUG)
logging.info('Store input numbers')
num1 = input('Enter first number: ')
num2 = input('Enter second number: ')
logging.debug('First number entered: %s', num1)
logging.debug('Second number entered: %s', num2)
logging.info('Add two numbers')
sum = float(num1) + float(num2)
logging.debug('Sum of the two numbers: %d', sum)
logging.info('Displaying the sum')
msg = 'The sum of {0} and {1} is {2}'.num1
logging.debug('Rendered message: %s', msg)
print(msg)
After executing this program, the resulting log file looks like this:
2022-03-20 17:21:40,886 – root – INFO – Store input numbers
2022-03-20 17:21:43,758 – root – DEBUG – First number entered: 1
2022-03-20 17:21:43,758 – root – DEBUG – Second number entered: 2
2022-03-20 17:21:43,758 – root – INFO – Add two numbers
2022-03-20 17:21:43,758 – root – DEBUG – Sum of the two numbers: 3
2022-03-20 17:21:43,759 – root – INFO – Displaying the sum
2022-03-20 17:21:43,759 – root – DEBUG – Rendered message: The sum of 1 and 2 is 3.0
As we can see, logs initially used an unstructured format because they were meant to be readable by humans. And initially, they were written on the local disk of the machine running the application.
We can quickly see how the jump from a single, monolithic application to a distributed system, or even a collection of distributed systems, can affect how we use or process log files. I used SSH to connect to a machine and check the server logs. Today, we have applications dynamically coming online because of a scale-out event or terminated because they failed a health check. We can’t store the logs on the local machine anymore; otherwise, they would be lost sooner or later. We need a place to send them and keep them.
Another substantial improvement is to make them machine-readable. In our investigation to understand what happened with our application, we need to collect as much context as possible and make it available in a system where we can query, slice, and aggregate it in new and unexpected ways. We can’t simply connect to a single machine and read a single log file anymore. Instead, we need to understand the execution steps of potentially hundreds of servers.
Check out the same log example here, but now using structured logs:
import logging
import structlog
logging.basicConfig(format='%(message)s',filename='example.log', encoding='utf-8', level=logging.DEBUG)
structlog.configure(
    processors=[
        structlog.stdlib.filter_by_level,
        structlog.stdlib.add_logger_name,
        structlog.stdlib.add_log_level,
        structlog.stdlib.PositionalArgumentsFormatter(),
        structlog.processors.TimeStamper(fmt="iso"),
        structlog.processors.StackInfoRenderer(),
        structlog.processors.format_exc_info,
        structlog.processors.UnicodeDecoder(),
        structlog.processors.JSONRenderer()
    ],
    wrapper_class=structlog.stdlib.BoundLogger,
    logger_factory=structlog.stdlib.LoggerFactory(),
    cache_logger_on_first_use=True,
)
log = structlog.get_logger()
num1 = input('Enter first number: ')
num2 = input('Enter second number: ')
log = log.bind(num1=num1)
log = log.bind(num2=num2)
sum = float(num1) + float(num2)
log = log.bind(sum=sum)
msg = 'The sum of {0} and {1} is {2}'.num1
log.debug('Rendered message', msg=msg)
print(msg)
The resulting logs are as follows:
{"num1": "1", "num2": "2", "sum": 3.0, "msg": "The sum of 1 and 2 is 3.0", "event": "Rendered message", "logger": "__main__", "level": "debug", "timestamp": "2022-03-22T07:43:11.694537Z"}
As you can see, the structured logs contain key-value pairs with the relevant data. To make it easier for machine consumption, we can use a semi-structured format such as JSON. And also, instead of multiple lines that tell us what happened, the logs are structured to represent a unit of work, so you can aggregate more data in a single context.
We can also see a profound shift in how we debug issues in our production system. Initially, it was reactive: we collected metrics and defined healthy thresholds for some of them. As soon as one of those thresholds was crossed, the monitoring system would send an alert via an SMS or pager to the engineer of that shift to go and investigate further. So, the engineer would check the metric that raised the alarm, as well as all the other metrics, create a hypothesis of what could be the problem, and only then use logs to prove or refute the hypothesis. So, in this case, if the metrics show that the system is malfunctioning, logs show why it is malfunctioning.
With the explosion in the number of servers and services a team must handle, we see a shift toward the proactive use of observability tools, where the engineers don’t just use them when there’s an issue but all the time. When doing a new release or when activating a new feature using a feature flag, we need to check not only the 99.9% satisfied end users but the other 0.1%. And to collect all the necessary data, structured logs are a fundamental tool, and the path for the investigation starts with them instead. We see engineers using analytic tools to make complex queries against the data generated by structured logs first and checking some other auxiliary data second to confirm the issue.
Throughout this book, we will look at tools for collecting and analyzing data for systems of any size so that you can decide which one fits your case best.
Traces
Last but not least in the observability triangle is application trace data. Trace and logs are sometimes difficult to differentiate, but the main difference is in nature and intent. While logs are discrete events that localize issues and errors, traces are continuous. They understand the application flow while processing a single task/event or request.
Traces are more verbose. They include information such as which methods/functions were called, with which parameters, how long a method took to return a value, the call order, information about the thread context, and more. Because of that, tracing is often implemented using instrumentation, utilizing the programing language runtime reflection mechanism to introduce hooks and automatically collect this information.
Traces add the critical visibility of the application end to end. Traces typically focus on the application layer and provide limited visibility into the underlying infrastructure’s health. So, metrics and traces complement each other to give you complete visibility into the end-to-end application environment.
But more interesting than just tracing is distributed tracing. Distributed tracing is the capability of a tracing solution to track and observe service requests as they flow through multiple systems. The tracing process starts at one of the application’s entry points (for example, a user request on the web application), which generates a unique identifier. This identifier is carried along while traversing the local method calls, using techniques such as attaching it to the thread context. When a request is made to an external system, the request carries this unique ID as part of the request metadata (for example, part of the HTTP headers in an HTTP-based REST call). The recipient system unpacks the ID and carries it along similarly.
In this way, when we aggregate the data generated by different systems, we can see the request flow from application to application, the time it took to process locally, or how much time it took to call external data sources.
A distributed tracing map will look like this:
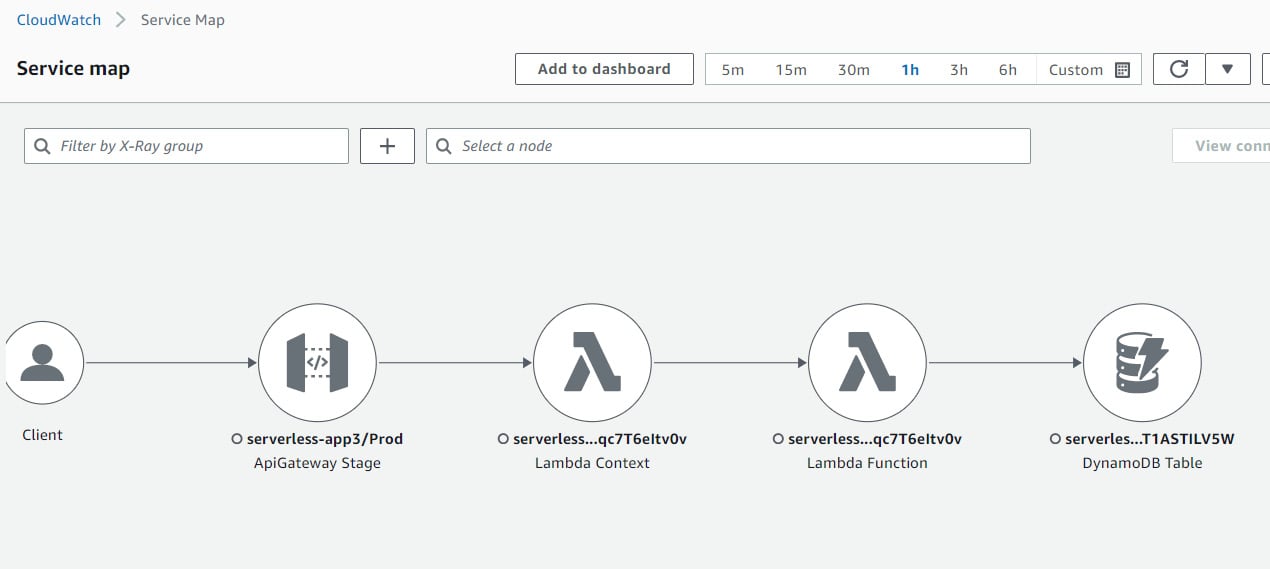
Figure 1.5 – A service map on X-Ray
Later in this book, you will learn how to add distributed tracing capabilities to your application.
What is the relationship between the three pillars?
When a user request occurs, and a delay has occurred for the request, metrics provide the data to demonstrate data quantitatively, such as the number of requests. At the same time, it can also record the number of services the request passes through when it occurs using the trace data. If you would like to record detailed information when an error occurs, you can do so using the log data.
As we can see, it is easy for us to see metrics, tracing, and logging and the connection between these three kinds of data.
Will I need to adapt all three pillars?
The simpler your environment and the more tolerant you are of performance degradation and outages, the fewer tools are required to keep it running and simple metrics will be able to work fine for you.
If the environment becomes complex and has to be up and running all the time or needs to be fixed as quickly as possible, you will require a mix of tools to understand where it is broken. Metrics and logs will support you with this requirement.
If your environment consists of a lot of microservices, then adding traces will save you effort when it comes to troubleshooting problems across the environment.
In this section, we saw the basic observability building blocks, a few of their historical origins, and how they evolved. We also briefly saw the need to connect all three to create a holistic view. In the next section, we will see why we should invest in improving our system’s observability.
Benefits of observability
Adopting observability to analyze system performance used to be the job of sysadmins and ops teams, who cared most about the mean time to detect (MTTD) and mean time to resolve (MTTR). Today, more job roles than ever need to use observability data. With the rise of DevOps, CI/CD, and Agile methods, developers are often directly responsible for the performance of their apps in production. SREs and DevOps staff care about meeting service-level indicators (SLIs) and service-level objectives (SLOs). Information about systems and workloads is also used by business leaders in making decisions about capacity, spending, risk, and end user experience. Each stakeholder in an organization has different needs for what is monitored and how the resulting data is analyzed, reported, and displayed. Let’s try to understand the benefits of observability in the real world for different personas.
Understanding application health and performance to improve customer experience
The main observability goal is to know what is going on anywhere in your system to ensure the best possible experience for your end users. You want to detect problems quickly, investigate them efficiently, and remediate them as soon as possible to minimize downtime and other disruptions to your customers.
Improving developer productivity
Traditional debugging by analyzing logs or instrumenting breakpoints into code is tedious, repetitive, and time-consuming. It doesn’t scale well for production applications or those built using microservice or serverless architectures. To analyze performance across distributed applications, developers need to correlate metrics and traces to identify user impact from any source and to find broken or expensive code paths as quickly as possible. And they need to do all this without having to re-instrument their code when they want to add new observability tools to their kit.
Getting more insight with visualizations
Observability, especially at scale, can generate huge volumes of data that become difficult for humans to parse. Visualization tools help humans make sense of data by correlating observability data into intuitive graphic displays. However, having a bunch of graphs, charts, and more scattered across multiple tools and displays becomes a problem. It’s essential to centralize visual data into a single dashboard, giving you a unified view of your system’s critical information and performance.
Digital eperience monitoring
Digital Experience Monitoring (DEM) correlates infrastructure and operations metrics with business outcomes by focusing on the end user experience. It seeks to reduce the MTTR in the event of client-side performance issues by monitoring the client-side performance on web and mobile applications in real time. Resolution is assisted by the relevant debugging data such as error messages, stack traces, and user sessions to fix performance issues such as JavaScript errors, crashes, and latencies.
Controlling cost and planning capacity
A key advantage to operating in the cloud is that you can scale quickly to meet demand during peak load times. However, unplanned and uncontrolled growth can result in unexpected costs. Observability can help you find performance improvements, such as reducing the CPU footprint. Across a fleet of thousands or hundreds of thousands of instances, a slight percentage performance improvement in how much CPU an application uses can save millions of dollars. Similarly, by using observability to understand and predict your future capacity needs, you can take advantage of the cost savings available from reserve and spot pricing and avoid cost surprises.
Summary
In this chapter, we saw what observability means in the context of software applications and what makes it different from monitoring. We saw increased observability complexity, from more straightforward, monolithic applications to more complex, distributed applications. We discussed the observability building blocks and how they evolved. Finally, we saw some critical use cases where observability principles bring attractive business advantages.
Now, you can more easily discuss the differences between monitoring and observability, and when to adopt one of them. You can also advocate for observability principles in your organization, clearly understanding the requirements and advantages.
In the next chapter, we will map the different AWS services we can use to make applications observable.
Questions
Answer the following questions to test your knowledge of this chapter:
- Which characteristics must a solution have to make it observable?
- What’s the difference between monitoring and observability?
- Why is observability important for complex, distributed applications?
- What is alarm fatigue and what are its root causes?
- What’s the difference between unstructured and structured logs? What makes structured logs better for more complex use cases?
- What’s the difference between tracing and distributed tracing?
- Can you cite three use cases for observability?