


 Download code from GitHub
Graph databases have gained increasing attention in the last few years. Data models built from graphs bring together the simplicity of document-oriented databases and the clarity of SQL tables. Among others, Neo4j is a database that comes with a large ecosystem, including the database, but also tools to build web applications, such as the GRANDstack, and tools to use graph data in a machine learning pipeline, as well as the Graph Data Science Library. This book will discuss those tools, but let's first start from the beginning.
Talking about graph databases means talking about graphs. Even if you do not need to know all the details about graph theory, it’s always a good idea to learn some of the basic concepts underlying the tool you are using. In this chapter, we will start by defining graphs and giving some simple and less simple examples of graphs and their applications. We will then see how to move from the well-known SQL tables to graph data modeling. We’ll conclude by introducing Neo4j and its building blocks, and review some design principles to understand what can and can’t be done with Neo4j.
This chapter will cover the following topics:
- Graph definition and examples
- Moving from SQL to graph databases
- Neo4j: the nodes, relationships, and properties model
- Understanding graph properties
- Considerations for graph modeling in Neo4j
Graph definition and examples
The question you may ask at this point is "Why should I care about graphs? After all, my company/business/interest is not about graphs or networks of any kind. I know my data model, well arranged into SQL tables or NoSQL documents, and I can retrieve the information I want when I want." This book will teach you how to empower your data by looking at it in a different way. Surprisingly enough, graphs can be used to model a lot of processes, from the more obvious ones such as road networks, to less intuitive use cases such as video games or credit card fraud detection, among many others.
Graph theory
Let's start from the beginning and answer the question "What is a graph?"
A bit of history: the Seven Bridges of Königsberg problem
Graph studies originate back to Leonhard Euler, a prolific Swiss mathematician who lived in the eighteenth century. In 1735, he published a paper proposing a solution to the Seven Bridges of Königsberg problem. The problem is the following:
Given the city whose geography is depicted in the following image, is there a way to walk across each of the seven bridges of the city once and only once, and return to our starting point?
As you can see, this city is crossed by a river that splits the city into two banks, A and B. The river meander additionally creates two islands, C and D, also part of the city. Those two banks and two islands are connected by a total of seven bridges: two bridges between A and C, two other bridges between C and B, one between C and D, one between B and D, and a last one between D and A:

Euler's reasoning (on the right side) was to reduce this complex geography to the most simple drawing, like the one you can see on the right of the previous image, since the route used within each island is not relevant. Each island then becomes a single point, or node, connected to another by one or several links, or edges, representing the bridges.
With this simple visualization, the mathematician was able to solve the initial problem by noting that, if you arrive at an island (vertex) via one bridge, you will need to leave it using another bridge (except for the start and end vertices). In other words, all vertices but two need to be connected to an even number of relationships. This is not the case in the Königsberg graph, since we have the following:
A: 3 connections (to C twice, and to D once)
B: 3 connections (to C twice, and to D once)
C: 5 connections (to A twice, to B twice and to D once)
D: 3 connections (to A once, to C once and to D once)
This kind of path, where each edge is used once and only once, is called a Eulerian cycle and it can be said that a graph has a Eulerian cycle if and only if all of its vertices have even degrees.
Graph definition
This leads us to the mathematical definition of a graph:
A graph G = (V, E) is a pair of:
- V, a set of nodes or vertices: the islands in our previous example
- E, a set of edges connecting nodes: the bridges
The Königsberg graph illustrated on the right of the preceding image can then be defined as follows:
V = [A, B, C, D]
E = [
      (A, C),
      (A, C),
      (C, B),
      (C, B),
      (A, D),
      (C, D),
      (B, D)
]
Graphs, like many mathematical objects, are well defined. While it can be difficult to find a good visualization for some of those objects, graphs, on the other hand, suffer from the almost infinite number of ways to draw them.
Visualization
Apart from very special cases, there is no single way to draw a graph and visualize it. Indeed, graphs are most often an abstract representation of reality. For instance, all four graphs depicted in the following image represent the exact same set of nodes and edges, so, by definition, the same mathematical graph:

We cannot rely only on our eyes to find patterns within graphs. For instance, looking only at the lower-right plot, it would be impossible to see the pattern that is visible in the upper-right plot. That's where graph algorithms enter into the game, which will be discussed in more detail in Chapter 6, Node Importance, and Chapter 7, Community Detection and Similarity Measures.
Examples of graphs
Now that we have a better idea of what a graph is, it's time to discover some more examples to understand which purposes graphs can be useful for.
Networks
With the graph definition in mind (a set of nodes connected to each other via edges) and the bridges example from the last section, we can easily imagine how all kinds of networks can be seen as graphs, including road networks, computer networks, or even social networks.
Road networks
Road networks are a perfect example of graphs. In such networks, the nodes are the road intersections, and edges are the roads themselves, as you can see in the following image:

This image shows the road network around Central Park in New York City, wherein streets are edges between junctions representing nodes
With road networks, many questions can be answered with graph analysis, such as the following:
- What is the shortest path between two points (nodes)?
- How long is this shortest path?
- Are there alternative routes?
- How can you visit all nodes within a list in a minimal amount of time?
This last question is especially important for parcel delivery, in order to minimize the number of driven miles to maximize the number of delivered parcels and satisfied customers.
We will go into more detail about this topic in Chapter 4, The Graph Data Science Library and Path Finding.
Computer networks
In a computer network, each computer/router is a node and the cables between them are the edges. The following image illustrates some possible topologies used for a computer network (credit: https://commons.wikimedia.org/wiki/File:NetworkTopologies.svg):
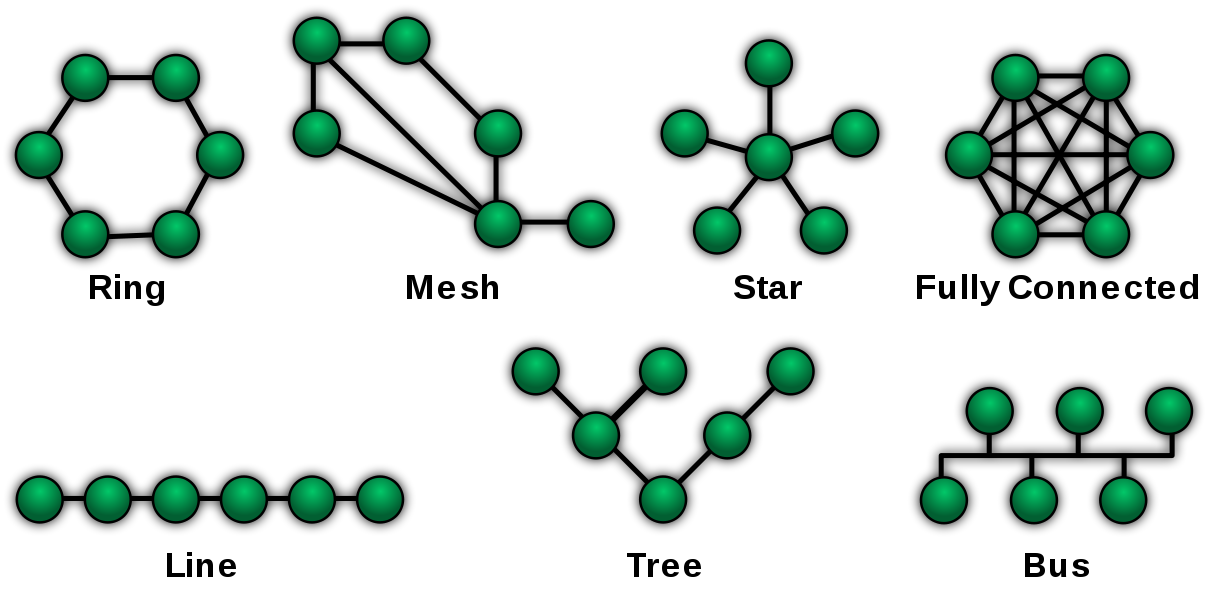
You can now draw the parallel with the graph definition we discovered in the last section. Here again, the graph structure helps in answering some common questions you may ask yourself about your network:
- How fast will this information be transferred from A to B? This sounds like a shortest path issue.
- Which of my nodes is the most critical one? By critical, we mean that if this node is not working for some reason, the whole network will be impacted. Not all nodes have the same impact on the network. That's where centrality algorithms come into the game (see Chapter 6, Node Importance).
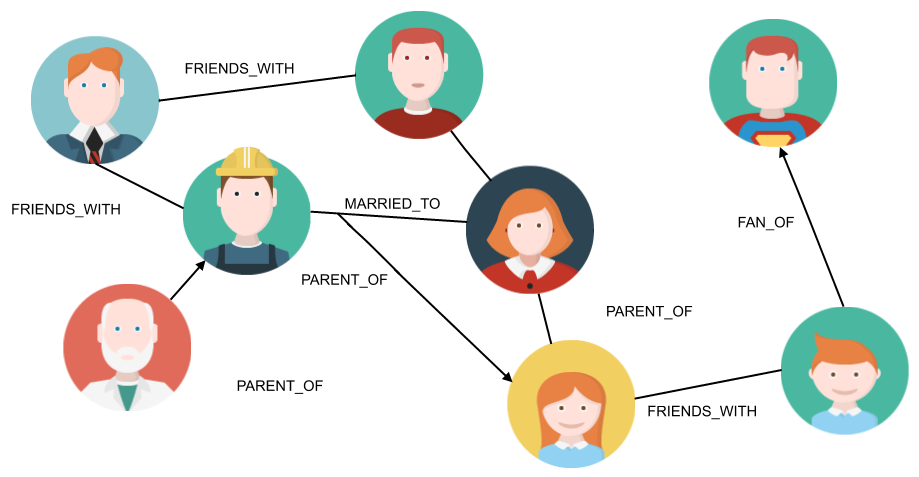
Social networks
Facebook, LinkedIn, and all of our favorite social networks use graphs to model their users and interactions. In the most basic example of a social graph, nodes represent people, and edges the friendship or professional relationship between them, as illustrated in the following image:
Here again, graphs allow us to see the data from a different perspective. For instance, we have seen this kind of information when looking at someone’s profile on LinkedIn:
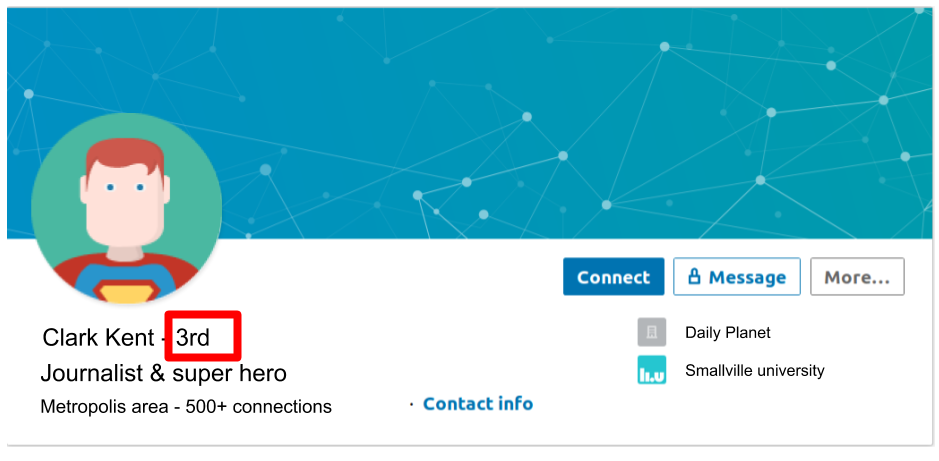
In that case, it tells us that the connected user (me) is just two connections away from Clark Kent. In other words, one person in my network is already connected to a person who is connected to Clark Kent. The following image illustrates this more clearly, in terms of degrees of separation:

You've probably heard about the Six Degrees of Separation theory. In 1929, the Hungarian journalist Frigyes Karinthy proposed a theory according to which each person on Earth is at most six connections away from any other person. In other words, if you want to talk to one person, say Barack Obama, a friend of yours has a friend whose friend has a friend... who knows Barack Obama and can introduce you to him. According to Karinthy, this connection chain must contain less than six connections, or seven people in total, including you and Barack Obama.
Given that there are more than 7 billion human beings on Earth, that's a surprisingly small number! With the large databases that are available nowadays, such as the friendship connections from Facebook or email exchanges from Microsoft, researchers have tried to prove the preceding statement. From the Microsoft email database, for instance, it was shown in 2008 that the average degree of separation between 180 billion distinct pairs of people was around 6.6. But this is just an average, and the number of hops to connect two people could go up to 29 with that dataset.
Many other kinds of analyses can be performed over social graphs:
- Node importance: Again, it might be very useful to have an idea of which nodes (persons) are the most important. However, the definition of importance here will be different than in the case of a computer network, since it is very unlikely that a single person's retirement from social media makes the whole world collapse. However, influencers have a particular interest for marketing experts.
- Community detection: Also called clustering, is a way to find a group of nodes sharing some characteristics. For instance, finding users who share the same interests, or visit the same places, can be used to recommend products to them.
- Link prediction: With a graph, you can think of creating intelligent models to predict whether two entities are likely to be connected in the future. Here again, recommendation engines are one possible application of such a tool.
As you can see, networks of all kinds are very well suited to graph databases. But we can go far beyond that view and imagine all kinds of data as a graph, which will open up a lot of new perspectives.
Your data is also a graph
You may have noticed that in the previous image of a social graph, the edges have names. Indeed, some people are friends, while some others have a father/son relationship. Now, let's imagine we can have any kind of relationship, meaning we can start connecting different kinds of entities. For instance, a person is living in a particular country, so (s)he is connected to that country with a relationship of type LIVES_IN. Are you beginning to see the point? With that kind of reasoning, the world itself is a graph and your business is a subpart of it.
Graphs are about relationships, and the world is connected, meaning there are relationships everywhere. We’ll talk about this in more detail in Chapter 3, Empowering Your Business with Pure Cypher, which is dedicated to knowledge graphs.
Graph databases allow you to model the data in that way: nodes, connected by relationships of some type. Let's see how to migrate data stored in relational databases to graph databases.
Moving from SQL to graph databases
Before going into detail about Neo4j, let's first have a look at the existing database models. We'll then focus on the most famous one, the relational model, and learn how to migrate from SQL to a graph database model.
Database models
Think about water: depending on the end goal, you will not use the same container. If you want to drink, you might use a glass of water but if you want to have a bath, you will probably choose another one. The choice of container will be different in each scenario. The problem is similar for data: without a proper container, there is nothing we can do with it and we need a proper container depending on the situation, which will not only store data but also contribute to solve the problem we have. This data container is the database.
Drawing an exhaustive list of database types on the market is not impossible but would go far beyond the scope of this book. However, I want to give some examples of the most popular ones, so that you can see where graph databases stand in the big picture:
- Relational databases: They are by far the most well known type of database. From SQLite to MySQL or PostgreSQL, they use a common query language, called Structured Query Language (SQL), with some variations among the different implementations. They are well established and allow a clear structure of the data. However, they suffer from performance issues when the data grows and are surprisingly not that good at managing complex relationships, since the relationships require many joins between tables.
- Document-oriented databases: Document-oriented databases, part of the NoSQL (Not Only SQL) era, have gained increasing interest during the last few years. Contrary to relational databases, they can manage flexible data models and are known for better scaling with a large amount of data. Examples of NoSQL databases include MongoDB and Cassandra, but you can find many more on the market.
- Key-value stores: Redis, RocksDB, and Amazon DynamoDB are examples of key-value databases. They are very simple and known to be very fast, but are not well suited to store complex data.
Here is how the different databases can be viewed in a figurative representation:
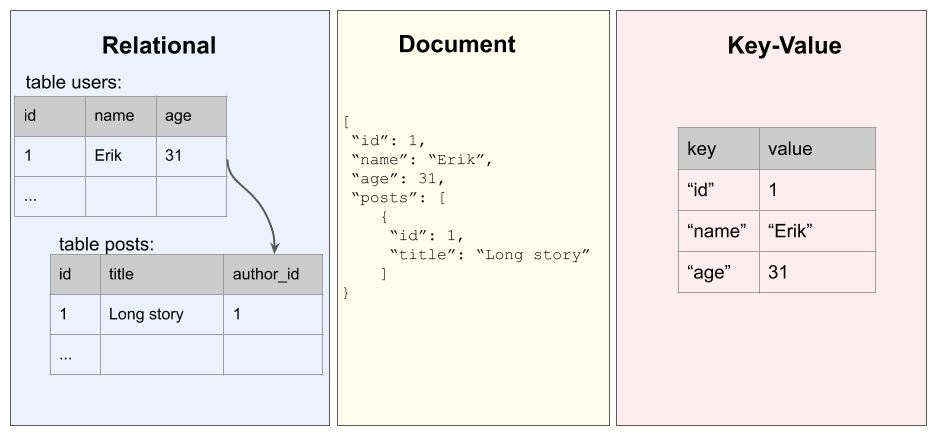
Graph databases try to bring the best of each world into a single place by being quite simple to use, flexible, and very performant when it comes to relationships.
SQL and joins
Let's briefly focus on relational databases. Imagine we want to create a Question and Answer website (similar to the invaluable Stack Overflow). The requirements are the following:
- Users should be able to log in.
- Once logged in, users can post questions.
- Users can post answers to existing questions.
- Questions need to have tags to better identify which question is relevant for which user.
As developers or data scientists, who are used to SQL, we would then naturally start thinking in terms of tables. Which table(s) should I create to store this data? Well, first we will look for entities that seem to be the core of the business. In this QA website, we can identify the following:
- Users, with attributes: ID, name, email, password
- Questions: ID, title, text
- Answers: ID, text
- Tags: ID, text
With those entities, we now need to create the relationships between them. To do so, we can use foreign keys. For instance, the question has been asked by a given user, so we can just add a new column to the question table, author_id, referencing the user table. The same applies for the answers: they are written by a given user, so we add an author_id column to the Answer table:
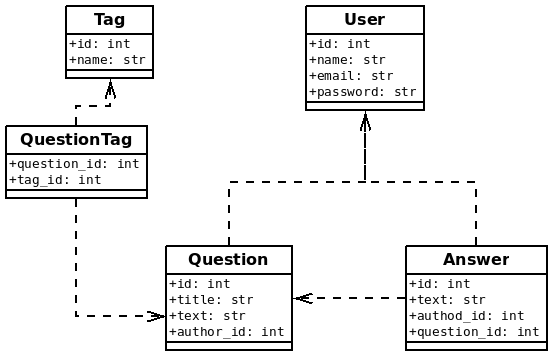
It becomes more complicated for tags, since one question can have multiple tags and a single tag can be assigned to many questions. We are in the many-to-many relationship type, which requires adding a join table, a table that is just there to remember that kind of relationship. This is the case of the QuestionTag table in the preceding diagram; it just holds the relationship between tags and questions.
It's all about relationships
The previous exercise probably looks easy to you, because you have followed lectures or tutorials about SQL and use it pretty often in your daily work. But let's be honest, the first time you face a problem and have to create the data model that will allow you to solve it, you will probably draw something that looks like the diagram in the following image, right?
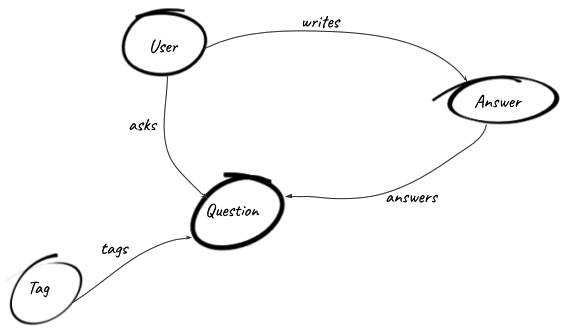
This is one of the powers of graph databases:
Neo4j, as a graph database, allows you to create vertices, or nodes, and the relationships connecting them. The next section summarizes how the different entities in the Neo4j ecosystem are related to each other and how we can structure our data in a graph.
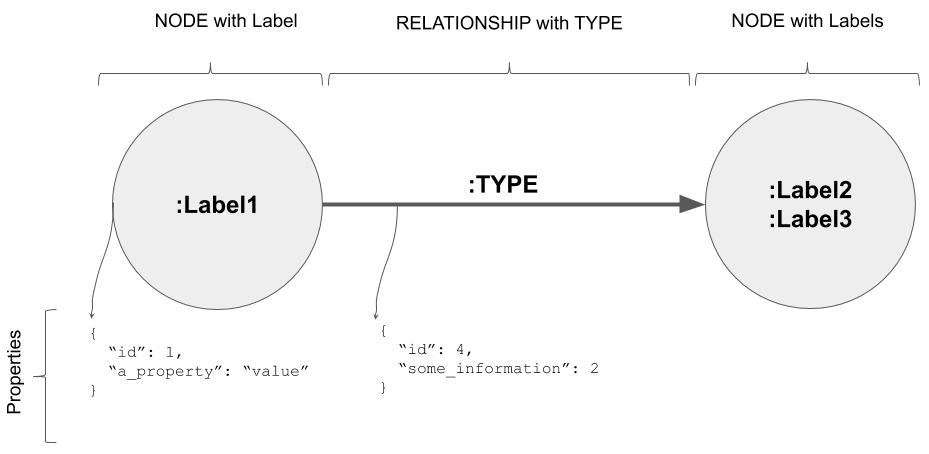
Neo4j – the nodes, relationships, and properties model
Neo4j is a Java-based highly scalable graph database whose code is publicly available on GitHub at github.com/neo4j/neo4j. This section describes its building blocks and its main cases, but also the cases where it won't perform well because no system is perfect.
Building blocks
As we discussed with graph theory, a graph database such as Neo4j is made of at least two essential building blocks:
- Nodes
- Relationships between nodes:
Let's look at each of of these in detail.
Nodes
In Neo4j, vertices are called nodes. Nodes can be of different types, like Question and Answer were in our former example. In order to differentiate those entities, nodes can have a label. If we continue the parallel with SQL, all nodes with a given label would be in the same table. But the analogy ends here, because nodes can have multiple labels. For instance, Clark Kent is a journalist, but he is also a superhero; the node representing this person can then have the two labels: Journalist and SuperHero.
Labels define the kind of entity the node belongs to. It is also important to store the characteristics of that entity. In Neo4j, this is done by attaching properties to nodes.
Relationships
Like nodes, relationships carry different pieces of information. A relationship between two persons can be of type MARRIED_TO or FRIEND_WITH or many other types of relationship. That's why Neo4j's relationships must have one and only one type.
One of the main powers of Neo4j is that relationships also have properties. For instance, when adding the relationship MARRIED_TO between two persons, we could add the wedding date, place, whether they signed a prenuptial agreement, and so on, as relationship properties.
Properties
Properties are saved as key-value pairs where the key is a string capturing the property name. Each value can then be of any of the following types:
- Number: Integer or Float
- Text: String
- Boolean: Boolean
- Time properties: Date, Time, DateTime, LocalTime, LocalDateTime, or Duration
- Spatial: Point
Internally, properties are saved as a LinkedList, each element containing a key-value pair. The node or relationship is then linked to the first element of its property list.
SQL to Neo4j translator
Here are a few guidelines to be able to easily go from your relational model to a graph model:
| SQL world | Neo4j world |
| Table | Node label |
| Row | Node |
| Column | Node property |
| Foreign key | Relationship |
| Join table | Relationship |
| NULL | Do not store null values inside properties; just omit the property |
Applying those guidelines to the SQL model in the question and answer table diagram, we built up the graph model displayed in the whiteboard model for our simple Q&A website, earlier in the chapter. The full graph model can be seen as follows:
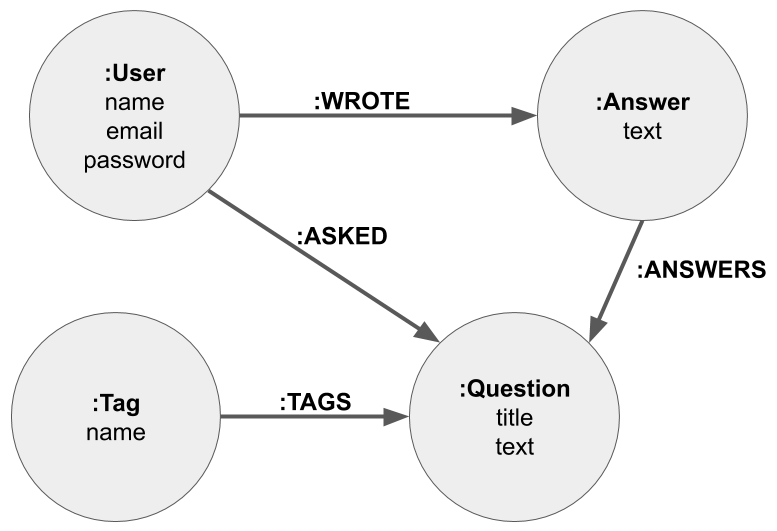
http://www.apcjones.com/arrows.
Neo4j use cases
Like any other tool, Neo4j is very good in some situations, but not well suited to others. The basic principle is that Neo4j provides amazing performance for graph traversal. Everything requiring jumping from one node to another is incredibly fast.
On the other hand, Neo4j is probably not the best tool if you want to do the following:
- Perform full DB scans, for instance, answering the question "What is?"
- Do full table aggregates
- Store large documents: the key-values properties list needs to be kept small (let's say no more than around 10 properties)
Some of those pain points can be addressed with a proper graph model. For instance, instead of saving all information as node properties, can we consider moving some of them to another node with a relationship between them? Depending on the kind of requests you are interested in, the graph schema most suited to your application may differ. Before going into the details of graph modeling, we need to stop briefly and and talk about the different kinds of graph properties which will also influence our choice.
Understanding graph properties
Graphs are classified into several categories, depending on the properties of the connections between nodes. These categories are important to consider when modeling your data as a graph, and even more so when you want to run algorithms on them, because the behavior of the algorithm might change and create unexpected results in some situations. Let's discover some of those properties with examples.
Directed versus undirected
So far, we've only talked about graphs as a set of connected nodes. Those connections can be different depending on whether you are going from node A to node B or vice versa. For instance, some streets can only be driven in one direction, right? Or, the fact that you are following someone on Twitter (there is a Follows relationship from you to that user) doesn’t mean that user is also following you. That’s the reason why some relationships are directed. On the contrary, a relationship of type married to is naturally undirected, if A is married to B, usually B is also married to A:

In the right-hand side graph, directed, the transition between B and A is not allowed in that direction
Weighted versus unweighted
As well as direction, relationships can also carry more information. Indeed, in a road network for instance, not all streets have the same importance in a routing system. They have different lengths or occupancy during peak hours, meaning the travel time will be very different from one street to another. The way to model this fact with graphs is to assign a weight to each edge:
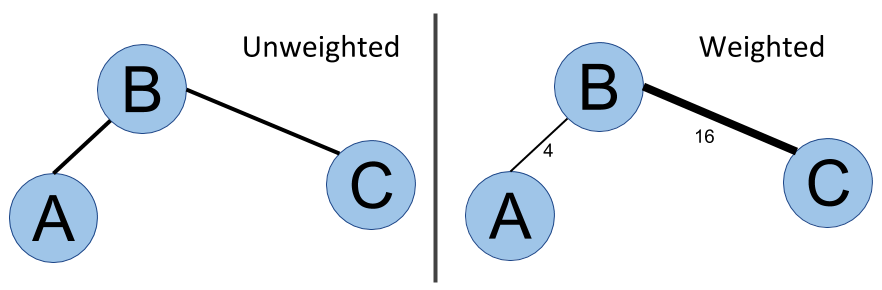
In the weighted graph, relationships have weights 16 and 4
Algorithms such as shortest path algorithms take this weight into account to compute a shortest weighted path.
This is not only important for road networks. In a computer network, the distance between units may also have its own importance in terms of connection speed. In social networks, distance is often not the most important property to quantify the strength of a relationship, but we can think of other metrics. For instance, how long have those two people been connected? Or when was the last time user A reacted to a post of user B?
Cyclic versus acyclic
A cycle is a loop. A graph is cyclic if you can find at least one path starting from one node and going back to that exact same node.
As you can imagine, it's important to be aware of the presence of cycles in a graph, since they can create infinite loops in a graph traversal algorithm, if we do not pay enough attention to it. The following image shows an acyclic graph versus a cyclic graph:

Dense versus sparse
Graph density is another property that is important to have in mind. It is related to the average number of connections for each node. In the next diagram, the left graph only has three connections for four nodes, whereas the right graph has six connections for the same amount of nodes, meaning the latter is denser than the former:

Graph traversal
But why worry about density? It is important to realize that everything within graph databases is about graph traversal, jumping from one node to another by following an edge. This can become very time-consuming with a very dense graph, especially when traversing the graph in a breadth-first way. The following image shows the graph traversals in which breadth-first search is compared to depth-first search:

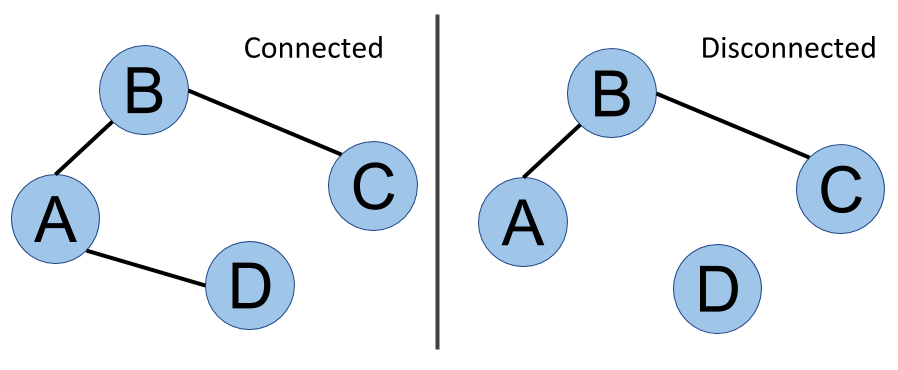
Connected versus disconnected
Last but not least is the notion of connectivity or a connected graph. In the next diagram, it is always possible to go from one vertex to another, whatever pair of vertices is considered. This graph is said to be connected. On the other side of the figure, you can see that D is isolated - there is no way to go from D to A, for example. This graph is disconnected, and we can even say that it has two components. We will cover the analysis of this kind of structure in Chapter 7, Community Detection and Similarity Measures. The following image shows connected versus disconnected graphs:
This is a non-exhaustive list of graph properties, but they are the main ones we will have to worry about within our graph database adventure. Some of them are important when creating the whiteboard graph model for our data, as we will discuss in the next section.
Considerations for graph modeling in Neo4j
The whiteboard model for our simple Q&A website is the very first approach to this problem. Depending on the kind of questions you want your application to answer, and in order to take full advantage of Neo4j, the schema can be very different.
Relationship orientation
As we discussed earlier in the chapter, relationships in Neo4j are oriented. However, with Cypher, we can build queries that are orientation-independent (see Chapter 2, The Cypher Query Language). In that scenario, a relationship that is imperatively bijective should not be stored twice in the database. In short, a friendship relationship should be created only in one direction, as illustrated in the following image:

Node or property?
Another question that arises quite often and early in the choice of graph model is whether a (categorical) characteristic should be stored as a node property, or whether it should have its own node.
Nodes are the following:
- Explicit: Nodes appear in the graph schema, which makes them more visible than properties.
- Performant: If we need to find nodes sharing the same characteristics, it will be much faster with a node than by filtering on properties.
On the other hand, properties are the following:
- Simpler: It's just a property with a value, not a complex node and relationship structure. If you don't need to perform special analysis on the property and just want it to be available when working on the node it belongs to, a property is just fine.
- Indexable: Neo4j supports indexing for properties. It is used to find the first node in a graph traversal and is very efficient (more details in Chapter 2, The Cypher Query Language).
As you can see, there is no universal answer to this question, and the solution will depend on your use case. It is usually recommended to list them and try to write and test the associated queries in order to make sure you are not falling into a Neo4j pitfall.
For more information and more examples on graph modeling, I encourage you to have a look at Neo4j Graph Data Modeling (see the Further reading section).
Summary
In this chapter, we discussed the mathematical definition of a graph and how it is related to graph databases. We then moved on to the specific instance of graph databases we will use throughout this book, Neo4j. We've learned about its building blocks, nodes having labels and properties, and relationships that must have a type and, optionally, some properties as well. We concluded with some important explanations about different types of graphs, weighted, directed, cyclic, or connected, and how this can help in defining the data model best suited to a given use case.
In the next chapter, we are going to look at Cypher, the query language used by Neo4j, and how we can feed the database and retrieve data from it.
Further reading
- If you want to learn more about the mathematics behind graph theory, you can start with Graph Theory with Applications, J.A. Bondy and U.S.R. Murty, Elsevier, whose first edition is available for free on the web, for instance at https://www.freetechbooks.com/graph-theory-with-applications-t559.
- For more information about choosing the appropriate schema for your graph data, see Neo4j Graph Data Modeling, M. Lal, Packt Publishing.
-
Some references to learn more about degrees of separation:
- Paper about the Microsoft study: Planetary-Scale Views on an Instant-Messaging Network by Jure Leskovec and Eric Horvitz
- Facebook research blog post: https://research.fb.com/blog/2016/02/three-and-a-half-degrees-of-separation/