


Using the SPFx developer dashboard and maintenance mode
When it comes to inspecting the context where the solutions are executed, SPFx provides handy tools you can use as a developer to help you in your debug session: the SPFx developer dashboard and maintenance mode.
Using the SPFx developer dashboard
The SPFx developer dashboard can be opened by pressing Ctrl + F12 on a page displaying console at the bottom of the page:
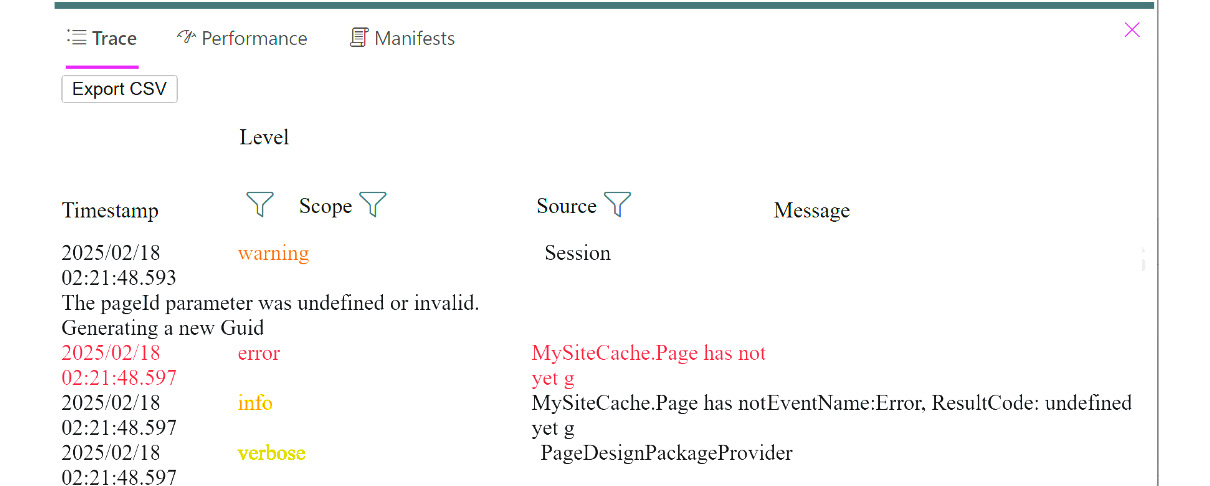
Figure 17.8 – SPFx developer dashboard
The dashboard provides a lot of information about the current execution context. It is composed of three tabs:
- Trace: Captures the logs emitted by all the components loaded on the page and categorized by severity (verbose, info, warning, error).
- Performance: Provides insights about page performance, such as load duration per component and per sequence (render, initialization, etc.).
- Manifests: Displays the list of components manifests currently loaded on the page. It...


