


Most likely, if you are reading this book, you have already used and installed Zabbix as a network monitoring solution. Now, in this chapter, we will see how to install Zabbix in a distributed setup, eventually moving on to a large use of proxies. The chapter will take you through all the possible scenarios and explain the main differences between the active and passive proxy setup. Usually, the first Zabbix installation is done as a part of the concept to see whether the platform is good enough for you. Here, the common error is to start using this setup on a large production environment. After reading this chapter, you will be ready to install and set up a large environment ready infrastructure.
In this chapter, we will explain how to prepare and set up a Zabbix installation, which is ready to be grown within your infrastructure, and ready for a large to a very large environment. This book is mainly focused on Zabbix for network monitoring. This chapter will quickly take you through the installation process, emphasizing on all the most important points you need to consider. In the next chapter, we will spend more time describing a better approach to monitor your network devices and how to retrieve all the critical metrics from them. After reading this chapter, you will become aware of the communication between server and proxies being able to mix the active and passive setup in order to improve your infrastructure. You can extend the strong central Zabbix core setup with many lightweight and effective Zabbix proxies acting as a satellite inside your network to improve your monitoring system.
Zabbix was born as a distributed network monitoring tool with a central web interface where you can manage almost everything. Nowadays, with Zabbix 2.4, the number of possible architectures has been reduced to a single server setup and a Zabbix-proxies distributed setup.
Note
From Zabbix 2.4, the node-setup was discontinued. More information is available at https://www.zabbix.com/documentation/2.4/manual/introduction/whatsnew240#node-based_distributed_monitoring_removed.
Now, the simplest architecture (which is ready to handle large environments successfully) that you can implement composes of three servers:
Web server
RDBMS server
Zabbix server
To prepare this simple setup for a large environment setting, it's better to use a dedicated server for each one of these components.
This is the simplest setup that can be easily extended and is ready to support a large environment.
The proposed architecture is shown in the following diagram:

This kind of setup can be extended by adding many Zabbix proxies resulting in a proxy-based setup. The proxy-based setup is implemented with one Zabbix server and several proxies: one proxy per branch, data center or, in our case, for each remote network segment you need to monitor.
This configuration is easy to maintain and offers the advantage to have a centralized monitoring solution. This kind of configuration is the right balance between large environment monitoring and complexity.

The Zabbix proxy, like a server, is used to collect data from any number of hosts or devices, acquiring all the metrics requested and acting as a proxy. This means that it can retain this data for an arbitrary period of time, relying on a dedicated database to do so. The proxy doesn't have a frontend and is managed directly from the central server.
Note
The proxy limits itself to data collection without trigger evaluations or actions; all the data is stored in its database. For this reason, it's better to use an efficient robust RDBMS that can prevent data loss in case of a crash.
All these characteristics make the Zabbix proxy a lightweight tool to deploy and offload some checks from the central server. Our objective is to control and streamline the flow of monitored data across networks, and the Zabbix proxy gives us the possibility to split and segregate items and data on the different networks. The most important feature is that the acquired metrics are stored in its database. Therefore, in case of a network loss, you will not lose them.
The standard Zabbix data flow is composed of several actors that send data to our Zabbix server. Of all the sources that can send data to our Zabbix server, we can identify three main data sources:
Zabbix agent
Zabbix sender
Other agents (external scripts or components built in house)
The other agents represented in the next diagram can be of two main types:
Custom and/or third-party agents
Zabbix proxy

As the diagram displays the data that gets acquired from many different sources in the form of items. At the end of the diagram, you see the GUI, which practically represents the users connected and the database that is the place where all the values are stored.
In the next section, we will dive deep into the Zabbix proxies' data flow.
Zabbix proxies can operate in two different modes, active and passive. The default setup is the active proxy. In this setup, the proxy initiates all connections to the Zabbix server, the one used to retrieve configuration information on monitored objects, and the connection to send measurements back to the server. Here, you can change and tweak the frequency of these two activities by setting the following variables in the proxy configuration file: /etc/zabbix/zabbix_proxy.conf:
ConfigFrequency=3600
DataSenderFrequency=1
Values are expressed in seconds. On the Zabbix server-side, you need to carefully set the value of StartTrappers=.
This value needs to be greater than the number of all active proxies and nodes you deployed. The trapper processes, indeed, manage all the incoming information from the proxies.
Note
Please note that the server will fork extra processes as required, if needed, but it is strongly advisable to prefork all the processes that are needed during the startup. This will reduce the overhead during the normal operation.
On the proxy side, another parameter to consider is:
HeartbeatFrequency
This parameter sets a sort of keep alive, which after the defined number of seconds, will contact the server although it doesn't have any data to send. The proxy availability can be easily checked with the following item:
zabbix[proxy, "proxy unique name", lastaccess]
Here the proxy unique name, of course, is the identifier you assigned to the proxy during deployment. The item will return the number of seconds as the last time that the proxy was contacted, a value you can then use with the appropriate triggering functions.
Tip
It's really important to have a trigger associated to this item, so you can be warned in case of connection loss. Looking at the trend of this trigger, you can learn about an eventual reaping time set on the firewall. Let's look at a practical example: if you notice that after 5 minutes your connections are dropped, set the heartbeat frequency to 120 seconds and check for the last access time above 300 seconds.
In the following diagram, you can see the communication flow between the Zabbix server and the proxy:
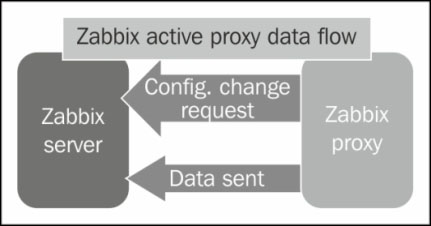
As you can see from the diagram, the server will wait to receive requests from the proxy and nothing more.
Note
The active proxy is the most efficient way to offload duties from the server. Indeed, the server will just sit here waiting to be asked about changes in configuration, or to receive new monitoring data.
On the other side, proxies are usually deployed to monitor secure network segments with strict outgoing traffic policies, and are usually installed on DMZs. In these kind of scenarios, normally, it is very difficult to obtain permission for the proxy to initiate the communication with the server. Unfortunately, it's not just due to policies. DMZs are isolated as much as possible from internal networks, as they need to be as secure as they can. Generally, it's often easier and more accepted from a security point of view to initiate a connection from the internal network to a DMZ. In this kind of scenario, the passive proxy is very helpful. The passive proxy is almost a mirrored image of the active proxy setup, as you can see in the following diagram:
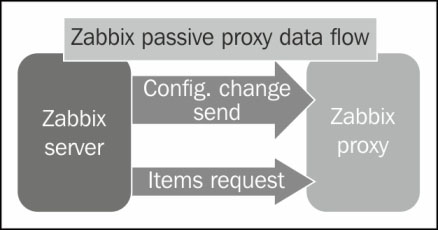
With this configuration, the Zabbix server will contact the proxy periodically to deliver the configuration changes and to request the item values the proxy is holding.
This is the proxy configuration to enable the proxy you need to set:
ProxyMode=1
This parameter specifies the passive proxy, you don't need to do anything else. Now, on the server side, you need to set the following parameters:
StartProxyPollers=This will set the number of processes dedicated to the passive proxies
ProxyConfigFrequency=This value expresses the frequency with which the server sends the configuration to its proxy
ProxyDataFrequency=This is the interval parameter that expresses the number of seconds between two consecutive requests to get the acquired metrics from the proxy
The item used to check a passive proxy's availability is as follows:
zabbix[proxy, "proxy unique name", lastaccess]
This is exactly the same as the active one.
The passive proxy enables us to gather monitoring data from otherwise closed and locked down networks with a slightly increased overhead.
Note
You can mix as many active and passive proxies as you want in your environment. This enables you to expand your monitoring solution to reach each part of the network and to handle a large number of monitored objects. This approach keeps the architecture simple and easy to manage with a strong central core and many simple, lightweight satellites.
If you would like to keep track of all the remaining items that the proxy needs to send, you can set up the proxy to run this query against its database:
SELECT ((SELECT MAX(proxy_history.id) FROM proxy_history)-nextid) FROM ids WHERE field_name='history_lastid'
Tip
Downloading the example code
You can download the example code files from your account at http://www.packtpub.com for all the Packt Publishing books you have purchased. If you purchased this book elsewhere, you can visit http://www.packtpub.com/support and register to have the files e-mailed directly to you.
This query will return the number of items that the proxy still needs to send to the Zabbix server. Considering that you are using MySQL as a database, you need to add the following user parameter in the proxy agent configuration file:
UserParameter=zabbix.proxy.items.sync.remaining, mysql -u <your dbname here> -p '<your password here>' -e 'SELECT ((SELECT MAX(proxy_history.id) FROM proxy_history)-nextid) FROM ids WHERE field_name=history_lastid' 2>&1
Now, all you need to do is set an item on the Zabbix server side and you can see how your proxy is freeing its queue.
Zabbix, like all the other software, can be installed in two ways:
Download the latest source code and compile it.
Install it from packages.
Actually, there is another way to have a Zabbix server up and running: using the virtual appliance. The Zabbix server appliance will not be considered in this book as Zabbix itself defines this virtual appliance as not ready for productive environments. This virtual appliance is not a production ready setup for many reasons:
It is a monolith where everything is installed on the same server.
There is no separation from the database layer and the presentation layer. This means that each one of these components can affect the performance of the other.
There is a clear warning on the website that warns us with this statement: The Appliance is not intended for serious production use at this time.
On the other hand, the installation from packages gives us some benefits:
The packages make it easy to upgrade and update
Dependencies are automatically sorted out
The source code compilation also gives us some benefits:
We can compile only the needed features
We can build the agent statically and deploy on different Linux flavors
Complete control on update
It's quite usual to have different versions of Linux, Unix, and Microsoft Windows on a large environment. This kind of scenario is quite diffused on a heterogeneous infrastructure, and if we use the Zabbix's agent distribution package on each Linux server, we will have different versions of the agent for sure, and different locations for the configuration files.
The more the things are standardized across our server, the easier it will become to maintain and upgrade the infrastructure. The --enable-static option gives us a way to standardize the agent across different Linux versions and release, which is a strong benefit. The agent, statically compiled, can be easily deployed everywhere and, for sure, we will have the same location (and we can use the same configuration file apart from the node name) for the agent and his/her configuration file. The only thing that might vary is the start/stop script and how to register it on the right init runlevel, but at least the deployment will be standardized.
The same kind of concept can be applied to the commercial Unix, bearing in mind to compile it on the target environment so that the same agent can be deployed on different Unix releases of the same vendor.
The first thing to do to install Zabbix from repo is to add the yum repository to our list. This can be done with the following command:
$ rpm -Uvh http://repo.zabbix.com/zabbix/2.4/rhel/6/x86_64/zabbix-release-2.4-1.el6.noarch.rpm
Retrieving http://repo.zabbix.com/zabbix/2.4/rhel/6/x86_64/zabbix-release-2.4-1.el6.noarch.rpm
warning: /var/tmp/rpm-tmp.dsDB6k: Header V4 DSA/SHA1 Signature, key ID 79ea5ed4: NOKEY
Preparing…         ########################################### [100%]
1:zabbix-release   ########################################### [100%]
Once this is done, we can take advantage of all the benefits introduced by the package manager and have the dependencies automatically resolved by yum.
To install the Zabbix server, you simply need to run:
$ yum install zabbix-server-mysql zabbix-agent zabbix-javagateway
Now, you have your server ready to start. We can't start it now as we need to set up the database, which will be done in the next heading, anyway, what you can do is set up the start/stop runlevel for our zabbix_server and zabbix_agent daemons:
$ chkconfig --level 345 zabbix-server on
$ chkconfig --level 345 zabbix-agent on
Please double check if the previous command ran successfully with the following:
$ chkconfig --list | grep zabbix
zabbix-agent    0:off   1:off   2:off   3:on     4:on   5:on   6:off
zabbix-server   0:off   1:off   2:off   3:on   4:on   5:on   6:off
Now, as usually happens in a large server farm, it is possible that you have many different variants of Linux. Here, if you can't find the package for your distribution, you can even think to compile the agent from scratch. The following are the steps for the same:
Download the source code from the Zabbix website.
Unpack the software.
Satisfy all the software dependencies, installing all the related
-develpackages.Run the following command:
$ ./configure --enable-agent.
Compile everything with $ make.
Now, before you run $ make install, you can decide to create your own package to distribute with CheckInstall.
The advice is to not run make install, but use CheckInstall to produce the required package for your Linux OS from http://asic-linux.com.mx/~izto/checkinstall/.
Note
We can also use a prebuilt CheckInstall; the current release is checkinstall-1.6.2-20.2.i686.rpm on Red Hat / CentOS. The package will also need the rpm-build package:
rpm-build yum install
Also, we need to create the necessary directories:
mkdir -p ~/rpmbuild/{BUILD,RPMS,SOURCES,SPECS,SRPMS}This software enables you to create a package for many different versions of the package manager, namely, RPM, deb, and tgz.
Note
CheckInstall will produce packages for Debian, Slackware, and Red Hat, helping us to prepare the Zabbix's agent package (statically linked) and distribute it around our server.
Now, we need to switch to the root account using $ sudo su – . Also, use the checkinstall followed by these options:
$ checkinstall --nodoc --install=yes -y
If you don't face any issue, you should get the following message:
******************************************************************
 Done. The new package has been saved to
 /root/rpmbuild/RPMS/i386/zabbix-2.4.0-1.i386.rpm
 You can install it in your system anytime using:
      rpm -i zabbix-2*.4.0-1.i386.rpm
******************************************************************
Remember that the server binaries will be installed in <prefix>/sbin, utilities will be in <prefix>/bin, and the main pages under the <prefix>/share location.
For the server configuration, we only have one file to check and edit:
/etc/zabbix/zabbix_server.conf
All the configuration files are contained in the following directory:
/etc/zabbix/
All you need to change for the initial setup is the /etc/zabbix/zabbix_server.conf configuration file and write the username/password and database name here.
Note
Please take care to protect the access to the configuration file with chmod 400 /etc/zabbix/zabbix_server.conf.
The default external scripts location is:
/usr/lib/zabbix/externalscripts
Also, the alert script directory is:
/usr/lib/zabbix/alertscripts
This can be changed by editing the zabbix_server.conf file.
The configuration on the agent side is quite easy; basically, we need to write the IP address of our Zabbix server.
The database we will use on this book, as already explained, is MySQL.
Now, considering that you have a Red Hat server, the procedure to install MySQL from the RPM repository is quite easy:
$ yum install mysql mysql-server
Now, you need to set up the MySQL service to start automatically when the system boots:
$ chkconfig --levels 235 mysqld on
$ /etc/init.d/mysqld start
To set a password for the root, you can run these two commands:
/usr/bin/mysqladmin -u root password 'new-password'
/usr/bin/mysqladmin -u root -h hostname-of-your.zabbix.db password 'new-password'
Alternatively, you can run:
/usr/bin/mysql_secure_installation
This will also help you to remove the test databases and anonymous user data that was created by default. This is strongly recommended for production servers.
Now, it's time to create the Zabbix database. For this, we can use the following commands:
$ mysql -u root -p
$ mysql> CREATE DATABASE zabbix CHARACTER SET UTF8;
Query OK, 1 row affected (0.00 sec)
$ mysql> GRANT ALL PRIVILEGES on zabbix.* to 'zabbixuser'@'localhost' IDENTIFIED BY 'zabbixpassword';
Query OK, 0 rows affected (0.00 sec)
$ mysql> FLUSH PRIVILEGES;
$ mysql> quit
Next, we need to restore the default Zabbix MySQL database files:
$ mysql -u zabbixuser -pzabbixpassword zabbix< /usr/share/doc/zabbix-server-mysql-2.4.0/create/schema.sql
$ mysql -u zabbixuser -pzabbixpassword zabbix < /usr/share/doc/zabbix-server-mysql-2.4.0/create/images.sql
$ mysql -u zabbixuser -pzabbixpassword zabbix < /usr/share/doc/zabbix-server-mysql-2.4.0/create/data.sql
Now, our database is ready. Before we begin to play with the database, it's important to do some consideration about database size and heavy tasks against it.
Zabbix uses two main groups of tables to store its data:
History
Trends
Now, the space consumed by these tables is influenced by:
The space used to store data can vary due to the database, but we can resume the space used by these tables in the following table:
|
Type of measure |
Retention in days |
Space required |
|---|---|---|
|
History |
30 |
10.8 G |
|
Events |
1825 (5 years) |
15.7 GB |
|
Trends |
1825 (5 years) |
26.7 GB |
|
Total |
NA |
53.2 GB |
This calculation is, of course, done considering the environment after 5 years of retention. Anyway, we need to have an environment ready to survive this period of time and retain the same shape that it had when it was installed. We can easily change the history and trends retention policy per item. This means that we can create a template with items that have a different history retention by default. Normally, the history is set to 30 days, but for some kind of measure (such as in web scenarios) or other particular measures, we need to keep all the values for more than a week. This permits us to change this value on each item.
Now that we are aware of how big our database will be, it's easy to imagine that housekeeping will be a heavy task and the time, CPU, and resource consumed by this one will grow together with the database size.
Housekeeping is in charge to remove the outdated metrics from the database and the information deleted by a user, and as we've seen the history, trends, and events tables are, after some time, huge tables. This explains why the process is so heavy to manage.
The only way we can improve performances once we have reached this volume of data is by using partitioning and disabling the housekeeper altogether.
Partitioning the history and trend tables will provide us with many major benefits:
All history data in a table for a particular defined window time are self-contained in its own partition. This allows you to easily delete old data without impacting the database performance.
When you use MySQL with InnoDB, and if you delete data contained in a table, the space is not released. The space freed is marked as free, but the disk space consumed will not change. When you use partition, and if you drop a partition, the space is immediately freed.
Query performance can be improved dramatically in some situations, in particular, when there is heavy access to the table's rows in a single partition.
When a query updates a huge amount of data or needs access to a large percentage of the partition, the sequential scan is often more efficient than the index usage with a random access or scattered reads against this index.
Unfortunately, Zabbix is not able to manage the partitions. So, we need to disable housekeeping, and use an external process to accomplish housekeeping.
What we need to have is a stored procedure that does all the work for us.
The following is the stored procedure:
DELIMITER $$
CREATE PROCEDURE `partition_maintenance`(SCHEMA_NAME VARCHAR(32), TABLE_NAME VARCHAR(32), KEEP_DATA_DAYS INT, HOURLY_INTERVAL INT, CREATE_NEXT_INTERVALS INT)
BEGIN
  DECLARE OLDER_THAN_PARTITION_DATE VARCHAR(16);
  DECLARE PARTITION_NAME VARCHAR(16);
  DECLARE LESS_THAN_TIMESTAMP INT;
  DECLARE CUR_TIME INT;
Until here, we have declared the variable we need after. Now, on the next line, we will call the stored procedure responsible to check whether a partition is already present and if not, we will create them:
        CALL partition_verify(SCHEMA_NAME, TABLE_NAME, HOURLY_INTERVAL);
        SET CUR_TIME = UNIX_TIMESTAMP(DATE_FORMAT(NOW(), '%Y-%m-%d 00:00:00'));
        IF DATE(NOW()) = '2014-04-01' THEN
          SET CUR_TIME = UNIX_TIMESTAMP(DATE_FORMAT(DATE_ADD(NOW(), INTERVAL 1 DAY), '%Y-%m-%d 00:00:00'));
        END IF;
        SET @__interval = 1;
        create_loop: LOOP
          IF @__interval > CREATE_NEXT_INTERVALS THEN
            LEAVE create_loop;
          END IF;
        SET LESS_THAN_TIMESTAMP = CUR_TIME + (HOURLY_INTERVAL * @__interval * 3600);
        SET PARTITION_NAME = FROM_UNIXTIME(CUR_TIME + HOURLY_INTERVAL * (@__interval - 1) * 3600, 'p%Y%m%d%H00');
Now that we have calculated all the parameters needed by the create_partition procedure, we can run it. This stored procedure will create the new partition on the defined schema:
                CALL partition_create(SCHEMA_NAME, TABLE_NAME, PARTITION_NAME, LESS_THAN_TIMESTAMP);
                SET @__interval=@__interval+1;
        END LOOP;
        SET OLDER_THAN_PARTITION_DATE=DATE_FORMAT(DATE_SUB(NOW(), INTERVAL KEEP_DATA_DAYS DAY), '%Y%m%d0000');
The section that follows is responsible to remove the older partitions, using the OLDER_TAN_PARTITION_DATE procedure, which we have calculated on the lines before:
        CALL partition_drop(SCHEMA_NAME, TABLE_NAME, OLDER_THAN_PARTITION_DATE);
END$$
DELIMITER ;
This stored procedure will be the core of our housekeeping. It will be called with the following syntax:
CALL partition_maintenance('<zabbix_db_name>', '<table_name>', <days_to_keep_data>, <hourly_interval>, <num_future_intervals_to_create>)The procedure works based on 1 hour intervals. Next, if you want to partition on a daily basis, the interval will be 24 hours. Instead, if you want 1 hour partitioning, the interval will be 1.
You need to specify the number of intervals that you want created in advance. For example, if you want 2 weeks interval of future partitions, use 14. If your interval is 1 (for hourly partitioning), then the number of intervals to create is 336 (24*14).
This stored procedure uses some other stores procedures:
partition_create: This creates the partition for the specified tablepartition_verify: This checks whether the partition is enabled on a table, if not, then create a single partitionpartition_drop: This drops partitions older than a timestamp
For all the details about these stored procedures, see Appendix A, Partitioning the Zabbix Database.
Once you've created all the required stored procedures, you need to change two indexes to enable them in order to be ready for a partitioned table:
mysql> Alter table history_text drop primary key, add index (id), drop index history_text_2, add index history_text_2 (itemid, id);
Query OK, 0 rows affected (0.49 sec)
Records: 0  Duplicates: 0  Warnings: 0

mysql> Alter table history_log drop primary key, add index (id), drop index history_log_2, add index history_log_2 (itemid, id);
Query OK, 0 rows affected (2.71 sec)
Records: 0  Duplicates: 0  Warnings: 0
Once this is done, you need to schedule the partition_maintenance_all stored procedure with a cron job. For more details about the partition_maintenance_all procedure, please check the instructions contained in Appendix A, Partitioning the Zabbix Database. The cron job needs to execute the following command:
mysql -h <zabbix_db_host> -u<zabbixuser> -p<zabbixpassword> zabbixdatabase -e "CALL partition_maintenance_all('zabbix');"
Once this has been set, you need to bear in mind to disable the housekeeping for history and trends. Verify that the Override item <trend/history> period Zabbix configuration is checked for both history and trends. Here, you need to set the Data storage period (in days) box for history and trends to the value you've defined in your procedure, our example in Appendix A, Partitioning the Zabbix Database is of 28 and 730.
Installation of the Zabbix proxy from packages is a quite simple task. Once you've added the Zabbix repository, you only need to run the following command:
$ yum install zabbix-proxy-mysql
This will install the required packages:
Installation:
 zabbix-proxy-mysql  x86_64  2.4.0-1.el6  zabbix  390 k
Installing for dependencies:
zabbix-proxy  x86_64  2.4.0-1.el6  zabbix  21 k
The Zabbix proxy installation is quite similar to the server one. Once you've installed the server, you need to install MySQL, create the database, and import the DB schema:
$ mysql -u root -p
$ mysql> CREATE DATABASE zabbix CHARACTER SET UTF8;
Query OK, 1 row affected (0.00 sec)
$ mysql> GRANT ALL PRIVILEGES on zabbix.* to 'zabbixuser'@'localhost' IDENTIFIED BY 'zabbixpassword';
Query OK, 0 rows affected (0.00 sec)
$ mysql> FLUSH PRIVILEGES;
$ mysql> quit
Next, we need to restore the default Zabbix MySQL database files:
$ mysql -u zabbixuser -pzabbixpassword zabbix < /usr/share/doc/zabbix-proxy-mysql-2.4.0/create/schema.sql
Now, we need to start the database, configure the proxy, and start the service. In this example, we have considered to use a Zabbix proxy that relies on a MySQL with InnoDB database. This proxy can be performed in two different ways:
Lightweight (and then use SQLite3)
Robust and solid (and then use MySQL)
Here, we have chosen the second option. In a large network environment where the proxy, in case of issue, needs to preserve all the metrics acquired until the server acquires the metrics, it's better to reduce, at the minimum, the risk of data loss. Also, if you consider this scenario in a large network environment, you most likely will have thousands of subnetworks connected to the Zabbix server with all the possible network devices in-between. Well, exactly, this is necessary to use a database that can prevent any data corruptions.
The WebGUI interface will be done once more using the RPMs.
To install the web interface, you need to run the following command:
$ yum install zabbix-web-mysql
Yum will take care to resolve all the dependencies. Once you're done, the process of this component is quite easy: we need to open a web browser, point at the following URL: http://your-web-server/zabbix, and follow the instructions.
On the standard Red Hat system, you simply need to change these parameters on your /etc/php.ini file:
php_value max_execution_time 300
php_value memory_limit 128M
php_value post_max_size 16M
php_value upload_max_filesize 2M
php_value max_input_time 300
Also, set your time zone on the same file (for example, php_value date.timezone Europe/Rome).
Now, it's time to start up Apache, but before this, we need to check whether we have SELinux enabled and on which mode? To check your SELinux status, you can run:
# sestatus
SELinux status:                 enabled
SELinuxfs mount:                /selinux
Current mode:                   permissive
Mode from config file:          permissive
Policy version:                 24
Policy from config file:        targeted
Now, you need to check whether you have the httpd daemon enabled to use the network with the following command:
# getsebool httpd_can_network_connect
httpd_can_network_connect --> off
Most likely, you will have the same kind of result, then all we need to do is enable the httpd_can_network_connect option using the next command with –P to preserve the value after a reboot:
# setsebool –P httpd_can_network_connect on
# getsebool httpd_can_network_connect
httpd_can_network_connect --> on
Now, all that we still have to do is enable the httpd daemon and start our httpd server:
# service httpd start
Starting httpd:                              [  OK  ]
Next, enable the httpd server as a service:
# chkconfig httpd on
We can check the change done with the next command:
# chkconfig --list httpd
httpd       0:off   1:off   2:on    3:on    4:on    5:on    6:off
Once you've done this, you only need to follow the wizard, and in a few clicks, you will have your web interface ready to start up.
Tip
If you know that the load against the web server will be high, due to a high number of accounts that will access it, probably, it's better to consider using Nginx.
Now, you can finally start your Zabbix server and the first entry in the /var/log/zabbix/zabbix_server.log file will look something like the following code:
37909:20140925:091128.868 Starting Zabbix Server. Zabbix 2.4.0 (revision 48953).
37909:20140925:091128.868 ****** Enabled features ******
 37909:20140925:091128.868 SNMP monitoring:           YES
 37909:20140925:091128.868 IPMI monitoring:           YES
 37909:20140925:091128.868 WEB monitoring:            YES
 37909:20140925:091128.868 VMware monitoring:         YES
 37909:20140925:091128.868 Jabber notifications:      YES
 37909:20140925:091128.868 Ez Texting notifications:  YES
 37909:20140925:091128.868 ODBC:                      YES
 37909:20140925:091128.868 SSH2 support:              YES
 37909:20140925:091128.868 IPv6 support:              YES
 37909:20140925:091128.868 ****************************** 37909:20140925:091128.868 using configuration file: /etc/zabbix/zabbix_server.conf******************************
Next, you can start to implement and acquire all the items critical for your network.
In this chapter, we covered a large number of components. We started with defining what a large environment is. We also saw how the network setup can be designed and how it can evolve within your infrastructure. We saw the heaviest task on the server side (housekeeping) and how to avoid performance degradation due to this. We discussed MySQL partitioning in-depth. We also briefly discussed the differences between active and passive proxies; you will now be able to decide how to set them up and which one to choose once you know your network topology. Also, we saw how to acquire some critical metrics to monitor the Zabbix proxy connection and the amount of items that it still needs to send us.
As you can see, we covered a lot of arguments in just one chapter; we did this because we would like to use more space in the upcoming chapters. In the next chapter, we will explore the different appliances and protocols at layer 2 and layer 3 of the ISO/OSI stack. Also, you will see how to best extrapolate meaningful monitoring data from the collected measure for the protocol layers 2 and 3.