


 Download code from GitHub
Chapter 1: Analysis Services in SQL Server 2019
As you prepare to build your analytic models in SQL Server, you need to understand the basics about SQL Server Analysis Services (SSAS) including the purpose of the overall platform, with a basic understanding of the product. We will be exploring the origin of SSAS and its evolution into what we use today.
Upon completion of this chapter, you should understand where SSAS fits into the overall data analytics ecosystem. In this chapter, we're going to answer the following key questions about Analysis Services:
- What is SQL Server Analysis Services anyway?
- Why use SQL Server Analysis Services?
- What's new in SQL Server Analysis Services 2019?
- What are the tools used with SQL Server Analysis Services?
- One last thing – our sample data
In preparation for the rest of the book, the final section of the chapter discusses the tools we use. We will provide links and instructions for the installation procedures to prepare for the various examples and development used throughout the book. We will also walk through the restoration of the SQL Server database used to support our Analysis Services examples in later chapters.
What is SQL Server Analysis Services anyway?
SSAS is distributed as part of the SQL Server stack of tools. This stack has included a variety of tools over the years:
- SQL Server Management Studio
- Data Transformation Services
- SQL Server Integration Services
- SQL Server Reporting Services
- Data Quality Services
- Master Data Services
- Data Virtualization with PolyBase
- Big Data Clusters
Some of these options have been part of SQL Server for years, such as Integration Services, but some are brand new to SQL Server 2019, such as Big Data Clusters. Analysis Services has been in the product line for a long time, having been added in 1998.
SQL Server Analysis Services is not SQL Server
This statement may seem odd, but it is important to understand the place that Analysis Services has in the SQL Server stack and related Microsoft Business Intelligence (MSBI) ecosystem. As the list earlier in the chapter calls out, Analysis Services and many other products have been included in the purchase of SQL Server but are not a relational database management system (RDBMS).
The only component of SQL Server that has no official title is the relational data engine. It is simply referred to as SQL Server. SQL Server directly refers to the capability to store data in tables and use Transact-SQL or TSQL to interact with the data. Relationships, indexes, views, and stored procedures can be used in this engine and are commonly used for transactional systems and data warehouse solutions.
Analysis Services is designed to optimize data for analysis and reporting. Relational systems specialize in managing large amounts of transactions with good performance. Analytic solutions such as Analysis Services are designed to aggregate and query large amounts of data efficiently. While design methodologies such as star schemas are designed to optimize relational systems for analytic workloads, these schemas still require significant optimization within relational systems to match the performance of analytic solutions.
Relational versus analytic workloads
Relational workloads are typically normalized in relational database systems. Normalization involves using a lot of related tables to keep the data changes to a minimum. They are optimized to load data. Analytic workloads are denormalized using large flat tables with minimal relationships. This keeps the work of reading the data to a minimum.
The key takeaway here is that SQL Server refers to the relational database engine. Analysis Services is a separate data storage solution that is optimized for analytic and reporting workloads.
SQL Server Analysis Services through the years
SSAS has a long and interesting history. Personally, I started working with Analysis Services with its first release in 1998. Microsoft did not reinvent the wheel; they acquired another company to accelerate their introduction into analytic server tools or Online Analytical Processing (OLAP) servers. They started the process in 1996 and acquired Panorama Software's development team to begin the development of their new OLAP server product called OLAP Services 7.0, which was shipped with SQL Server 7.0 in 1998.
OLAP Services was a multidimensional database solution. Microsoft rebranded this to Analysis Services with its SQL Server 2000 release. They made significant changes to the multidimensional server and supporting technology in the 2005, 2008, and 2012 releases. The multidimensional server was designed to work with large-scale data on spinning disks. As hardware continued to improve, optimizations for the platform changed and we saw the shift to more memory-optimized solutions.
Enter Power Pivot with SQL Server 2008 R2 and Excel 2010. This is a significant turning point in the Analysis Services story. The Vertipaq compression engine was introduced to the MSBI set of offerings. While technically a part of SSAS, Power Pivot was released to Excel first. This columnar-based in-memory solution laid the groundwork for tabular models in Analysis Services, which is now the preferred option for working with Analysis Services.
Check out the following timeline. It illustrates the key points in the history of Analysis Services and related technologies:

Figure 1.1 – Over 20 years of Microsoft Analysis Services history
Microsoft has focused most of its attention on the tabular model technology in the most recent releases of Analysis Services. This technology is the heart of the Power BI products and is the only model type supported as a native Azure technology.
We will walk through the value of both types of models in Chapter 2, Choosing the SQL Server 2019 Analytic Model for Your BI Needs. Let's take a step back and look at why you would consider using Analysis Services to support your workloads today.
Why use SQL Server Analysis Services?
Now that you understand where Analysis Services fits into the SQL Server stack and the Microsoft BI ecosystem, why would you choose to use Analysis Services? Traditionally, Analysis Services was the best option to organize data for easy and performant analysis of data at scale. I have used Analysis Services to optimize data warehouses built on a variety of relational technologies including Microsoft SQL Server and Oracle. Analysis Services is source agnostic. If you can connect to the source, you have a use case for Analysis Services if you want more efficient analytics and reporting.
Optimized for reporting and analytics
This is the primary reason OLAP servers were introduced to the market. Earlier, we called out relational solutions and their optimization for efficient transaction handling. However, many of the optimizations for transaction handling conflict with reporting needs. One key example is the complexity of a relational solution.
The following diagram shows the complexity of relational design. The number of tables and joins required for reporting and analytics hinders the performance of report writers and queries:

Figure 1.2 – Relational diagram of the Wide World Importers sales schema
As you can see in the preceding diagram, relational models make heavy use of foreign keys and related tables. Ralph Kimball introduced dimensional modeling and the star schema concepts to help optimize read techniques with relational systems. This resulted in simpler, flatter (denormalized) schemas such as the following diagram, which is the best design to support multidimensional model design:

Figure 1.3 – Star schema diagram for Wide World Importers sales facts
While the star schema and dimensional models improved the ability of relational systems to extract reporting data, they were still bound to relational rules and languages. OLAP servers were introduced to further optimize the data for end user consumption. This resulted in even simpler, user-friendly options. The following example shows a pivot table in Excel that is directly connected to an Analysis Services model. This makes the data accessible and easy for users to analyze and create reports without deep technical skills:

Figure 1.4 – Excel pivot table connected to an Analysis Services model
Let's see the relation of Analysis Services with Excel.
Works great with Excel
This leads to one of the primary reasons that Analysis Services has become a beloved delivery platform for users and IT organizations. Once data is delivered in Analysis Services, it can be easily consumed by Excel. When a user connects to an Analysis Services model, they are able to interact with the data and build what they need from the underlying database without coming back to IT for additional support.
Organized with end users in mind
The other reason that has to be considered is that the data is organized to support the business, not database or code efficiencies. Well-designed OLAP solutions use business-friendly names for the data. OLAP solutions typically hide system fields as well making sure the data in the OLAP database is relevant.
Here is a list of key user-friendly features in OLAP databases:
- Proper spelling and grammar, using spaces, capitalization, and punctuation.
- Hidden system values such as primary keys, surrogate keys, and system names.
- Relationships built in so the user does not have to determine how the data is related; it is related in the model itself.
- Pre-existing common calculations such as totals or averages, which respond correctly to filtering or slicing.
The following table shows how reporting queries becomes simpler as the database engine and structure is more focused on an aggregated and report-friendly structure:

Figure 1.5 – How reporting queries becomes simpler
Each of these queries returns the same results:
Total Sales	Total Profit	Buying Group
73037043.78	31660852.75	      N/A
62654262.56	27125589.10	      Tailspin Toys
62352133.11	26942739.05	      Wingtip Toys
As you can see, making data more consumable for users is one of the key reasons to use Analysis Services. When considered in combination with OLAP-friendly tools such as Excel, Power BI, and Tableau, the use of OLAP servers is even more compelling.
What's new in SQL Server Analysis Services 2019?
The focus of this book is on using SSAS 2019. What has Microsoft added to the product in its most recent release? Because Analysis Services is effectively broken into two types of databases – multidimensional and tabular – we will talk about the changes to each separately.
Multidimensional models in 2019
This is the short list. Microsoft has not made significant changes to multidimensional capabilities in Analysis Services since the SQL Server 2012 release. Even that release focused on the new xVelocity In-Memory Analytics Engine (aka Vertipaq) that would support tabular models. Microsoft considers the multidimensional model in Analysis Services mature and is not adding major features at this point. The focus is on bug fixes and various performance enhancements to the engine. The key takeaway here is that multidimensional models still have a place but are not receiving any significant updates. The following is from Microsoft's documentation:
Source
Tabular models in 2019
While multidimensional models are considered mature, Microsoft is continuing to make significant investments in tabular model technology. Since its release in 2012 until now, major changes have happened with tabular models.
Compatibility levels
When working with tabular models, you need to understand compatibility levels. Microsoft introduced compatibility levels to allow new versions of Analysis Services to be backward compatible while enabling significant changes to supported features. When creating a tabular model, it is recommended to use the most current compatibility level. However, if you have an existing model and want to upgrade to the latest SQL Server version, you can set your compatibility level to what you are currently running until you have a chance to update the level and test it with the new features. The compatibility level is set when creating a new project in Visual Studio.
SQL Server 2019 supports the 1500 (SQL Server 2019), 1400 (SQL Server 2017), and 1200 (SQL Server 2016) compatibility levels. The features released with SQL Server 2019 are included in compatibility level 1500.
Here are some of the key updates included with SQL Server 2019 Analysis Services (compatibility level 1500):
- Query interleaving
- Calculation groups in tabular models
- Governance setting for Power BI cache refreshes
- Online attach
- Many-to-many relationship support
Let's look at each of these changes in terms of what they are and why they matter.
Query interleaving
Query interleaving allows you to set how queries are handled based on query length and performance. Tabular model queries are handled in a first-in, first-out model (FIFO) by default. This means that a long-running query could make shorter queries run for longer if they follow that query in the queue. By enabling this feature, shorter queries can be executed during a long query run. This feature is only available for import models, not Direct Query. However, if you have a high-concurrency tabular model solution (lots of users or complex queries), this feature could improve performance for your users and reduce CPU pressure on the server.
Calculation groups
Calculation groups are used to group related calculations, which users often work with at the same time. This is really helpful with large complex models with many different calculations for the users to navigate. Microsoft calls out that Time intelligence will benefit from this significantly. For example, you can create a calculation group that has Current, Month-to-Date (MTD), Quarter-to-Date (QTD), and Year-to-Date (YTD) and call it xTD. When the user views the deployed model, they will see a calculation group as a single column they can add to their visual, which displays all four of these calculations as applied to a base measure such as Revenue. This feature has been added to improve usability in complex models.
Governance settings for Power BI cache refresh
The Power BI service caches data for dashboards and reports to improve performance and user experience when using live connections with tabular models. However, in some cases, this can cause a significant amount of queries with the possibility of overloading a server. This setting will override background refresh policies set on the client, preventing performance issues on the server.
Online attach
Currently, updates to tabular models require the model to be taken offline while deploying changes to the model. This results in downtime for the model. This feature allows model designers to deploy model changes live. This is similar to the shadow copy feature with multidimensional models, which supports the same online deployment.
The process currently is supported using XML for Analysis (XMLA) (more about that later). However, for tabular models, you will need to account for double the model's memory footprint during the online attach operation. The effective result is that during the attach process, both the new model and the old model will be in memory during the process. Once the process has completed, the old model will be removed. During the operation, users can continue to query the model and will start using the new model once it is loaded.
Many-to-many relationship support
Many-to-many relationship support has always been an issue with tabular models. This change allows relationships to be created between two tables where the relationship may not be unique. For example, if you have a fact table that is aggregated to the month, you will now be able to use the month value from a date table that has daily granularity. This allows cleaner, simpler models that are easier to use. Next, we will look at the tools that are used with SSAS.
What are the tools used with SQL Server Analysis Services?
Because SSAS is part of the SQL Server stack, many tools can be used to support both products. Microsoft has made a significant push to consolidate tooling over the years. As a result, we have two key tools used for building and interacting with models – SQL Server Management Studio (SSMS) and Visual Studio. In the following sections, I will discuss what role each plays and where to get the tools to match the work we are doing in the rest of the book. We will also walk through the installation of both Analysis Services modes.
SQL Server 2019 Developer edition
Let's start with installing SQL Server 2019 and both Analysis Services modes. We will be using the Developer edition of the SQL Server products. Because we will be using data stored in SQL Server to support our models, you will be installing three instances of SQL Server – one relational, one multidimensional, and one tabular. The relational and multidimensional instances will be installed during the same installation. The Developer Edition is the functional equivalent of the Enterprise Edition.
You can find the latest version of SQL Server 2019 Developer edition by searching for SQL Server 2019 Developer in your preferred search engine. The current location for all SQL Server downloads is https://www.microsoft.com/en-us/sql-server/sql-server-downloads. You should download the Developer edition as shown in the following screenshot. It is a free developer option for you to use while learning SSAS:
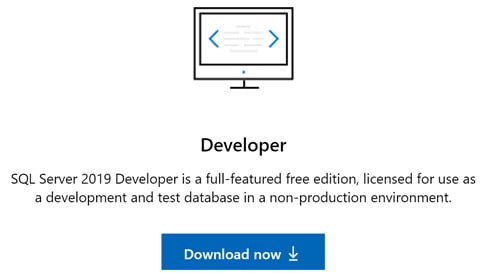
Figure 1.6 – Downloading the Developer edition
We do have the ability to install two of the instances simultaneously. Next, we will install the database engine and multidimensional mode as described. Once those are complete, we will install another instance to support the tabular mode.
Installing SQL Server 2019 database engine and SQL Server 2019 Analysis Services multidimensional mode
For the most part, we will follow a normal installation process for the database engine and Analysis Services in multidimensional mode. I will use the following set of screenshots to highlight decision points through the process:
- After you launch the installation for the first time, you will need to select the Custom installation type. Basic does not include the option to install Analysis Services:

Figure 1.7 – Choose Custom from the initial installation dialog
Production installations
The instructions provided here are intended for development and experimental installs. Please refer to the latest best practices from Microsoft regarding production workload installations.
- You will need to select the Installation tab on the left, then select New SQL Server stand-alone installation or add features to an existing installation option:

Figure 1.8 – Choose the New SQL Server stand-alone installation
- You will start the installation process. You can select the default options until you get to the Product Key screen. On this screen, you should select the Developer edition for your free key. This will allow you to use all the features available in SQL Server Enterprise edition:

Figure 1.9 – Select Developer edition for free product key
- The next stopping point is Feature Selection, as shown in the following screenshot. I encourage you to review all the options available to you with SQL Server 2019. There are a lot of non-database features included in SQL Server, such as support for machine learning and data virtualization (Polybase). If this is the first time you have installed SQL Server in some time, you should note that SQL Server Reporting Services (SSRS) and SQL Server Management Studio (SSMS) are not included here. Both of these products should be downloaded separately. We will walk through Management Studio for our purposes shortly.
We will need Database Engine Services and Analysis Services for our installation. That will allow us to create instances of SQL Server and SSAS during our installation:

Figure 1.10 – Choose Database Engine Services and Analysis Services
- The next section of interest is Instance Configuration. If you have been around SQL Server for a while, you have likely installed the Default instance many times. I am recommending you use the Named instance option. We will have two instances of Analysis Services when we are done. Using the Named instance option will help you keep these clearly separate:

Figure 1.11 – Select Named instance and provide a unique name for your instance
Two names or three names
The current installation path we are following will result in two instance names. The first instance name will be used for both Database Engine Services and Analysis Services – Multidimensional Mode. We will go through the install process again to install Analysis Services – Tabular Mode with a different instance name. If you want to identify all of your instances separately, go back a step and unselect Analysis Services. This will allow you to create Database Engine Services with a unique instance name. You will need to follow the steps in the tabular mode installation instructions to add an instance for multidimensional mode as well. Refer to the setup instructions in the following sections for the Multidimensional Mode installation. This is your choice and will not affect examples used in the remainder of the book.
Remember that the name you choose here will be used by both the Database Engine Services instance and the Analysis Services Multidimensional Mode instance.
I am choosing to keep the default settings for Server Configuration. In a production installation, you should use service accounts configured for this purpose. Service accounts are created by your security team and are typically the more secure option for production environments. You may choose to do this for your developer install here if you choose to:

Figure 1.12 – Set custom accounts here if preferred
- The next section covers Database Engine Configuration. I almost always set up mixed mode when doing development or testing work. This allows me to have an System Administrator user as well as to set up local database users if needed. I would not recommend this for most production scenarios. Using an Active Directory account is more secure for production servers. In our scenario, I would also recommend adding your current Windows user account to the SQL Server Administrators group:

Figure 1.13 – Set up your authentication and admins
- Now click on the Data Directories tab. This is a preference for you as well. You are welcome to keep the default options here. I typically create a data directory off of a drive – in this case,
C– to hold data files. If you have multiple drives, you should select the fastest drive for your SQL Server data. Take note of your backup directory as you will need to use that later in the chapter:
Figure 1.14 – Choose the location for your data directories
I will not be customizing the rest of the install. Feel free to browse the other tabs to review additional options you can set during installation.
- The next screen is Analysis Services Configuration. It is similar to the previous two screens we worked with. However, you will notice that Analysis Services does not have a mixed mode option. It only supports Windows or Active Directory security.
We will be installing Multidimensional and Data Mining Mode in this instance. While I don't have a screenshot of the data directories, I would recommend you choose your fastest available hard disk for this instance as well:
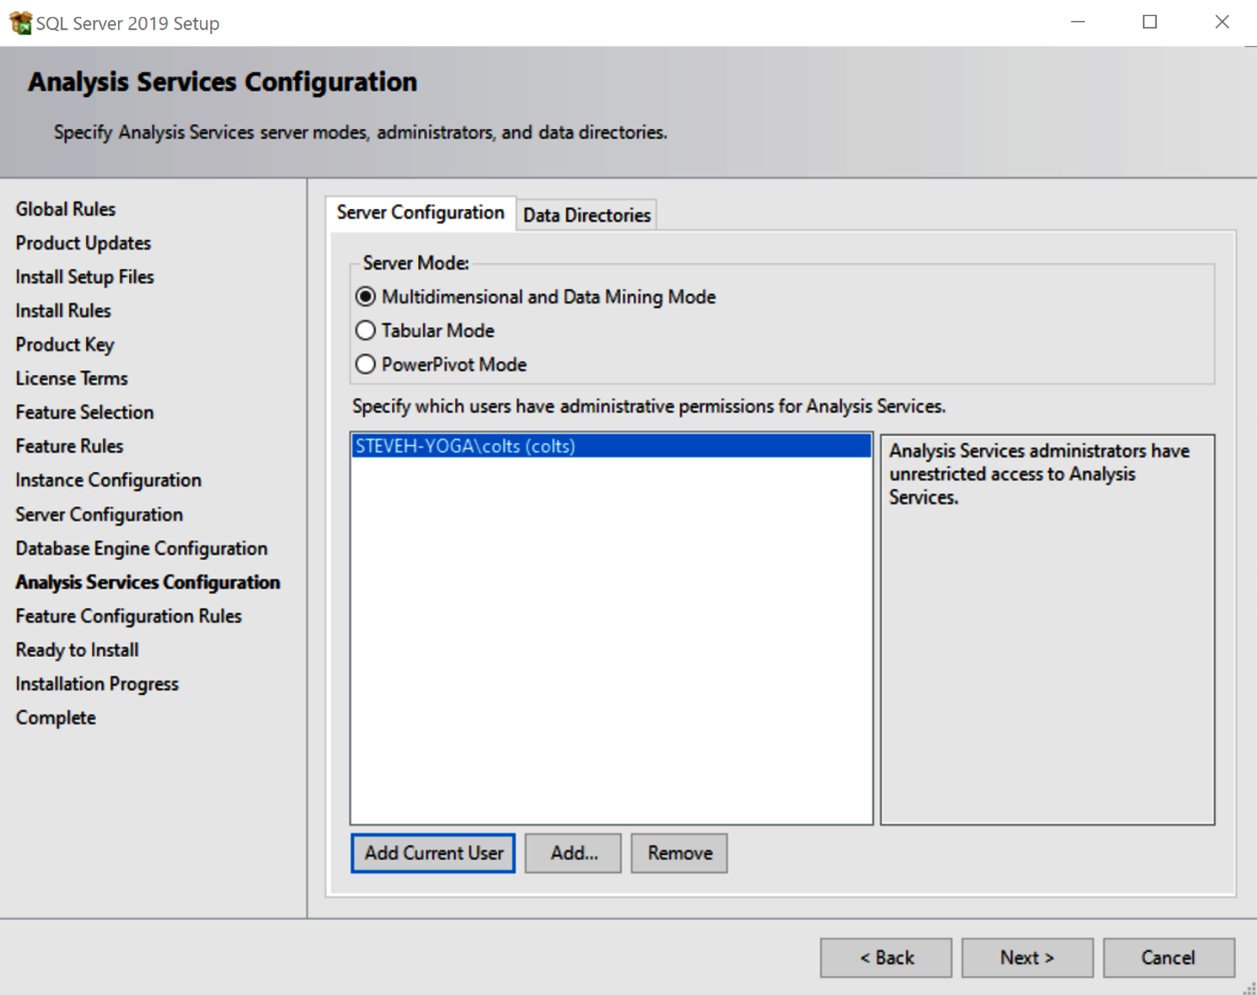
Figure 1.15 – Select multidimensional mode and add your user as an admin
You have completed the configuration settings at this point. The next few dialogs will show you what you have chosen to install, and you will be able to see your installation progress. You will see the following dialog when you have successfully completed your installations:
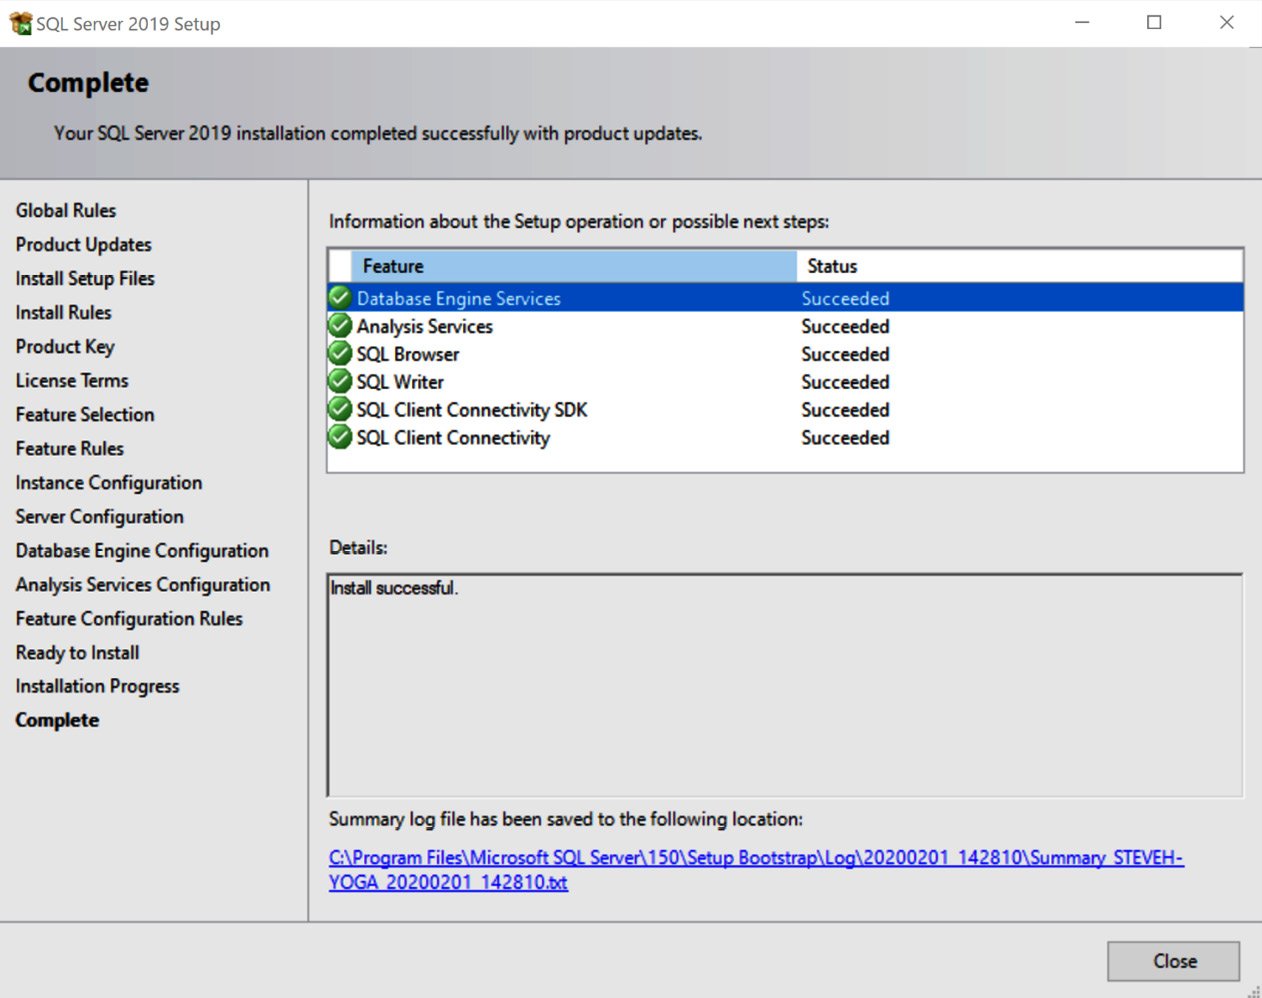
Figure 1.16 – Congratulations! You have successfully installed SQL Server 2019
Let's now look at the installation of SSAS using tabular mode.
Installing SQL Server 2019 Analysis Services tabular mode
Now, we will install another instance of Analysis Services using the tabular mode as follows:
- Typically, the Installation dialog box is still open at this point (assuming you did not close it). If it is not open, you will want to run the installation media for SQL Server 2019 again.
You will choose the new SQL Server stand-alone installation option as we did in the previous section:

Figure 1.17 – Choose to do a new SQL Server installation
- You can use the default settings until you get to the Installation Type dialog. Do not choose to add features. You must perform a new installation. The reason for this is that you cannot add another Analysis Services instance to your current instance:

Figure 1.18 – Choose Perform a new installation of SQL Server 2019
- As you move through the next few dialogs, you will choose the development free option once again. When you get to the feature selection, you should only select the Analysis Services option. We are only planning to install an additional Analysis Services Tabular Mode instance:

Figure 1.19 – Only choose Analysis Services here
- Once again, I will recommend a named instance for this installation as well. As you can see, we do not have a default instance, so that is still an option here. Your existing instance name is shown in the table for your reference:

Figure 1.20 – Create a new named instance
- The next step is Analysis Services Configuration. In this case, you will select the Tabular Mode option. As with the other installation, you can specify your Data Directories and set your current user as an administrator for this instance:

Figure 1.21 – Choose Tabular Mode and add your user as an admin
- Complete the installation process and you should see the following Complete dialog with only Analysis Services in the Feature list. Congratulations, you have successfully installed the three instances of SQL Server 2019 to be used throughout the book:
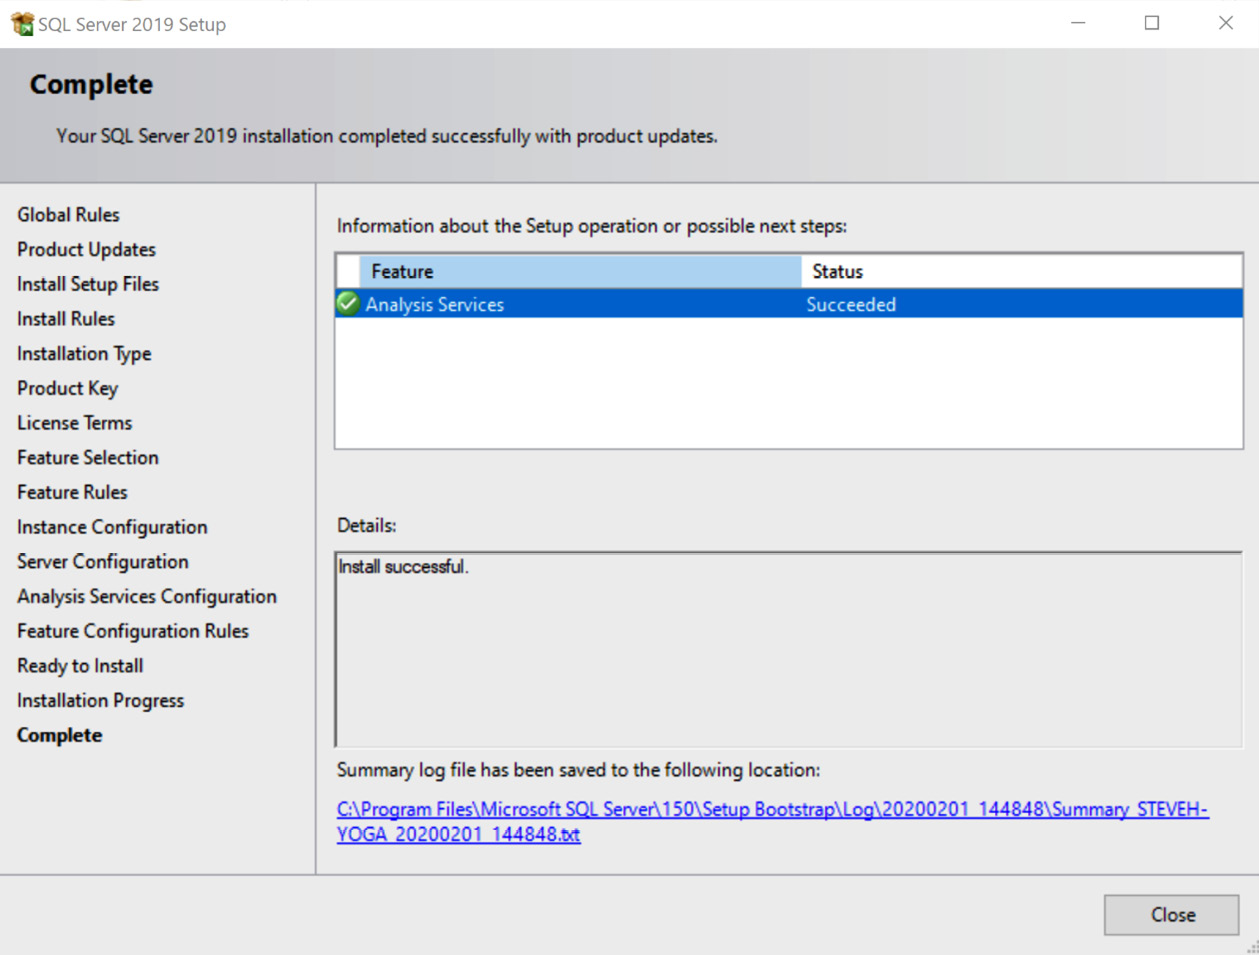
Figure 1.22 – Congratulations! You have successfully installed your Analysis Services – Tabular Mode
Now that we have successfully installed Analysis Services for tabular models, let's see how to manage installations.
Managing installations
Once installed, you will find that SQL Server tends to be very resource hungry. My recommendation is that you turn the services off when you are not using them. The following scripts are PowerShell and will allow you to turn them on and off as needed. In order to use these scripts, you will need to put the instance name in the locations where [[INSTANCE NAME]] is in the code. Replace all that text with your instance name. If that does not work, you will need to find the service name in the services list in Windows.
There are two scripts here – the first will disable the service and turn it off. This will prevent it from restarting if you reboot your PC. The second script will turn on the services. I saved these files as SQLServerOn.ps1 and SQLServerOff.ps1. I execute them by opening a PowerShell window as an administrator. At the prompt, you type the following:
$ "<<YOUR PATH HERE>>\SQLServerOff.ps1"
You will need to replace <<YOUR PATH HERE>> with the location you stored the file at. Now to the scripts themselves. This script will disable the services and power down the service:
Set-Service 'MSSQL$[[INSTANCENAME]]' -StartupType Disabled
Stop-Service -Name 'MSSQL$[[INSTANCENAME]]' -Force
Set-Service 'MSOLAP$[[INSTANCENAME]]' -StartupType Disabled
Stop-Service -Name 'MSOLAP$[[INSTANCENAME]]' -Force
Set-Service 'MSOLAP$[[INSTANCENAME]]' -StartupType Disabled
Stop-Service -Name 'MSOLAP$[[INSTANCENAME]]' -Force
I saved this script as SQLServerOff.ps1. Once this is run, these services will not restart on reboot. The next script will re-enable the services. I chose to enable with a manual StartupType in order to prevent a restart in the event of a reboot. You can choose Automatic if you prefer:
Set-Service 'MSSQL$[[INSTANCENAME]]' -StartupType Manual
Start-Service -Name 'MSSQL$[[INSTANCENAME]]'
Set-Service 'MSOLAP$[[INSTANCENAME]]' -StartupType Manual
Start-Service -Name 'MSOLAP$[[INSTANCENAME]]'
Set-Service 'MSOLAP$[[INSTANCENAME]]' -StartupType Manual
Start-Service -Name 'MSOLAP$[[INSTANCENAME]]'
This script is saved as SQLServerOn.ps1. Remember to execute this with a PowerShell command window open in administrator mode.
Enabling PowerShell execution
By default, PowerShell execution is secured. If you have not enabled PowerShell execution on your PC, you will be unable to run a script you have created. To enable PowerShell to run locally created scripts on your PC, you will need to open a PowerShell window and run the following script:
Set-ExecutionPolicy RemoteSigned
Next, we will get familiar with SSMS.
SQL Server Management Studio (SSMS)
A few versions back, Microsoft removed SSMS from the SQL Server media. This allowed them to make changes to the tool independent of the version of SQL Server released. This made it significantly easier for users to get Management Studio, eliminating the need to run the SQL Server installation process. At the time of writing, the latest version of Management Studio is 18. You should install the latest version to make sure you have all the capabilities we will go through in the book.
Installing SQL Server Management Studio
The installation link for SSMS can be found on the same page as SQL Server 2019 Developer edition. It is usually located near the bottom of the page with all the supporting tools, as follows:
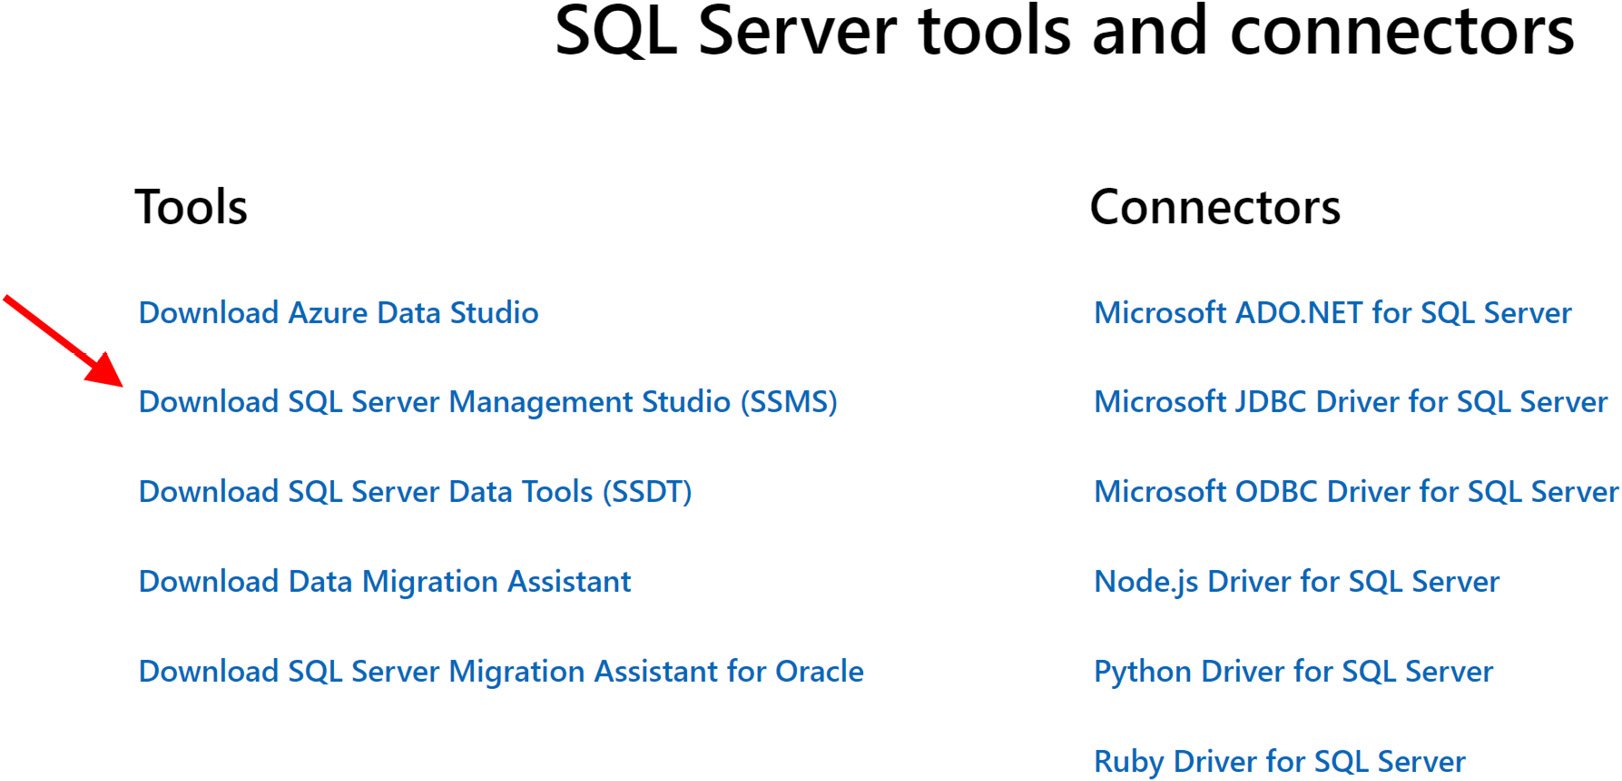
Figure 1.23 – Choose SQL Server Management Studio
When you select the SSMS link, you will be redirected to the Microsoft Docs page with instructions and details about the current version of Management Studio. Download and install SSMS. This is a simple install with no options that impact the work we will do in the book. As noted in the following install dialog, this book will be using RELEASE 18.4:
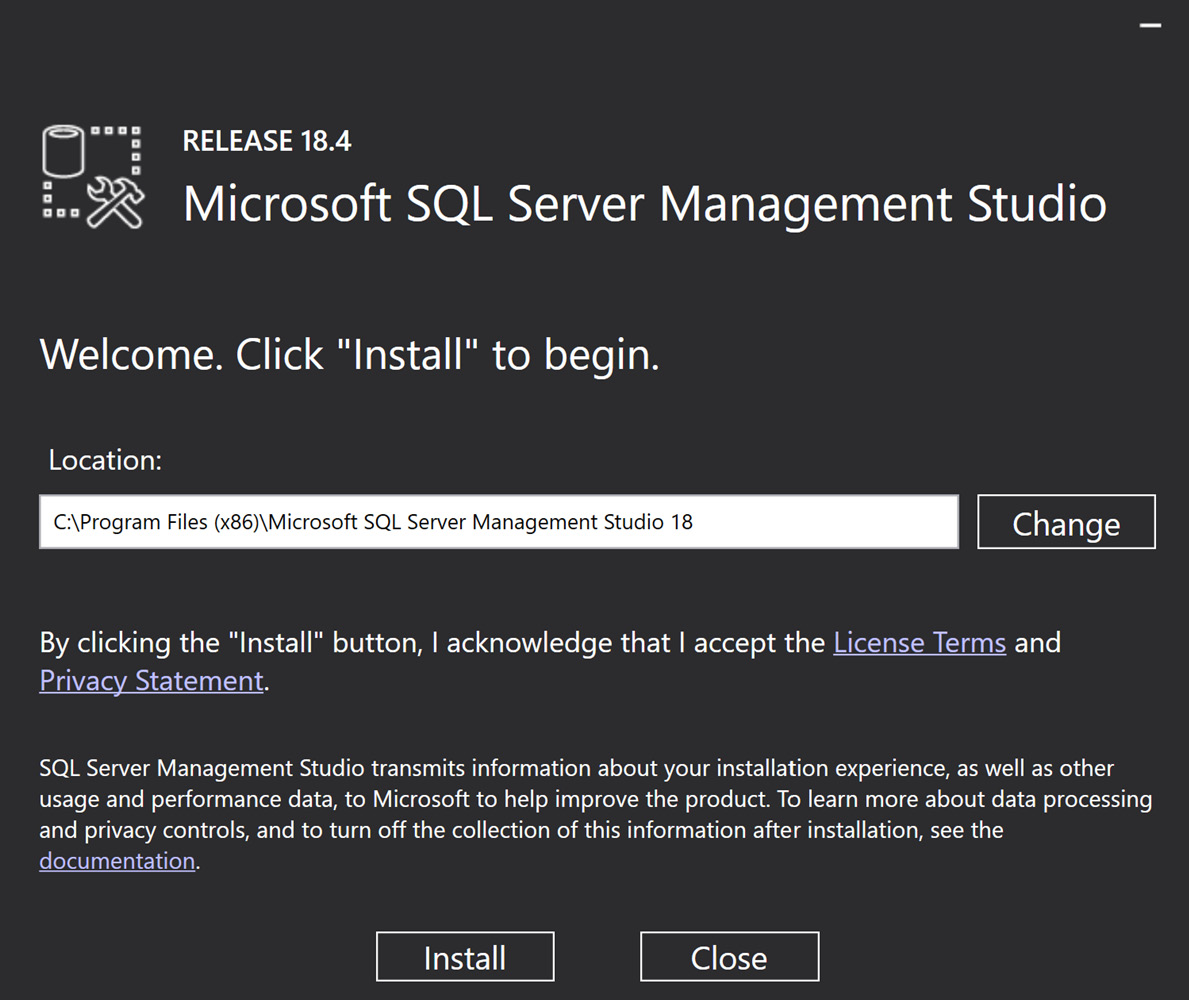
Figure 1.24 – Installation screen for SQL Server Management Studio – release 18.4
Next, let's learn more about Visual Studio.
Visual Studio with SQL Server Data Tools (SSDT)
Visual Studio and SQL Server have had many different working combinations over the years. While I included SSDT in this section's heading, Visual Studio 2019 is set up differently. Prior to the current version of Visual Studio, SSDT was a separate installation that you installed after selecting your Visual Studio version. As a reminder, we will be using Visual Studio 2019 for the examples and illustrations in this book:
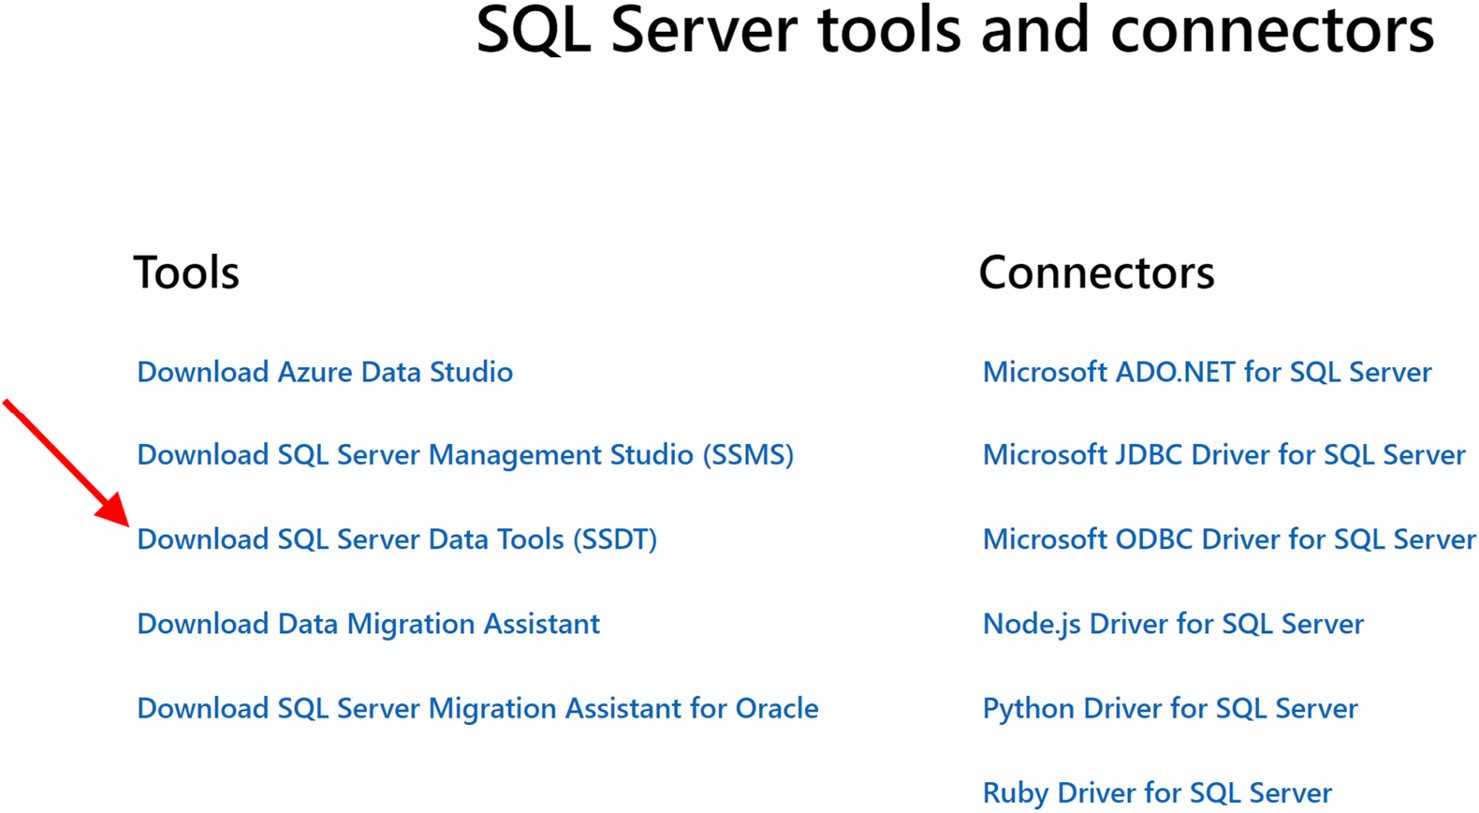
Figure 1.25 – Choose Download SQL Server Data Tools for this section
Previous versions of Visual Studio
SSDT is still a valid install with Visual Studio version 2017. However, SQL Server 2019 components including the latest Compatibility Level are not supported. You may need to keep Visual Studio 2017 and related tools to support the current project. Visual Studio 2017 and Visual 2019 can be installed side by side.
Installing and configuring Visual Studio with support for Analysis Services 2019
The first decision you will need to make is what edition of Visual Studio you want to use. If you have a Visual Studio subscription, a corporate license, or a personal license, you likely have options to install Visual Studio 2019 Professional or Visual Studio 2019 Enterprise. If you are starting out and this is truly a learning experience for you and you don't want or need to purchase a license for Visual Studio, the best option is likely the Community Edition.
For the purposes of this book, I will be using the Community Edition of Visual Studio 2019. You can find this edition for download at https://visualstudio.microsoft.com/downloads/. Let's get it installed and configured.
As part of the installation, you will need to select one or more workloads. While you are welcome to choose other workloads for the installation, for our purposes, you need to select Data storage and processing in the Visual Studio installation dialog.
Once the installation is complete, launch Visual Studio. Under the Get started options, choose Continue without code. The next step is to install the extensions to create Analysis Services projects.
Adding Visual Studio Extensions for Analysis Services 2019
Now that you have Visual Studio 2019 open, you need to install the extensions used to support Analysis Services development:
- First, let's open the Manage Extensions dialog. You can open this by selecting the Extensions option in Visual Studio and selecting Manage Extensions:

Figure 1.26 – Open Manage Extensions in Visual Studio 2019
- Once you select Manage Extensions, the following dialog will open. You will need to open the following menu sequence: Online > Visual Studio Marketplace > Tools > Data. This will filter the list of options to data-specific extensions. Choose Microsoft Analysis Services Projects and then click Download. This will start the process to download and install the extension:

Figure 1.27 – Choose the Microsoft Analysis Services Projects download
- Once the install is complete (it may require you to close Visual Studio), you should be able to create a new project and see the Analysis Services project types in the options:
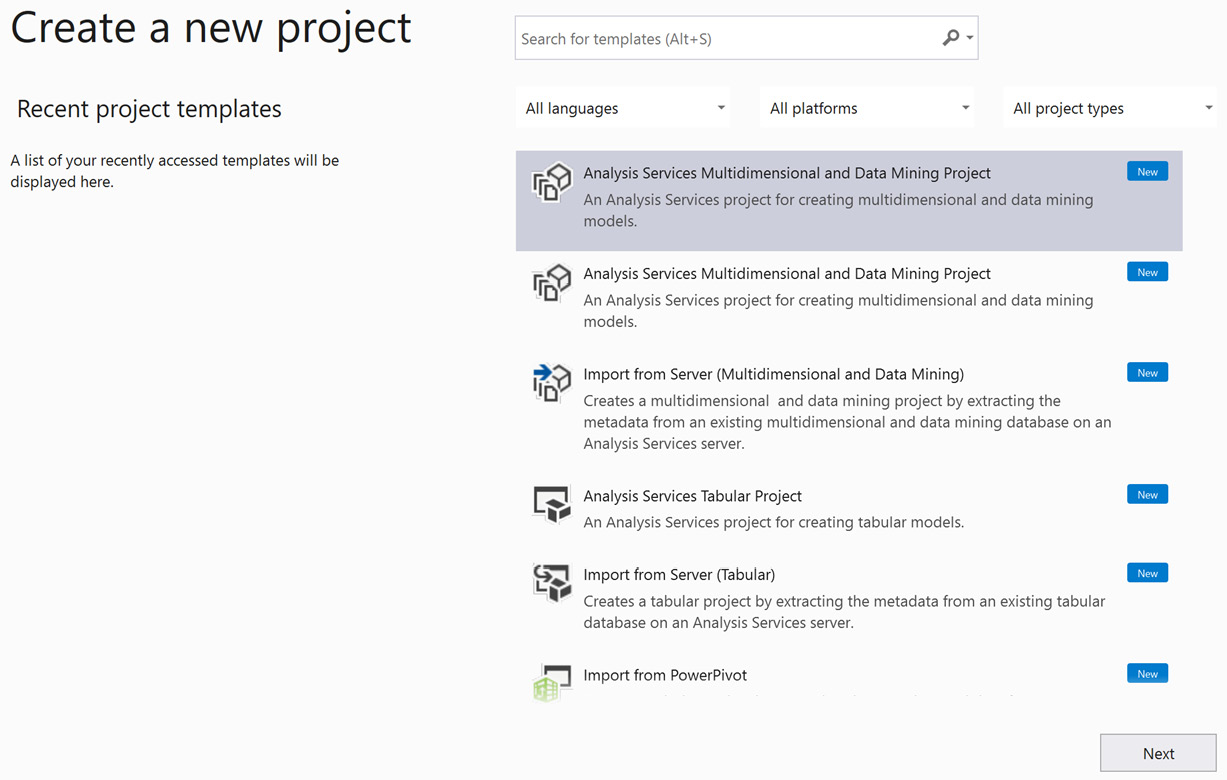
Figure 1.28 – Congratulations! You can create Analysis Services projects
You will need to restart Visual Studio to complete the installation process. Once you have restarted Visual Studio, you are ready to create Analysis Services models and deploy them to Analysis Services 2019.
One last thing – our sample data
This is the final preparation piece before we build the Analysis Services models. We will be using the latest Microsoft sample database from Wide World Importers. The Wide World Importers data warehouse sample is a star schema database. While a number of cool features have been added and can be explored in the data warehouse, our focus is on source data for our Analysis Services models.
You can find the World Wide Importers sample databases on GitHub: https://github.com/Microsoft/sql-server-samples/releases/tag/wide-world-importers-v1.0. For our purposes, you only need the WideWorldImportersDW-Full.bak file. If you are interested in the features for the transactional database, which is the actual source for the data warehouse, you can also download WideWorldImporters-Full.bak. If you get both samples, you will need 10 GB of storage for the databases and a minimum of 1.5 GB of RAM to support them.
The sample databases use the latest features of SQL Server 2019
This is a warning for if you choose to install both databases on your server. Both use in-memory features, which could cause performance issues on your computer. These features are meant to highlight some of the latest features but can be resource-intensive. If this is a concern, you should not restore the transactional database at this time.
Once you have the backup file downloaded, I would recommend you move the file to the Backup folder located where you selected during the install process. This folder will be easily discoverable from SSMS during the restore process. This is not required, but I find it a good practice in most cases.
Restoring the data warehouse backup
Let's restore the database now:
- Open up SQL Server Management Studio.
- Connect to your SQL Server 2019 database instance.
- Right-click on the Databases folder and select Restore Database…:

Figure 1.29 – Select Restore Database…
- In the Restore Database… dialog, choose Device.
- Then use the ellipses button to open a dialog box that will allow you to choose the
WideWorldImportersDW-Full.bakfile. Click Add to find your backup file. - Once selected, your dialog should be filled in similar to the following:

Figure 1.30 – Your dialog box should look like this
- Next, select OK. This will take some time, but you should see the restored database in Management Studio when the process is complete.
You can also use a script to restore the backup as shown here. You will need to replace
{YOUR PATH HERE}with the location of your files:USE [master] RESTORE DATABASE [WideWorldImportersDW] FROM DISK = N'{YOUR PATH HERE}\MSSQL\Backup\WideWorldImportersDW-Full.bak' WITH FILE = 1, MOVE N'WWI_Primary' TO N'{YOUR PATH HERE}\MSSQL\DATA\WideWorldImportersDW.mdf', MOVE N'WWI_UserData' TO N'{YOUR PATH HERE}\MSSQL\DATA\WideWorldImportersDW_UserData.ndf', MOVE N'WWI_Log' TO N'{YOUR PATH HERE}\MSSQL\DATA\WideWorldImportersDW.ldf', MOVE N'WWIDW_InMemory_Data_1' TO N'{YOUR PATH HERE}\MSSQL\DATA\WideWorldImportersDW_InMemory_Data_1', DOWNLOAD, STATS = 5 GO
Whichever option you choose to use, this will result in a restored database for us to use in later chapters.
Summary
At this point, we are ready to start working with Analysis Services in SQL Server 2019. You have successfully installed the tools we will be using and uploaded the sample data. Along the way, you were able to learn some of Analysis Services' history and how the introduction of Tabular Mode and the VertiPaq engine disrupted the multidimensional database world.
In the next chapter, we will evaluate the right times to choose one mode over the other. As you noticed during the installation, they are not the same product and they come with their own strengths and weaknesses. Once we look at the reasons to choose one option over the other, we will begin the process of creating models in both, starting with multidimensional and moving to tabular. We will look at some common reporting tools to interact with these models and wrap up with some advanced techniques. Remember, if you follow the exercises in the book, you will create models in both modes in Analysis Services and understand which fits your business needs better.