


 Download code from GitHub
Chapter 2: Connecting to Fetch Data
One of the main aspects of Power Query is the wide range of data connectors. It offers a varied range of connection options and users can connect to data sources that reside on the cloud, on premises, and in local directories intuitively.
The idea is to treat all data sources at the same level and users (once they select the data they want to transform coming from different sources) can operate and combine them without caring about the data sources' original structure.
In this chapter, there will be an overview of connectors, and we will cover some of the best practices for how to connect to some of the most common connector types.
The recipes that will be covered in this chapter are the following:
- Getting data and connector navigation
- Creating a query from files
- Creating a query from a folder
- Creating a query from a database
- Creating a query from a website
Technical requirements
For this chapter, you will be using the following:
- Power BI Desktop: https://www.microsoft.com/en-us/download/details.aspx?id=58494
- A Power BI Pro license: https://powerbi.microsoft.com/en-us/power-bi-pro/
- Minimum requirements for installation:
a) .NET Framework 4.6 (Gateway release August 2019 and earlier)
b) .NET Framework 4.7.2 (Gateway release September 2019 and later)
c) A 64-bit version of Windows 8 or a 64-bit version of Windows Server 2012 R2 with current TLS 1.2 and cipher suites
d) 4 GB of disk space for performance monitoring logs
You can find the data resources referred to in this chapter at https://github.com/PacktPublishing/Power-Query-Cookbook/tree/main/Chapter02.
Getting data and connector navigation
Power Query, thanks to its interface, offers an easy way to connect to data sources. In the previous chapter, you saw different authentication types, but here you will get an overview of the connector types and learn which one fits best. You will also learn the difference between preview (or beta) and general availability connectors.
Getting ready
For this recipe, you need to have Power BI Desktop running on your machine.
How to do it...
Open Power BI Desktop and you will be ready to perform the following steps:
- The first step in every version of the Power Query tool, whether it is the online or desktop version, is to click on Get data:

Figure 2.1 – Get data in Power Query Desktop (left) and Get data in Power Query online (right)
- Once you expand the Get data section, you will end up with the following view in the Power Query Desktop version:
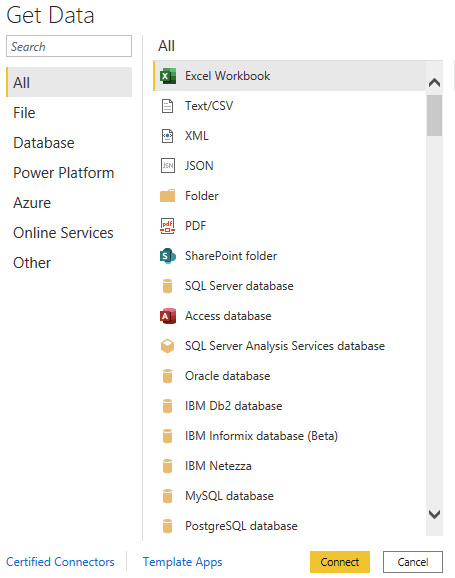
Figure 2.2 – Get Data All connectors view in Power Query Desktop
And if you expand the same section in the Power Query online version, you will see the following:
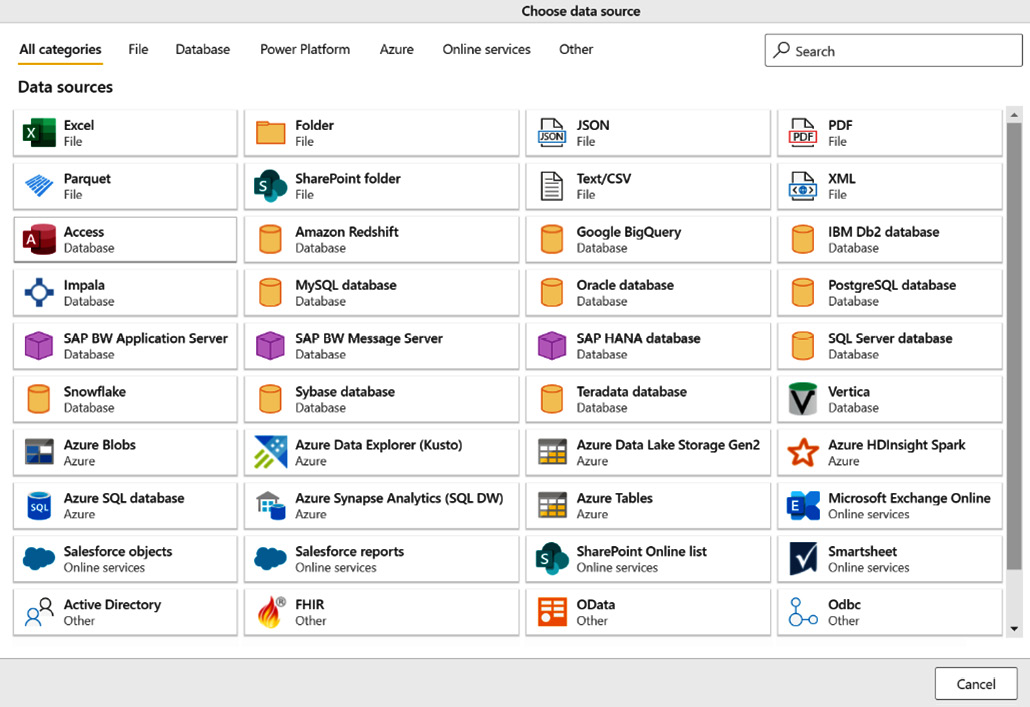
Figure 2.3 – Get Data All categories view in Power Query online
Both versions have the following connectors divided into the same categories:
- File: You can connect to different types of files, such as Excel, CSV/TXT, XML, JSON, Folder, PDF, and Parquet.
- Database: You can connect to all mainstream databases such as Microsoft, Oracle, IBM, open source databases (MySQL, PostgreSQL, and MariaDB), Teradata, SAP, Amazon Redshift, Google BigQuery, Snowflake, and many others. This wide variety allows the user able to connect to the different sources and not have concerns about having the required data in only one standard data source.
- Power Platform: You can connect live to Power BI datasets already published in the Power BI service. You will have the ability to connect to already prepared and transformed queries with the Power BI dataflow connectors and perform additional steps without doing everything from scratch.
- Azure: You can connect to all Azure Data Services sources, such as Azure SQL Database, Azure Synapse, Azure Data Lake Storage, and to Azure open source services such as Azure Databricks and Azure HDInsight.
- Online Services: You can connect to a wide range of third-party services and use native connectors to the Dynamics platform, Salesforce, Google Analytics, and other services that are continuously updated and released.
- Other: This category collects more generic connectors, such as web connectors (used for getting data from websites, to make API calls, or to import files from the web), OData feeds, ODBC, and R and Python scripts. This set of connectors allows users to leverage some common connection logic that is used in other tools that can also be replicated with Power Query.
Users have to check what connectors are available in each version of Power Query – either the desktop or online version – and they have to research new connectors' availability. There are new ones both in beta (as shown in the following figure) and a general availability version with every release of Power Query. This list is constantly updated in the Microsoft documentation:

Figure 2.4 – Connector in the preview example
Creating a query from files
Power Query users (when they start to use and explore the tool) usually start by connecting to a local file. They can see from the start that the main file types are supported and each of these will display data in a readable format.
In this recipe, we will connect to an Excel file and see how to navigate and expand the different sheets and how to connect to cut-off text/CSV files.
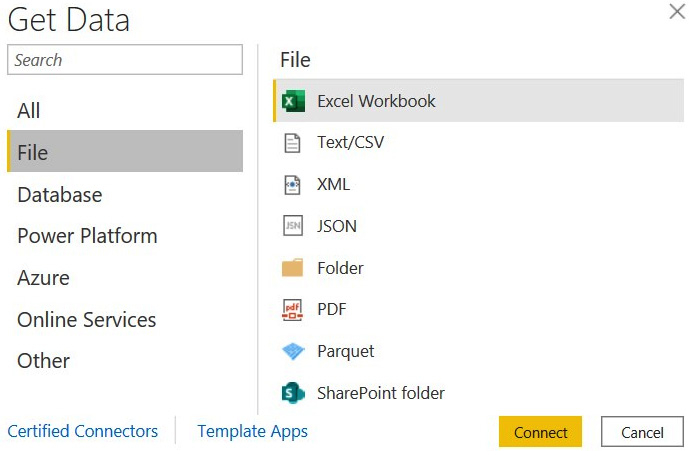
Figure 2.5 – Get Data File section
Getting ready
In this recipe, in order to test different types of file connectors, you need to download the following files in a local folder:
- The
AdventureWorksSalesExcel file - The
FactResellerSalesCSV file
In this example, we will refer to the C:\Data folder.
How to do it...
Once you have opened your Power BI Desktop application, perform the following steps:
- Go to Get data and click on Excel workbook:

Figure 2.6 – Get data Excel connector
- Navigate to your local folder where you saved the Excel file, select it, and open it:

Figure 2.7 – Local folder view
- Once you open it, the following window will pop up:

Figure 2.8 – Excel data preview
Each item in the left pane matches an item in the Excel file. By only clicking on an item, you will see a preview of the data in the right pane and if you check it, you will include the item in the Power Query view. Therefore, flag the following queries: Customer, Date, and Product. Click on Transform Data.
- Each sheet will correspond to a query. From now on, you can perform all transformations as you would with any other data source type:
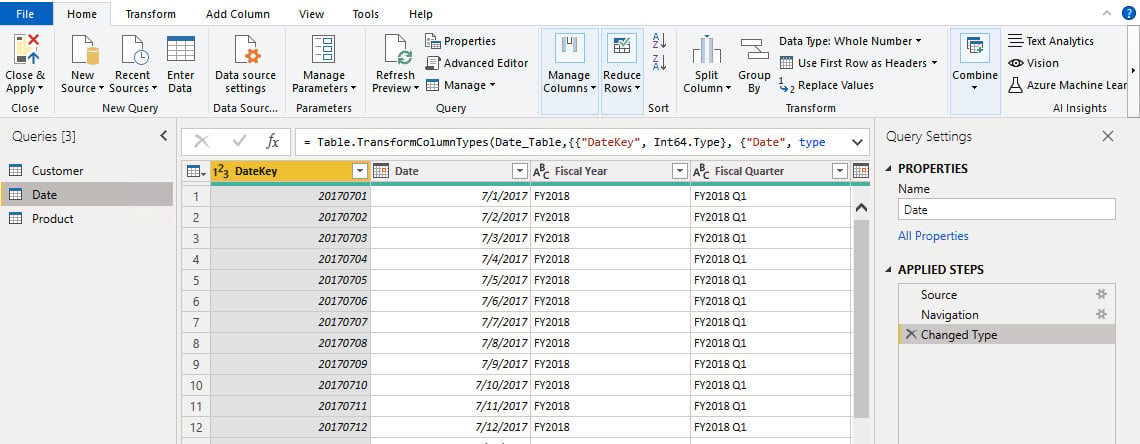
Figure 2.9 – Power Query interface
Let's add a connection to a CSV file:
- Click on Get data and select the Text/CSV connector:

Figure 2.10 – Get data Text/CSV connector
- Navigate to the local folder where you saved the
FactResellerSalesCSV file. Select it and open it as in the previous section with the Excel file. The following window will pop up:
Figure 2.11 – CSV data preview
For each file, you can define the following:
a) File Origin: Define the file encoding (in this case, we will keep the default Unicode UTF-8).

Figure 2.12 – Define the file encoding
b) Delimiter: Select the right delimiter (in this case, we will keep the default Comma):

Figure 2.13 – Define the delimiter
c.) Data Type Detection: This will refer to the first applied step in Power Query when it detects data types for each column (in this case, we will detect data types based on the first 200 rows):

Figure 2.14 – Define Data Type Detection
- On the bottom left of this window, you can also extract information from the CSV file by clicking on Extract Table Using Examples:

Figure 2.15 – Extract Table Using Examples button
The following section will appear:

Figure 2.16 – Extract Table Using Examples interface
- You can define your columns and which data to extract by filling in the table at the bottom. Have a look at the following example: name the first column ResellerKey and write in the first row the value
676, which is the first ResellerKey value you see in the example, and click on Enter:
Figure 2.17 – Insert values example
- If you look at row 5 in Figure 2.18 (the left image), you can see that a wrong value has been detected. In this case, you can click on it and insert the right one and you will observe how all values in the column will be corrected:

Figure 2.18 – Insert value detail example (left) and fill in missing or wrong values (right)
- You can add a second column and repeat the steps done with the first. Name the second column EmployeeKey and insert the first value. Click Enter and you will see the corresponding rows filled:

Figure 2.19 – Create a second column example
- At the end, click on OK and you will see the CSV in the Power Query interface as shown in the following screenshot:
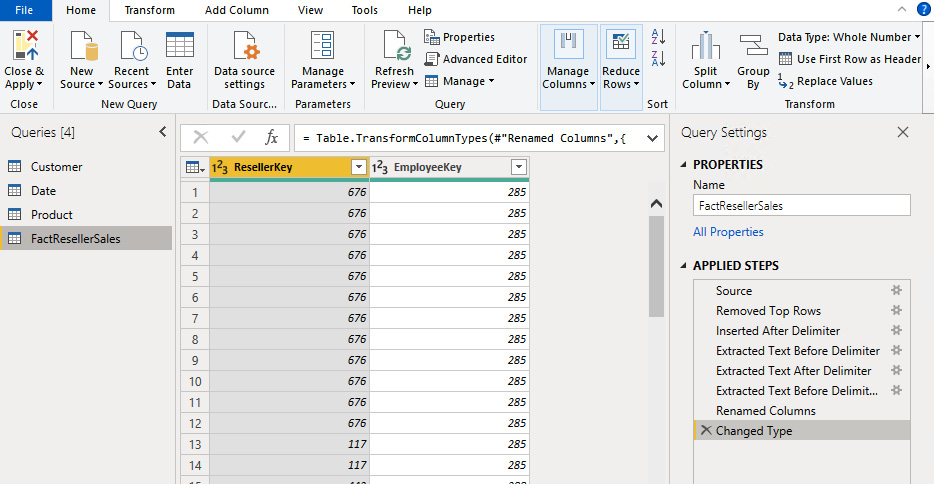
Figure 2.20 – Power Query interface
In the APPLIED STEPS section, you will see some activities mapped as a result of Extract Table Using Examples performed previously.
How it works...
Power Query, thanks to these file connectors, allows users to connect to single files and perform some pre-transformation tasks allowing them to load just relevant data in the usual interface. However, these connectors – Excel, TXT/CSV, and also Parquet file are related to single files. We will see in the following recipe how to connect to multiple files.
Creating a query from a folder
After playing with single files as the previous recipe showed, you need to load more files as their analytical workloads grow. If files are organized in folders, users can leverage a folder connector to load multiple files. Imagine having a collection of CSV files where each contains sales data for a specific day. What if we want to connect to a folder that contains these files, and we want to load them in Power Query as a single table? The way to go is to leverage the folder connector.
In this recipe, we will see how to connect to a folder with sales data in CSV format and a folder with finance data in Excel format (each file contains multiple sheets).
Getting ready
In this recipe, in order to test different types of file connectors, you need to download the following folders, each containing a set of files:
- The
CSVFilesfolder containing the following CSV files:
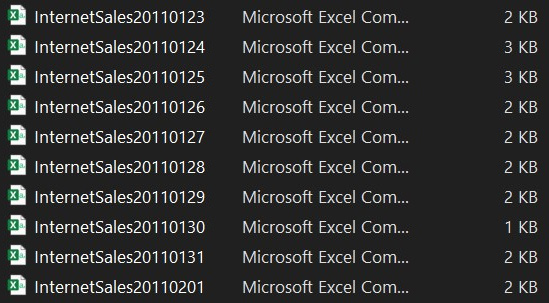
Figure 2.21 – Local folder with CSV files
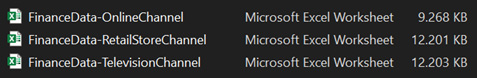
Figure 2.22 – Local folder with Excel files
In this example, I will refer to the following paths:
a) C:\Data\ExcelFiles
b) C:\Data\CSVFiles
You can find the folders and the related files referred to in this chapter at https://github.com/PacktPublishing/Power-Query-Cookbook/tree/main/Chapter02/ExcelFiles and https://github.com/PacktPublishing/Power-Query-Cookbook/tree/main/Chapter02/CSVFiles.
How to do it...
Open the Power BI Desktop application and perform the following steps:
- Go to Get data, click on Folder, and the following window will pop up. You can directly enter your folder path or click on Browse… and select it from the usual browsing section of your machine:

Figure 2.23 – Folder connector
- Once you click on OK, you will see the following section with a list of files contained in the folder:

Figure 2.24 – How files from the folder are displayed
At the bottom right, you can see some actions to perform:
a) Combine & Transform Data: You can combine data by appending existing data at this phase and open Power Query.
b) Combine & Load: You can append tables, load them, and start creating reports or analyzing data with Excel.
c) Load: Load this list into the Power BI dataset as it is.
d) Transform Data: This opens the Power Query interface and allows you to do custom transformations.
- Click on Transform Data and you will see the following columns:
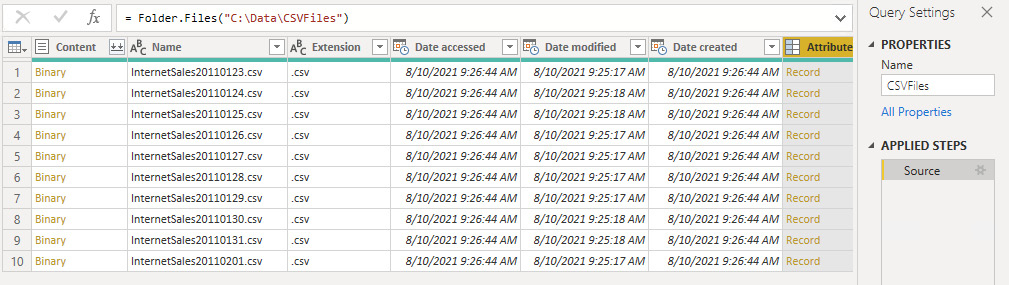
Figure 2.25 – List of files in the Power Query view
From here, you can do one of these actions:
a) Expand a single CSV by clicking on Binary in the Content column:
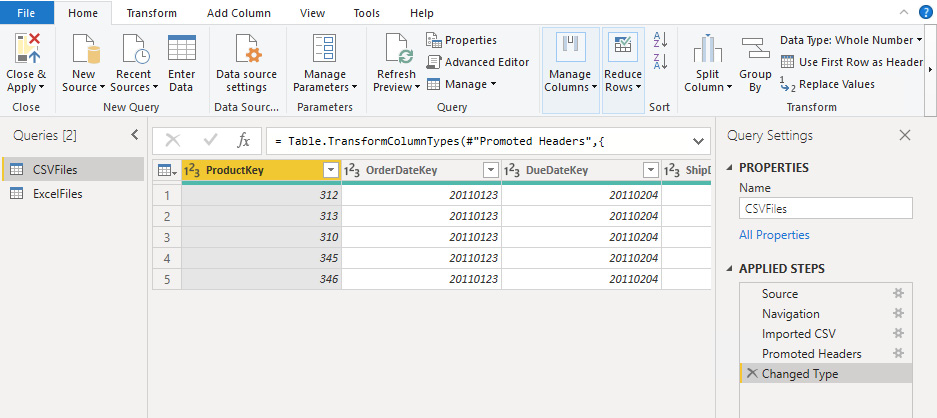
Figure 2.26 – Expanded table
b) Expand the Attributes column with some relevant information:
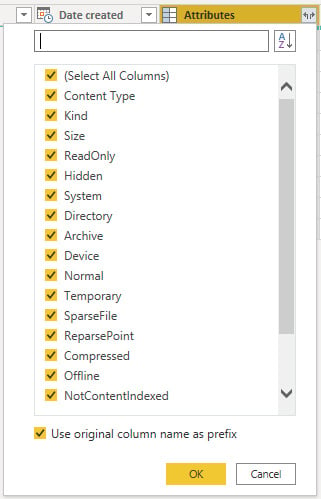
Figure 2.27 – Expand the Attributes column
c) Combine files by clicking on the icon on the right, which means Combine:

Figure 2.28 – The Combine icon on the Content column
Data combination is a concept that will be widely explored in Chapter 5, Combining Queries for Efficiency.
Now we will repeat the same steps but with the other folder containing Excel files:
- The view that opens is the following:
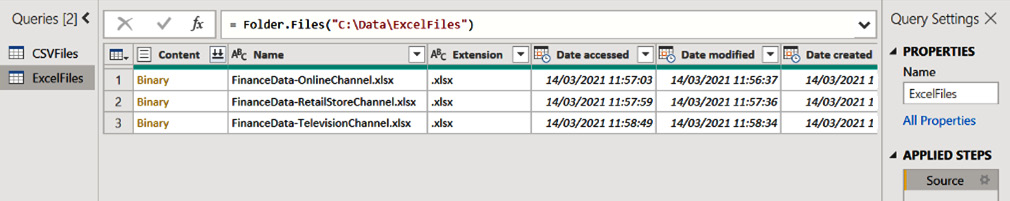
Figure 2.29 – List of Excel files in the Power Query interface
It is very similar to the one we saw previously because you can perform the following actions:
a) If you click on Binary in row 1, you will end up with a table with a list of the sheets contained in the Excel file FinanceData-OnlineChannel. If you click on Table in row 1, you will expand the sheet Sales:
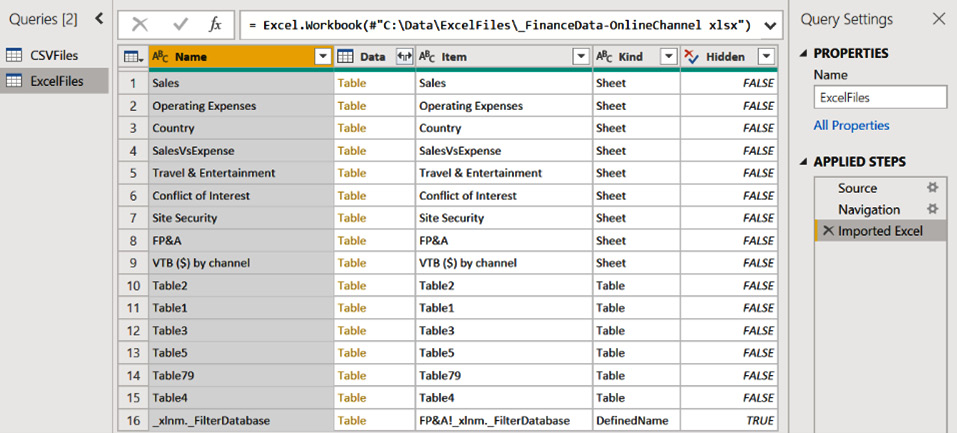
Figure 2.30 – First level of the expanded table
b) If you click on Combine, the following window will pop up:
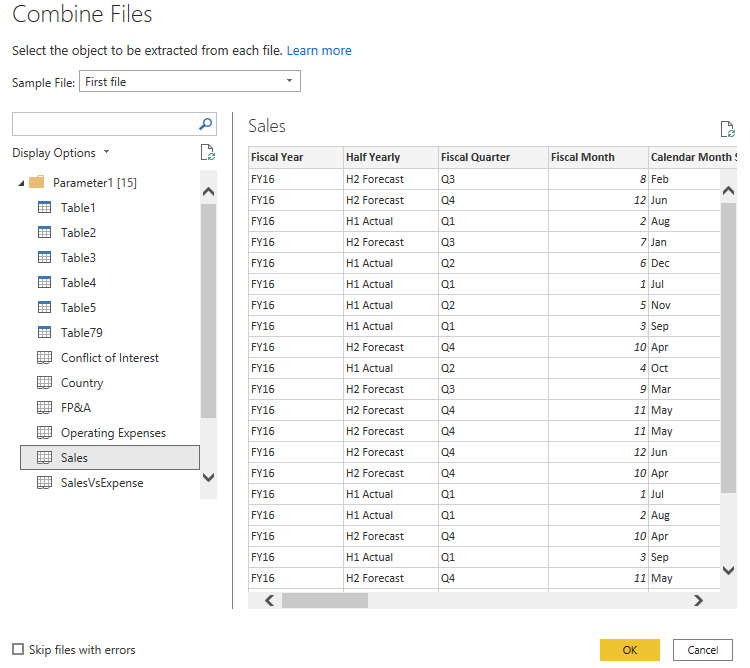
Figure 2.31 – Table preview during the Combine step
This built-in combine function will allow you to append the Sales sheets from three different Excel files. This topic will be widely explored in Chapter 5, Combining Queries for Efficiency.
How it works...
The idea of this recipe was to show you the potential of the folder connector because often users end up connecting multiple times to single files and then perform an append step. This takes time, and it is difficult to maintain when the number of files becomes bigger.
The folder connector allows you to refresh your data and perform all Power Query operations automatically. If you add a file in your folder and click on refresh, you will end up with a final table enriched with data coming from this last file.
Creating a query from a database
This recipe shows how to connect to a database and how tables and views are displayed while selecting which tables to display and work with in Power Query.
You have two generic options:
- Select tables or views as you would see them with a database viewer such as SQL Server Management Studio.
- Retrieve tables by writing SQL statements in a specific section that will pop up.
Getting ready
In this recipe, in order to connect to a SQL database, you need to have an Azure SQL Database instance with AdventureWorks data, database credentials, or access through Azure Active Directory authentication (log in with your Microsoft account).
How to do it...
Once you open the Power BI Desktop application, you are ready to perform the following steps:
- Go to Get data, click on More, and browse for Azure SQL database:

Figure 2.32 - Azure Connectors section
- Enter the following information (expanding Advanced options):
a) Server: Server name
b) Database:
Adventureworksc) Data Connectivity mode:
Importd) SQL statement: This is a SQL view executed using the data source based on two tables in the database. The view is built as a SQL join between
FactResellerSalesandDimSalesTerritory:SELECT s.[ProductKey] ,s.[SalesTerritoryKey] ,s.[SalesOrderNumber] ,s.[SalesOrderLineNumber] ,s.[RevisionNumber] ,s.[OrderQuantity] ,s.[UnitPrice] ,s.[ExtendedAmount] ,s.[UnitPriceDiscountPct] ,s.[DiscountAmount] ,s.[ProductStandardCost] ,s.[TotalProductCost] ,s.[SalesAmount] ,s.[OrderDate] ,p.[SalesTerritoryRegion] ,p.[SalesTerritoryCountry] ,p.[SalesTerritoryGroup] FROM [dbo].[FactResellerSalesXL_CCI] s LEFT OUTER JOIN [dbo].[DimSalesTerritory] p ON s.[SalesTerritoryKey] = [p.SalesTerritoryKey]
- Copy and paste the code in the SQL statement section in order to get this view as the output table you will work on in Power Query:

Figure 2.33 – SQL Server database
- Enter authentication details:

Figure 2.34 – SQL Server database authentication
- After signing in, the output of the SQL statement will pop up as follows:

Figure 2.35 – Table preview
- Click on Transform Data in order to open the Power Query interface:

Figure 2.36 – Data preview in Power Query
- Click on Get data and select the connector Azure SQL Database. In this case, we won't enter a SQL statement, but we will select an existing table in the database:

Figure 2.37 – SQL Server database connector
- After signing in, a preview interface will appear, and you will be able to select the tables that you want to open in Power Query after clicking on OK:

Figure 2.38 – SQL Database Navigator
- You will see on the left a set of queries as an output of connecting directly to the database tables and writing a SQL statement querying the database as you would do with any other database viewing tool:
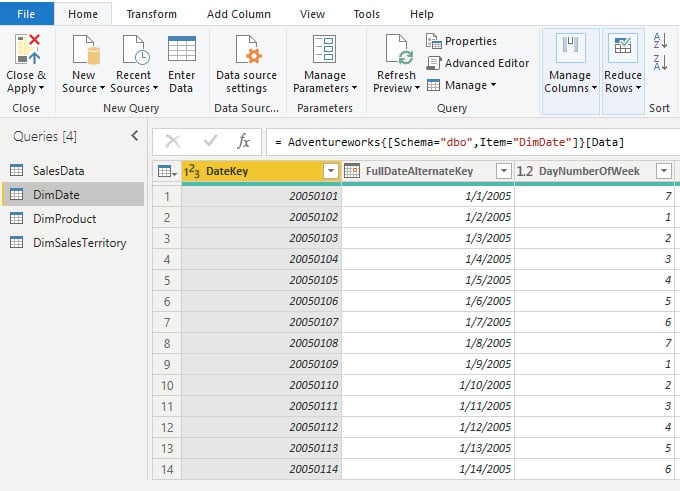
Figure 2.39 – Data preview in Power Query
If you open Advanced Editor for both types, you will notice that if you need to change the SQL code or you have to change the table name, you can do that directly from the Advanced Editor window:
a) The SalesData table's Advanced Editor code where you can see the details of the query run against the data source:
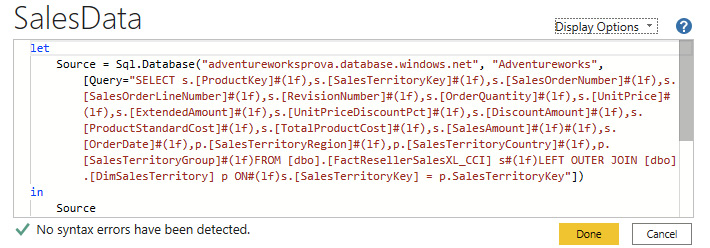
Figure 2.40 – Advanced Editor code for a SalesData query
b) The DimDate table's Advanced Editor code where you can see the details of the connection Source, the database retrieved from the server, Adventureworks, and the table selected from the data source DimDate:
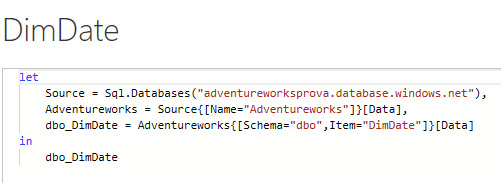
Figure 2.41 – Advanced Editor code for the DimDate Query
How it works...
The Azure SQL Database connector also reflects how other database connectors work. If you connect to Amazon Redshift or an Oracle database, the experience will be very similar. Power Query provides a wide range of options for relational data sources and some of them may need the installation of specific drivers. For example, if you connect to SAP or Oracle, you have to install additional components (for example, in Oracle, the additional components will be the Oracle Data Access Components (ODAC)).
Creating a query from a website
Data is not only located in databases, but also in files, online services, and third-party applications as a growing number of users require the ability to connect to information available on the web. The idea behind the web connector is to allow easy and intuitive information extraction from websites. In this section, we will explore the possibilities of this connector and we will connect to a web page to extract data in an easily readable format.
Getting ready
For this recipe, you need Power BI Desktop and access to the following website: https://www.packtpub.com/eu/all-products.
How to do it...
In this recipe, the idea is to retrieve data from the Packt online catalog. By clicking on the preceding link, you will see the following site:
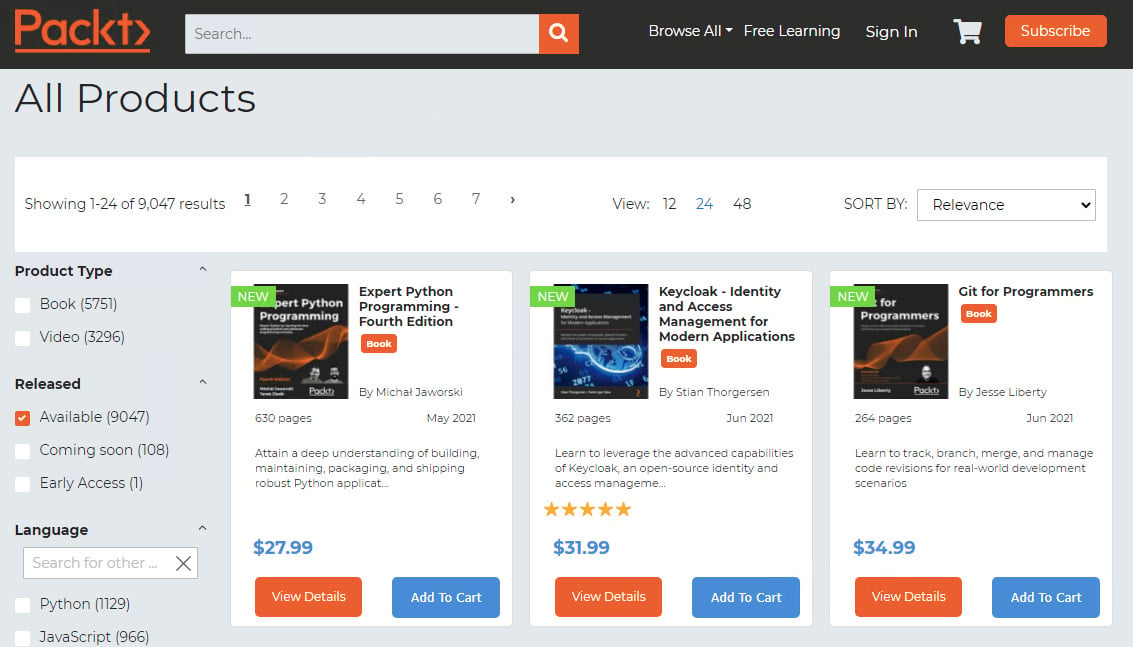
Figure 2.42 – Packt online book catalog
Imagine you want to extract data regarding the books available on this site.
Open Power BI Desktop and follow these steps:
- Go to Get data and click on Web. Insert the link in the URL field:

Figure 2.43 – Web connector
- Authenticate as Anonymous (since it is a public website) and click on Connect:

Figure 2.44 – Web connector authentication
- After authenticating, the following preview window will pop up where, on the left, you can find a list of suggested tables and, on the right, you can see a data preview:

Figure 2.45 – Web tables preview
- If you click on Transform Data, you will open the Power Query interface and then you can rename and clean up your data:
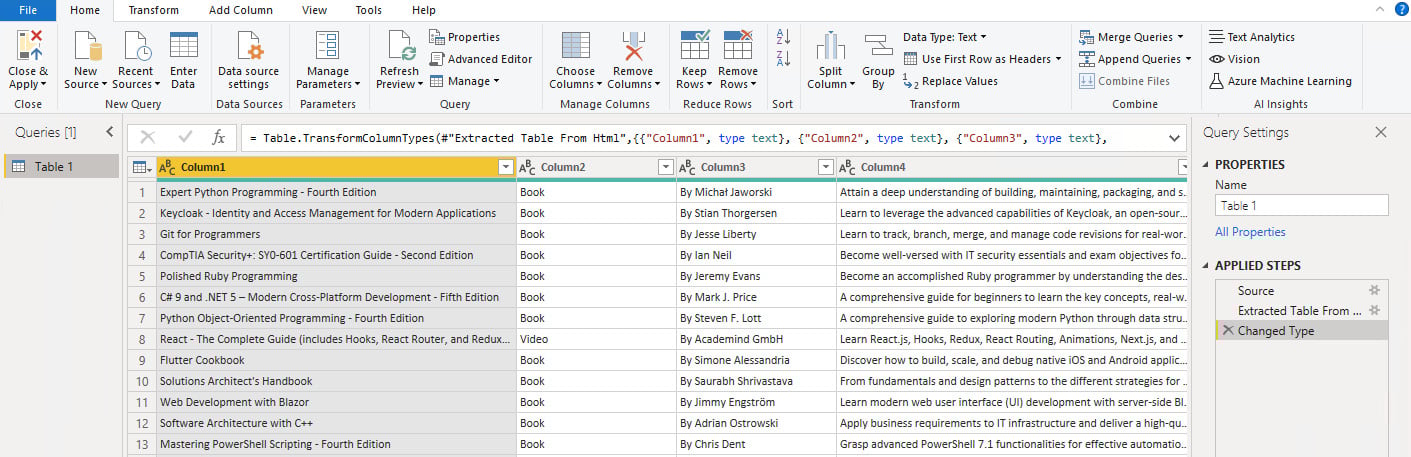
Figure 2.46 – Web data preview in Power Query
We will try another feature to extract data from the website and test an advanced link by inserting filters at the URL level:
- Go to Get data and select the Web connector. Click on Advanced and split the URL https://www.packtpub.com/eu/all-products?released=Available&tool=Azure&vendor=Microsoft into three parts as in the next screenshot and click on OK:

Figure 2.47 – Web connector advanced
- The preview window will pop up. Click on Add Table Using Examples:

Figure 2.48 – Add Table Using Examples button
- Start naming the columns as follows:
a) Title
b) Author
c) Nr. Pages
d) Publication Date
The columns should look like the ones in the following screenshot:

Figure 2.49 – Add Table Using Examples
- Start filling in the first rows of each column and you'll see the other rows populate automatically:

Figure 2.50 – Add Table Using Examples details
- Click on OK and you will generate a table within the Custom Tables section that you can select and load into Power Query:
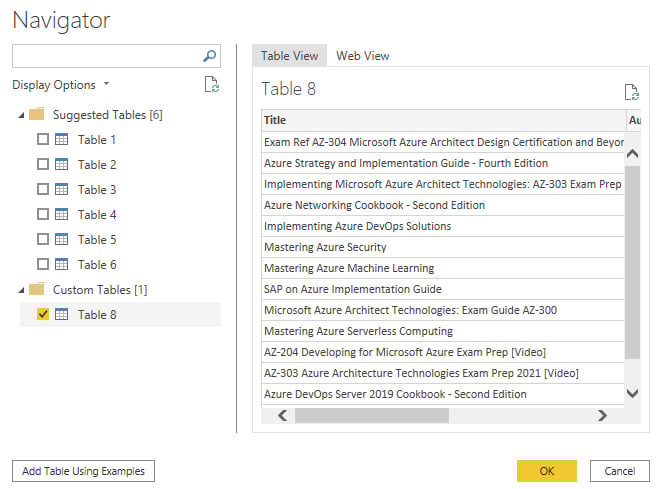
Figure 2.51 – Insert custom table from examples
With these simple steps, it is possible to connect and extract information from a website with a no-code approach. Users can focus on the content of data and not on the process of how to connect since Power Query allows them to do it in a few steps.
How it works...
This web connector not only allows users to connect to data from web pages by leveraging pre-defined tables identified by Power Query, but it also gives the ability to provide data examples from a web page and generate a custom table with relevant information for the user.

