Download code from GitHub
Navigating the UI
In this chapter, you are going to learn the basics of the ZAP graphical user interface (GUI). This will give you a better understanding of how to navigate the GUI and where to find the configuration settings for use later in the upcoming chapters. We have divided the GUI into four major sections for ease of explaining how to navigate and use the GUI. Each segment will describe a section of the default ZAP GUI configuration.
In this chapter, we will cover the following recipes:
- Persisting a session
- Menu bar
- Toolbar
- The tree window
- Workspace window
- Information window
- Footer
- Encode/Decode/Hash dialog
- Fuzzing with Fuzzer
Persisting a session
In this recipe, we are going to go over how to set your ZAP Proxy session persisting. This is useful when you are working on an assessment over multiple days so you can close ZAP and you won’t lose any information.
Getting ready
To be able to go over this recipe, you will need to have ZAP installed on your computer.
How to do it…
Upon running the ZAP application from your host of choice, a dialog box will pop up asking whether you want to persist the ZAP session. In this dialog box, you will have multiple choices for how to persist the ZAP session and where to store those session files in a local database that can be retrieved later.
There are three options to choose from on how you wish to persist and a checkbox for remembering your choice. The following are your options:
- Yes, I want to persist this session with name based on the current timestamp: This option saves the session file using the default filename and location.
- Yes, I want to persist this session but I want to specify the name and location: This option allows you to rename the file and choose the location where the file will be stored.
- No, I do not want to persist this session at this moment in time: When this option is selected, the file is not stored.
- Remember my choice and do not ask me again.: This checkbox can be checked along with any of the three preceding options to make it the default choice.
Let’s see what it looks like visually in the following screenshot:

Figure 2.1 – Persisting the sessions
From here, we’ll move on to describing the top menu bar, as well as other menus contained within it, options, and the top-level toolbar that sits under the main menu bar.
How it works…
Persisting a session will allow you to save your work and quickly come back to what’s been captured and is in progress. Basically, this is how you save your work. There may be other times when testing is temporary and there is no need to persist. Other times, persisting may not be an option you want to do at first as capturing a web application will also start capturing out-of-scope content that isn’t saved to the Sites tree or Context.
Menu bar
The menu bar will help the user to understand general settings and navigate the tool to view, configure, and change settings.
Getting ready
To proceed with this recipe, you need to have ZAP installed and running.
How to do it…
The menu bar is located in the top-left corner of the ZAP application. It consists of the File, Edit, View, Analyse, Report, Tools, Import, Online, and Help menus. I will briefly explain the purpose of each menu section shown in Figure 2.2:

Figure 2.2 – The menu bar settings
How it works…
We will look at each of the menus in the following list:
- File: This menu is for managing the ZAP session. In this menu, you can start a session, continue a session, and more.
- Edit: This menu allows searching requests and responses, finding text, setting Forced User Mode, and managing ZAP’s mode.
- View: This menu provides display options and a method to manage the tabs.
- Analyse: This menu contains an option to open Scan Policy Manager, where you can add, modify, import, export, or delete a scanning policy.
- Report: This menu provides options to generate reports, export messages and responses, export URLs, and compare the current session with a previously saved or imported session.
- Tools: This menu contains ZAP’s tools and options.
- Import: This menu provides options to import different types of data files to ZAP.
- Online: This menu contains ZAP online resources, including ZAP Marketplace, ZAP Frequently Asked Questions, and ZAP Videos.
- Help: This menu provides resources about ZAP, such as Support Info, Check for Updates, and OWASP ZAP User Guide.
There’s more…
Many more features exist, such as shortcut keys, and can be leveraged to quickly navigate OWASP ZAP. Take advantage of these features to help you work in the tool.
Tip
On a Windows system, using the Alt key will activate a shortcut to the top menu. Once triggered, each option in the menu will have the capital letter underlined, which indicates the key to use in conjunction with Alt. For example, to open File, use Alt + F. To open Help, use Alt + H, and so on. You can then use the arrow keys to move around and the spacebar or Enter to select additional suboptions. On a macOS system, using the Command key will accomplish the same thing.
Toolbar
In this recipe, we are going to go over the ZAP Proxy toolbar and what each section of the toolbar does.
Getting ready
To review this recipe, you will need to have ZAP installed on your computer, and it should be started and running.
How to do it…
Looking at the toolbar from left to right, you will see the mode pulldown, as shown in Figure 2.3, which allows you to change modes in ZAP:
- Safe Mode will prevent you from performing any dangerous actions against a target.
- In Protected Mode, you will be able to perform dangerous actions against the application scope.
- Standard Mode is the mode in which you can do anything you want with no restriction from the tool.
- The last mode we have is ATTACK Mode. In this mode, you will start scanning for vulnerabilities with any new target added to the scope.
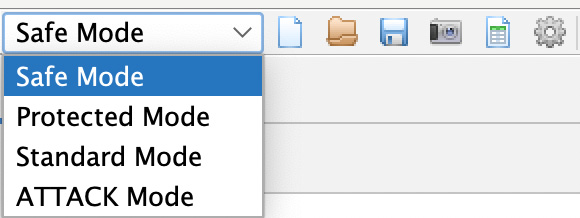
Figure 2.3 – The mode options on the top-level toolbar
The next four icons in Figure 2.3 are options that allow you to save, modify, and edit session information from a target.
The last icon in Figure 2.3, the cogwheel, allows you, the user, to change the settings of all the sections of ZAP proxy. This can also be accessed by going to Tools then Options. We will go into more detail later in the next chapters when we start changing and optimizing each section as we perform attacks.
The next set of icons you find in Figure 2.4, from the top-level toolbar going left to right, allows you to change the ZAP proxy theme to eight different built-in templates:
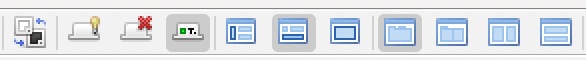
Figure 2.4 – The middle of the top-level toolbar
The default setting is Flat Light, but you can switch to dark mode with Flat Dark, or use any other visual setting from the drop-down list, as shown in Figure 2.5. Keep in mind, any changes to the way that ZAP proxy looks may alter the locations of other settings within the tool. For this book, we are going to use the default settings throughout:
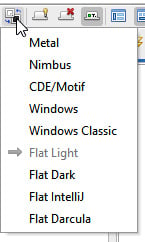
Figure 2.5 – Choosing a theme
As we continue, the next set of icons in the toolbar allows you to view all tabs (tab and lightbulb icon), hide unpinned tabs (tab with red X icon), and show tab icons and hide tab names (tab with a green square and the letter T).
Moving on to the right, the last seven icons allow you to change the ZAP proxy window layout, and they also allow you to expand either the Sites tree window, the Information window, or the Workspace window. For this book, we will be using the default configuration that expands the Information window along the bottom half of ZAP and keeps the Workspace window:

Figure 2.6 – The window layout
In the last section of the top-level toolbar (Figure 2.7), you will see the following:
- Settings (from left to right) that allow you to manage add-on plugins (red/blue/green blocks)
- Check for plugin updates (lightning bolt with blue arrow)
- Show/enable fields (lightbulb)
- Set and customize breakpoints (green/red circle, line/arrow, right arrow, stop sign and red X)
- Scan Policy Manager (control board)
- Apply forced user mode (padlock)
- Enable zest scripting (cassette tape)
- Open the user guide (blue question mark)
- Disable/enable the HUD (green radar)
- Use a preconfigured browser to proxy sites (Firefox logo)
- Report building (spiral notebook)
Each of these will be discussed in further detail in later chapters.

Figure 2.7 – The last section of the top-level toolbar
How it works…
The toolbar features the most common tools used in OWASP ZAP and is intended to help users with setting up and getting comfortable, accommodating different user preferences for testing with the tool. Spend time here getting to know and understand the options available to you.
See also
Open the Help menu and navigate to the OWASP ZAP user guide for more information.
Shortcut
Use F1 to quickly open the information guide.
The tree window
In this recipe, we are going to go over the ZAP Proxy tree window and what each section of the tree window does.
Getting ready
For you to be able to go over this recipe, you will need to have ZAP installed on your computer. It should also be started and running.
How to do it…
In the Sites tree window, ZAP displays the sites that you have accessed and can be tested. ZAP can only attack the sites that are displayed. The sites tree window consists of two tabs: the Sites tab and the Scripts tab (shown once the + sign is selected):
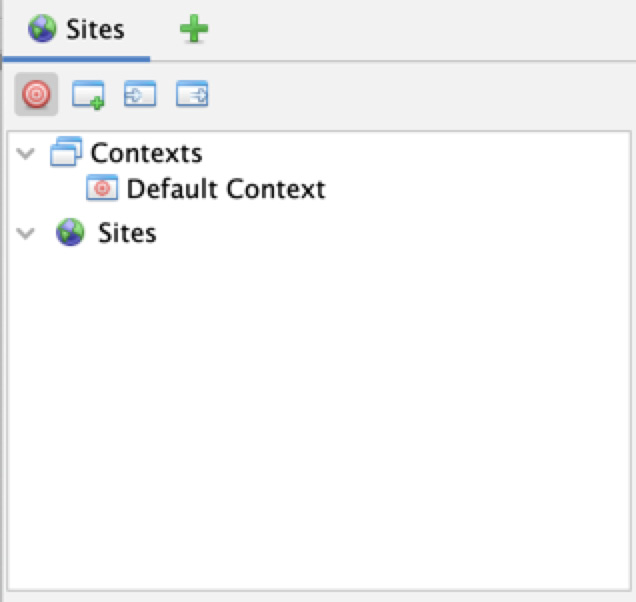
Figure 2.8 – Sites tree
The Sites tab
The Sites tab is where the sites being tested will be displayed. It contains two trees: the Contexts tree and the Sites tree.
The Sites tree is where the tested sites will be listed. ZAP can only attack the sites that are in the sites tree. A unique node will be displayed for sites based on the HTTP request method and the parameter name being used.
In the Contexts tree, you can group URLs together. The best practice is to have a context for each application being tested:
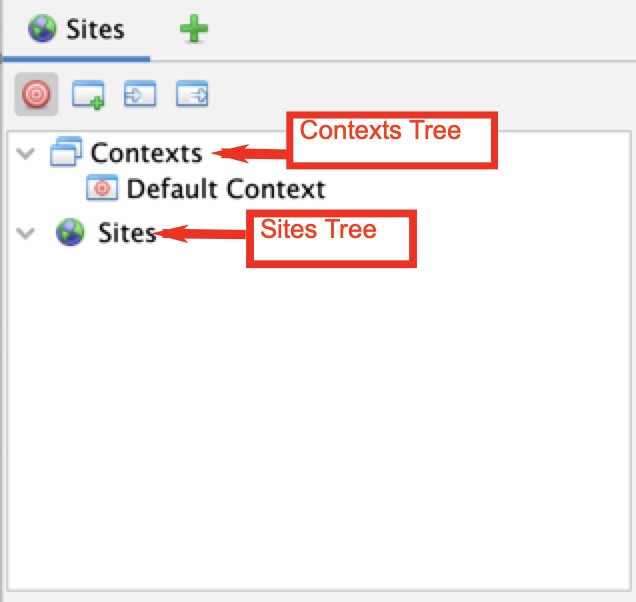
Figure 2.9 – Sites tree
There are also four options that can be used:
- Red target: Displays only the sites that are in scope
- Window with green plus sign: Creates a new context
- Window with white arrow on the left: Imports context
- Window with white arrow on the right: Exports context
The Scripts tab
Once you click on the + icon (Figure 2.10), a new menu pops open allowing you to select the Scripts tab.
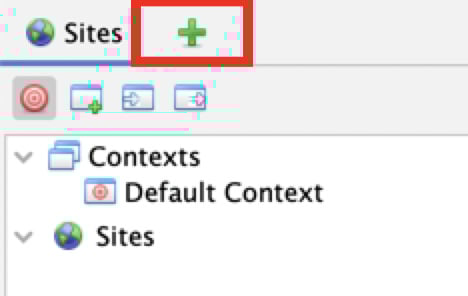
Figure 2.10 – The plus icon
The Scripts tab opens a tree menu with two other optional tabs. The first tab is the Scripts tab, which shows you the scripts that you already have in ZAP, organized by the type of script. The second tab is the Templates tab tree, which contains the templates that can be used to create scripts.
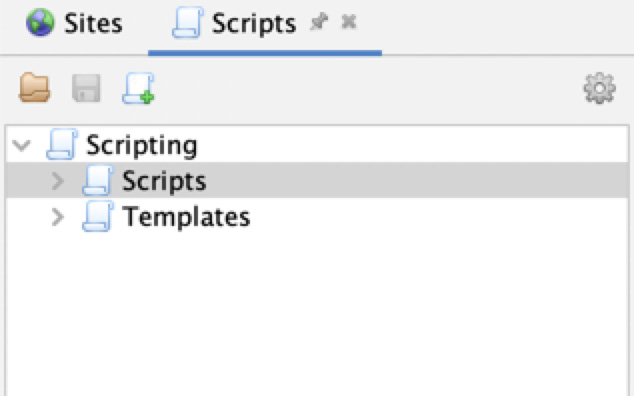
Figure 2.11 – The Scripts tab
In addition to the Scripts and Templates tabs, there are three options in the Scripts tree tab:
- File folder: Used to load scripts from the local file storage
- Floppy disc: Used to save a script to the local file storage
- Scroll with +: Used to create a new script
Another prominent feature of ZAP is the Workspace window. In the next recipe, we’ll look deeper into these options.
How it works…
The entire purpose of the tree window is to help testers know what web applications have been captured, in scope or out of scope, and to quickly view the varying paths discovered during enumeration phases or fuzzing directories. It’s important here to start setting your Sites into Contexts for work later so testing is specific to your scope, as well as cutting back on some of the noise that is generated with websites connecting to other resources.
Workspace window
In this recipe, we are going to go over the ZAP Proxy workspace window and what each section of the workspace window does.
Getting ready
For you to be able to go over this recipe, you will need to have ZAP installed on your computer and also should have it started and running.
How to do it…
In the workspace section of ZAP proxy, you will be able to view requests and responses as well as start scans. The numbers in the following points correspond with the labels in Figure 2.12:
- Quick Start (1): Quick Start shows you a window that allows you to choose whether to start an automated scan or use the manual explorer
- Request and Response tabs (2 and 3): The Request and Response tabs allow you to view the requests and responses from your site sections
- Break (4): The Break tab allows you to change a request and response stop by ZAP breakpoint
- Script Console (5): The Script Console tab opens a window that allows you to modify a newly created script
- Automated Scan (6): The Automated Scan option allows you to start an automated scan on a target
- Manual Explore (7): The Manual Explore option allows you to launch a browser window with a target that has all the settings set up to proxy a target through ZAP
- Learn More (8): The Learn More option gives you details about ZAP and provides links that require the internet to get more detailed information
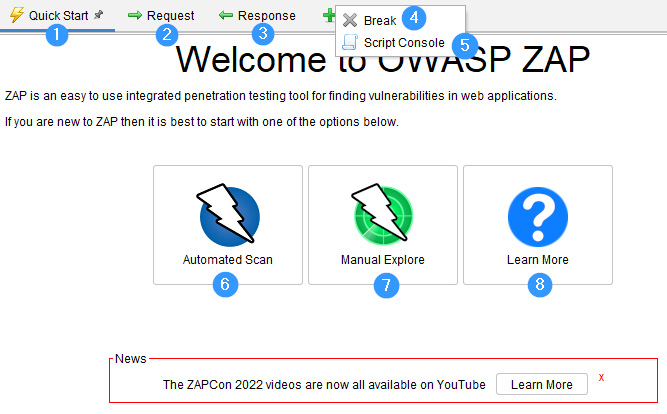
Figure 2.12 – The Workspace window
How it works…
This window kicks off the entire project and is the main feature presented in OWASP ZAP for testing. Unlike other machine-in-the-middle proxying tools, the assessment is captured using this window, whether automated or manually. The content gets populated from here into the information window. We’ll discuss, in the upcoming section, what information this window contains, other tabs or add-ons, and how these can be configured.
Information window
In this recipe, we are going to go over the ZAP Proxy information window and what each section of the information window does.
Getting ready
For you to be able to go over this recipe, you will need to have ZAP installed on your computer and also have it started and running.
How to do it…
The information window contains data about the application being tested. It consists of the History, Search, Alerts, and Output tabs, and other ZAP tools can be added as a tab by using the + icon. The following is a screenshot of the information window:
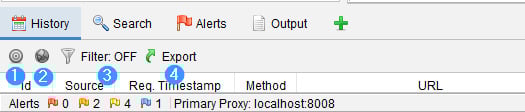
Figure 2.13 – The information window
The History tab
In this tab, ZAP displays all the requests that have been made, starting with the first request. This tab contains four options that can be selected, as shown in Figure 2.13:
- Bullseye (1): The target icon, when selected, shows only the URLs that are in scope.
- Globe icon (2): The globe icon is for Sites selection. This shows only the URLs that are contained in the Sites of the Tree Window. You can only select one or the other for Scope versus Sites.
- Funnel icon (3): This allows you to filter requests based on HTTP verb method, HTTP verb code, Tags, Alerts, and/or URL Regex.
- Export with green arrow (4): This allows you to save the history in CSV format to your host directory of choice.
The Search tab
In this tab, ZAP provides a search mechanism where you can search for regular expressions across all the data or only in URLs, requests, responses, headers, or HTTP fuzz results of the data. The Search tab has eight options. Figure 2.14 showcases the Search tab:
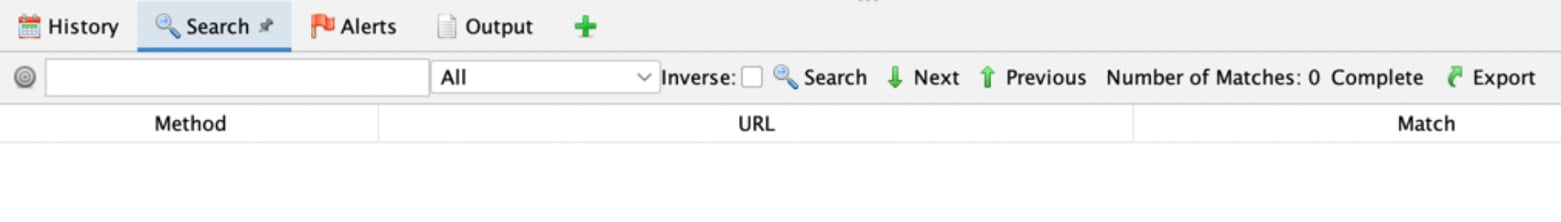
Figure 2.14 – The information window Search tab
The icon highlighted in the following screenshot it for searching through only the URLs that are in scope (Contexts – see Figure 2.10). In order to use this feature, a URL in Sites must be added to Contexts first. Once selected, the target icon will light up red versus being grayed out:
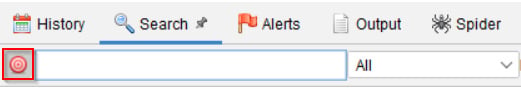
Figure 2.15 – The Contexts button
Scrolling right, the next field that is highlighted in red is the search box input field. This is used to search for content using regular expressions:
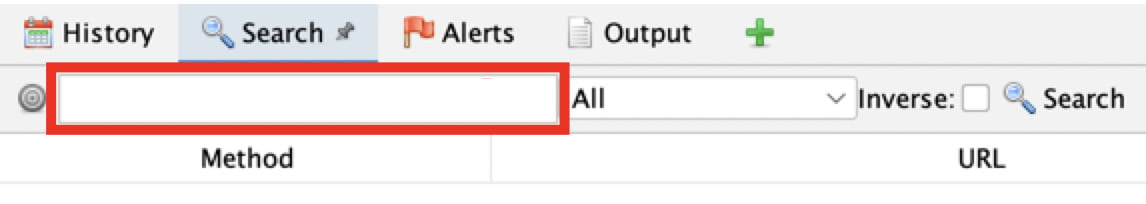
Figure 2.16 – The search input field
Search parameters are based on specific fields and the choices are displayed in a drop-down menu. In this drop-down menu, you can select whether you would like to search, using regular expressions, all the data or just URLs, requests, responses, headers, or HTTP fuzz results:
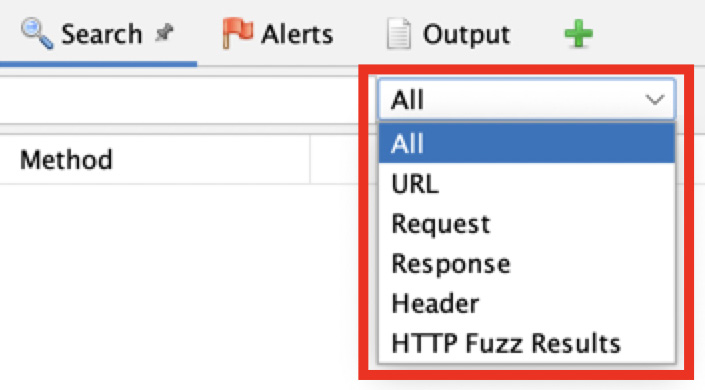
Figure 2.17 – The Search drop-down menu
Next is the Inverse checkbox. When checked, as displayed in Figure 2.18, ZAP will then search for anything that does not contain the regular expression you are searching for:
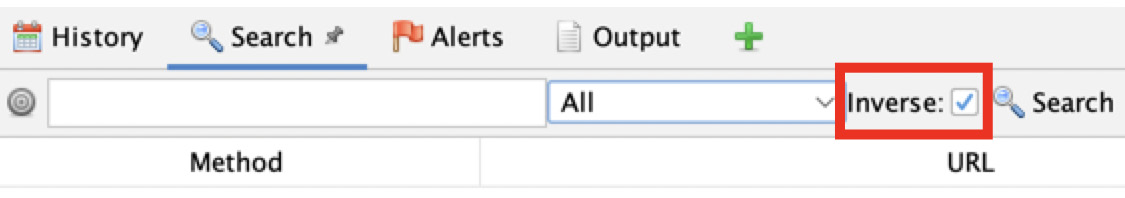
Figure 2.18 – The Inverse checkbox
After entering your text using a regular expression, you need to click the Search button with the magnifying glass. When clicked, the search for the regular expression starts. As an alternative, you can also press the Return or Enter key, depending on your keyboard, to start the search:
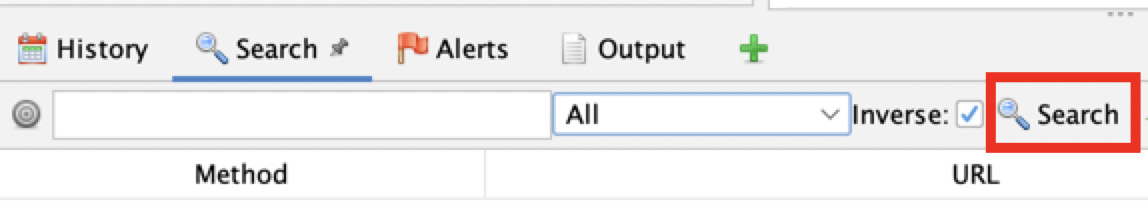
Figure 2.19 – The Search button
Once the search has been completed, you can use the Next or Previous buttons to move the selection to the next or previous item in the search result:

Figure 2.20 – The Next and Previous buttons
There is also a field in the Search tab that gives information about the search results. This will show the number of matches, as the name explains, for how many findings matched the searched regular expression:

Figure 2.21 – The Number of matches indicator
Last, there is an Export button. When clicked, the user will be able to export the search results and save them as a CSV file into the local file storage:

Figure 2.22 – The Export button
The Alerts tab
The Alerts tab is separated into two panes, as shown in Figure 2.23. The left-hand pane contains the alerts found by ZAP, and once an alert is selected, the right-hand pane will then show the alert information, as seen in Figure 2.23. The left pane shows all the alerts or issues found during spidering, active or passive scan, and displays each in a tree view format. The alerts are also ranked by severity, starting with highs and moving downward to informational. The Alerts tab also comes with four options that can be selected.
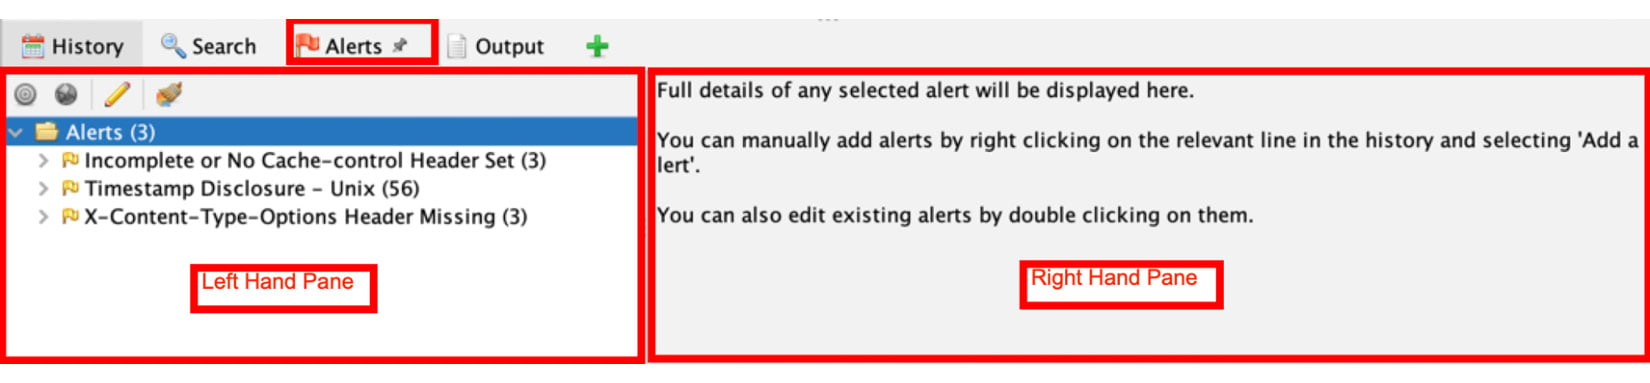
Figure 2.23 – Alerts tab
The following, corresponding to Figure 2.23, is an explanation of these options:
- Contexts (1): Used to show alerts from only URLs in scope.
- Globe (2): Only select alerts from sites contained in the Sites tree window.
- Pencil (3): Allows a user to edit the attributes of an alert.
- Broom with color (4): Delete all alerts button. When clicked, this will display a warning to the user asking them to confirm whether this action is OK or to cancel it. Click OK to remove every alert or Cancel to go back.
The plus (+) symbol
The plus icon can be used to add additional tabs to the information window. The tabs are ZAP tools. The tabs that can be added are AJAX Spider, Active Scan, Automation, Breakpoints, Forced Browse, Fuzzer, HTTP Sessions, OAST, Output, Params, Progress, Spider, WebSockets, and Zest Results. Figure 2.24 shows all these options and a description of each follows:
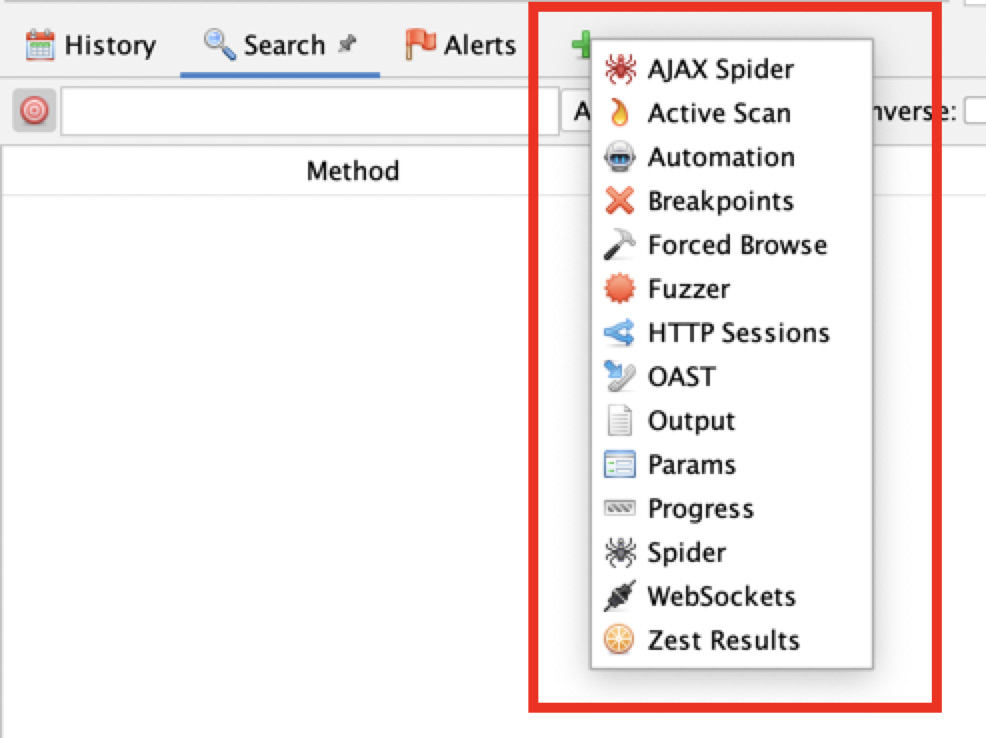
Figure 2.24 – The options of the plug symbol
The following are explanations of these options:
- AJAX Spider: This is used to efficiently and effectively crawl Ajax-based web applications. It creates a proxy for ZAP to talk to Crawljax, which is an open source event-driven dynamic crawling tool. It is recommended to use both the native Spider tool and Ajax Spider when testing an Ajax-based web application.
- Active Scan: This has options to start new scans and see the progress of existing scans. Furthermore, it shows the data of various scans.
- Automation: This allows you to create scripts for automated testing.
- Breakpoints: This manages all the breakpoints set in the current session.
- Forced Browse: In this tab, ZAP allows you to use forced browsing to find directories and files.
- Fuzzer: In Fuzzer, there are options to start new fuzzing tests and see information about a fuzz test that has already started.
- HTTP Sessions: In this tab, ZAP displays the HTTP sessions for the selected site.
- OAST: In this tab, ZAP displays out-of-band messages found.
- Output: In this tab, ZAP will display error messages found on the application. These errors can be used to report a bug to the ZAP team.
- Params: In this tab, ZAP displays the parameters and response header fields of a site.
- Progress: In this tab, ZAP displays the completed or in-progress scanning rules for each host and details for each scanning rule.
- Spider: The Spider tool is ZAP’s native crawler. In this tab, ZAP displays the unique URIs discovered by the Spider tool during the scan. This tab contains three tabs. The first tab displays the URIs discovered, the second tab displays any added nodes, and the third tab displays any Spider messages.
- WebSockets: The tab shows all messages from WebSockets connections.
- Zest Results: This tab will display the result of Zest scans.
How it works…
The Information window is the bread and butter of outcomes from your initial spidering, active or passive scans, fuzzing, or any other add-ons used. This section is where you will want to start paying attention to forming more specific manual attacks and testing the web applications in scope.
There’s more…
There’s a lot of good information to help a tester create good written penetration testing reports by offering references to the OWASP Top 10 or other documents from vendors. This information can be found in the Alerts tab and changes when selecting a specific vulnerability.
Footer
In this recipe, we are going to go over the ZAP Proxy footer section and what each section does.
Getting ready
For you to be able to go over this recipe, you will need to have ZAP installed on your computer and you also need to have it started and running.
How to do it…
In the footer of ZAP proxy, you have three sections: Alerts, proxy status, and scan status. The Alerts section, as seen in Figure 2.25, gives you a quick view of any findings ZAP might have located on the application being tested.
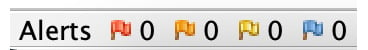
Figure 2.25 – Alerts
Then, we have proxy status, which shows what IP address and port the ZAP proxy is running on:
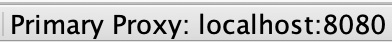
Figure 2.26 – The Proxy information
Lastly, we have a current scan status section, which shows what scan is currently running and what ZAP proxy is doing at any point of the scan process.

Figure 2.27 – The Current Scan Activity count
How it works…
The footer helps to track quick metrics on scanning and alerting data and is a quick way to ensure your established connection hasn’t changed. Consider highlighting this data when building executive reports, if some statistics are needed for a monthly key performance indicator (KPI) report, or even to help track data for vulnerability management.
In the next couple of recipes, we’ll discuss the Encode/Decode/Hash dialog and Fuzzer. We decided to go over these as many users of another prominent proxying tool are used to using these tabs, which are contained in ZAP in a different way. In order for you to carry out the attacks, we will discuss these in depth next.
Encode/Decode/Hash dialog
In this recipe, we are going to go over how to perform encoding and decoding and hashing in ZAP Proxy.
Getting ready
For you to be able to go over this recipe, you will need to have ZAP installed on your computer and also have it started and running.
How to do it…
Encoding is the process of converting data from one form to another, whereas decoding is reversing this conversion. ZAP comes built with a feature to aid its users with a quick way to convert and divert data. In addition to this process, and contained within the same setting, is a feature that creates simple hashes of that data. To get started, select from the menu bar at the top tools, then a little over halfway down, select Encode/Decode/Hash.
Tip
For a shortcut hotkey, on a Windows system, press Ctrl + E. On a macOS system, press Command + E.
When the editor opens, the first thing to note is the input field, which you use to enter the text you wish to encode, decode, and hash, determine illegal UTF-8 bytes, or convert to Unicode. Once you enter the desired text, all the fields will automatically be converted for you.
Next, there is a toolbar that offers a few options. These are as follows:
- Add new tab: Adds a new tab
- Delete selected tab: Removes the currently selected tab
- Add output panel: Adds an output panel to the current tab
- Reset: Resets all the tabs to their default state
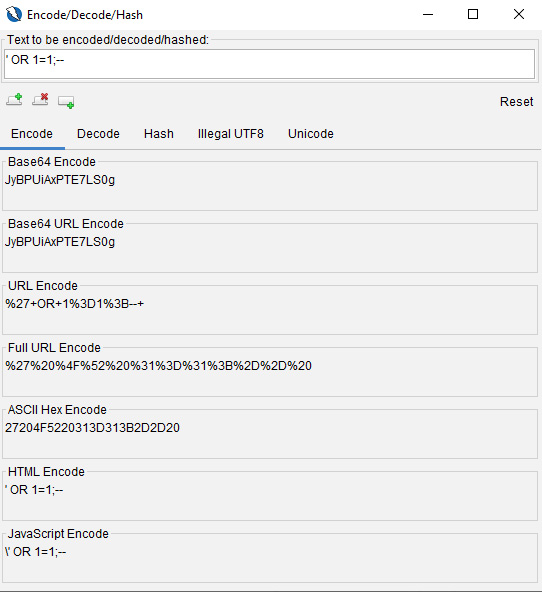
Figure 2.28 – The Encode/Decode/Hash dialog box
As indicated in the Script drop-down menu in the output panel in Figure 2.29, a user can add new fields for comparing data.
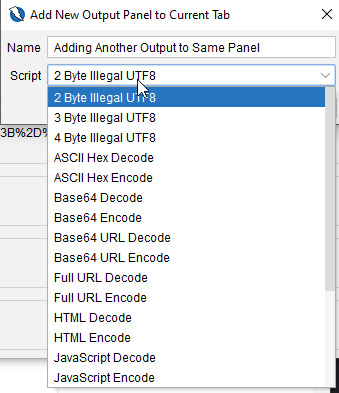
Figure 2.29 – The output panel
With your encoded or hashed script, we’ll move on to fuzzing and how to configure different options for optimizing your approach to web application penetration testing.
How it works…
Using this tool can quickly change operational use with wordlists used in fuzzing applications with attack vectors such as cross-site scripting, SQL injection, and so on. The ability to quickly get a list of different values can help in bypassing poorly implemented validation or encoding in web applications.
See also
For a tool with robust operations for encoding, decoding, and hashing strings, check out CyberChef: https://gchq.github.io/CyberChef/.
Fuzzing with Fuzzer
In this recipe, we are going to go over how to use the Fuzzer in ZAP Proxy and walk through how attackers use tools such as ZAP to brute force a password or attempt to gain access via trial and error using dictionary words in hopes of logging in to an application.
Getting ready
For you to be able to go over this recipe, you will need to have ZAP installed on your computer and also have it started and running. You will also need to run Juice Shop as shown in Chapter 1.
How to do it…
For the unaware, fuzzing is a term referring to a technique/automated process that submits a multitude of invalid or unexpected data points to a target to analyze the results for potentially exploitable bugs. The idea is to fuzz any input using built-in sets of payloads, any optional add-ons, or via custom scripts. In ZAP, this can be achieved in a few ways:
- Click the green + in the information window after the other add-ons (Alerts, Spider, and so on)
- Right-click a request in one of the tabs (Sites, History, and so on) and select Attack / Fuzz…
- Highlight a string in the headers or body of a request tab, right-click, and then select Fuzz…
- Select Tools / Fuzz… in the menu bar and select the request to fuzz
Tip
The shortcut hotkey is Ctrl + Alt + F.
To get started, once you’re on the information window of the Fuzzer add-on, click New Fuzzer to bring up any currently captured sites (see Figure 2.30) and their requests that come from a Spider scan:
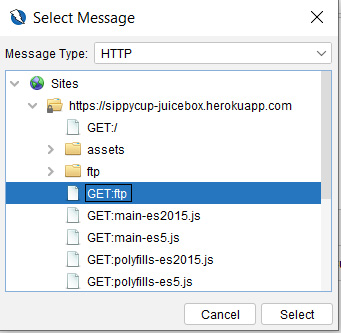
Figure 2.30 – The Fuzzer Select Message window
Once a request is selected, a new dialog window opens. In this window, you have several tabs to configure the fuzz. We’ll break each down in the following sections.
The Fuzz Locations tab
This is the main tab where you highlight the string of choice to begin fuzzing. To understand the windows you’re looking at, note that the top-left side of the dialog box showcases the header text, while the bottom left shows the body text. The right side of the screen shows the fuzz locations from what was added to the selected string(s) in the header. This location will be noted along with the number of payloads and processors. Furthermore, above the headers, you have a couple of dropdowns for the header and body text, as well as changing how you view the left dialog boxes, and an Edit feature. Edit allows you to modify the text within the header.
Important note
Editing the header string will automatically remove all the fuzzers you added.
To get started, highlight the specific area of the string, and click Add… on the right-hand side. This will open a new Payloads dialog box, and you will want to select Add… again to open another dialog box to select the type. The Type field has the Empty/Null, File (where you’d be adding a file from your host system directory), File Fuzzers (which consists of various payloads, that is, buffer overflow cramming, XSS exploits, director lists, and so on), Json (for JSON inputs), Numberzz (from 0 to 10 in increments of 2), Regex (with a number of payloads), Script, and Strings options:
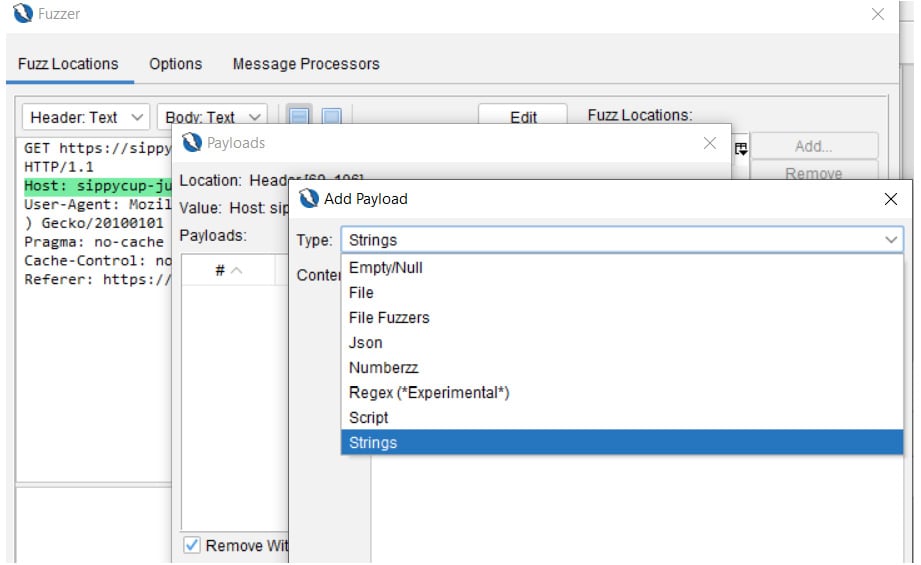
Figure 2.31 – Payloads | Add Payload
Another feature within Payloads is Processors, as you can see in Figure 2.32. This allows you to change and process the current payload into a different type, such as converting it into Base64-encoded format. You can add several types, then select Add… and OK. This is a way to encode, decode, and hash the fuzzing payload prior to starting the fuzzer.
In addition, processors can be applied to either a specific fuzzing payload (outlined in red) or to the entirety of the string selected (outlined in blue) shown in Figure 2.32. There’s also a counter to show how many processors have been applied:
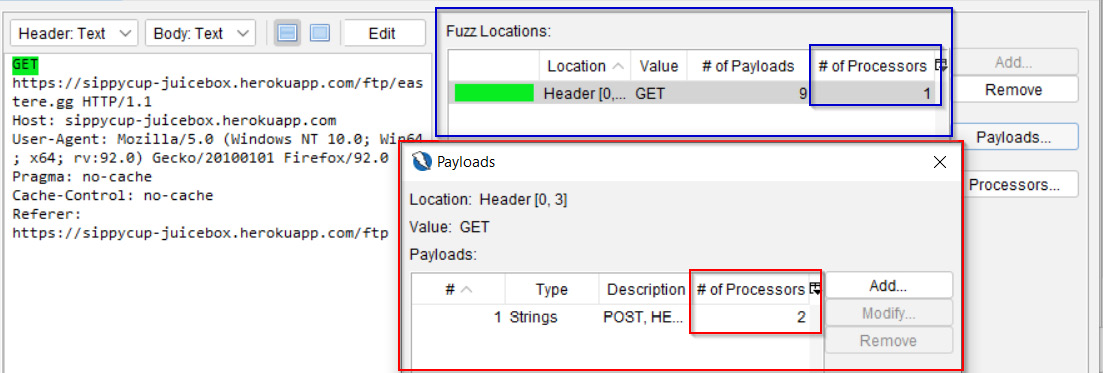
Figure 2.32 – Processors
Once a processor type has been selected, click Add at the bottom of the dialog box, then click OK. This will add the payloads to Fuzz Locations, as seen in Figure 2.32. Once you have everything entered as desired, select Start Fuzzer in the bottom-right corner. Once fuzzing is complete, the information window will display the results:
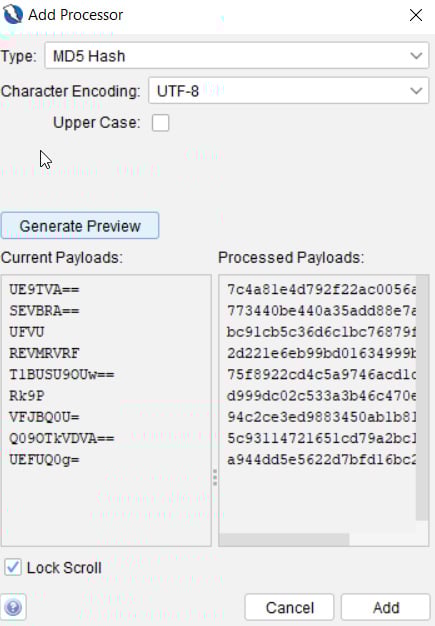
Figure 2.33 – Add Processor
From left to right, in Figure 2.34, the results that appear in the information window will showcase the task number, message type, HTTP status (Code), a reason, such as Forbidden or Bad Request, the round trip time (RTT), the size of the response header/response body, the highest alert, the state, and the payloads used. In addition, the results can be exported to a CSV spreadsheet. Last to note is the Progress drop-down menu. This keeps track of every fuzzed string and allows you to switch between the results.
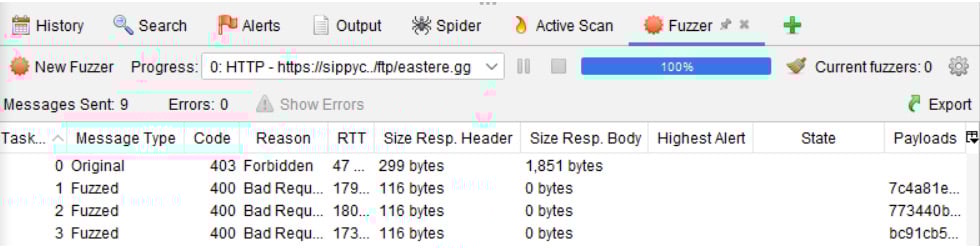
Figure 2.34 – The Fuzzer Information window
The Options tab
When starting a new fuzzer, you’ll have an Options tab (Figure 2.35). This tab lets you configure more options for the fuzzer:
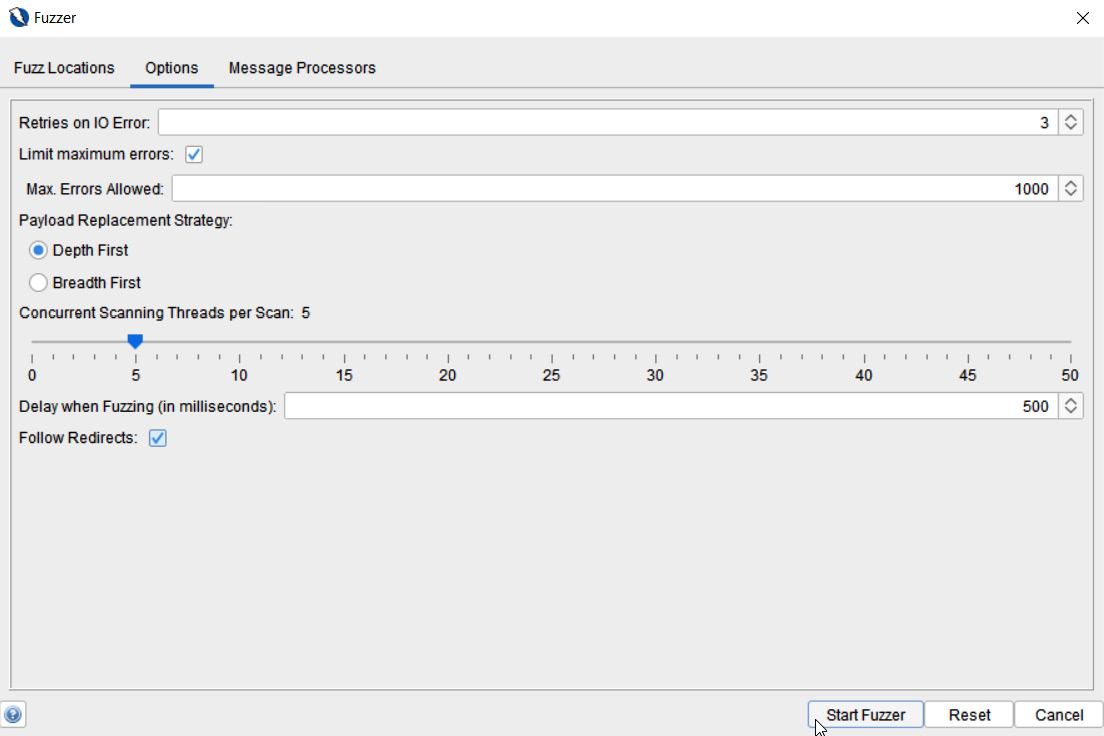
Figure 2.35 – Fuzzer Options
- Retries on IO Error: Determines how many retries the fuzzer will do when input/output errors occur.
- Max. Errors Allowed: This will stop the fuzzer if the number of errors reaches this number.
- Payload Replacement Strategy: Controls the order for multiple payloads lists repeated. The two options are as follows:
- Depth First
- Breadth First
- Concurrent Scanning Threads per Scan: The number of threads a scan will conduct simultaneously. Increasing this number will speed up the scan but may stress the computer that ZAP is running on or the target.
- Delay when Fuzzing (in milliseconds): Creates a delay between requests to the target, which helps avoid being blocked or if the target has restrictions against too many requests.
- Follow Redirects: Will continue fuzzing by following the next request.
The Message Processors tab
The last tab, as shown in Figure 2.36, is the HTTP Message Processors tab, which can access and change the messages being fuzzed, control the process, and interact with the ZAP GUI:
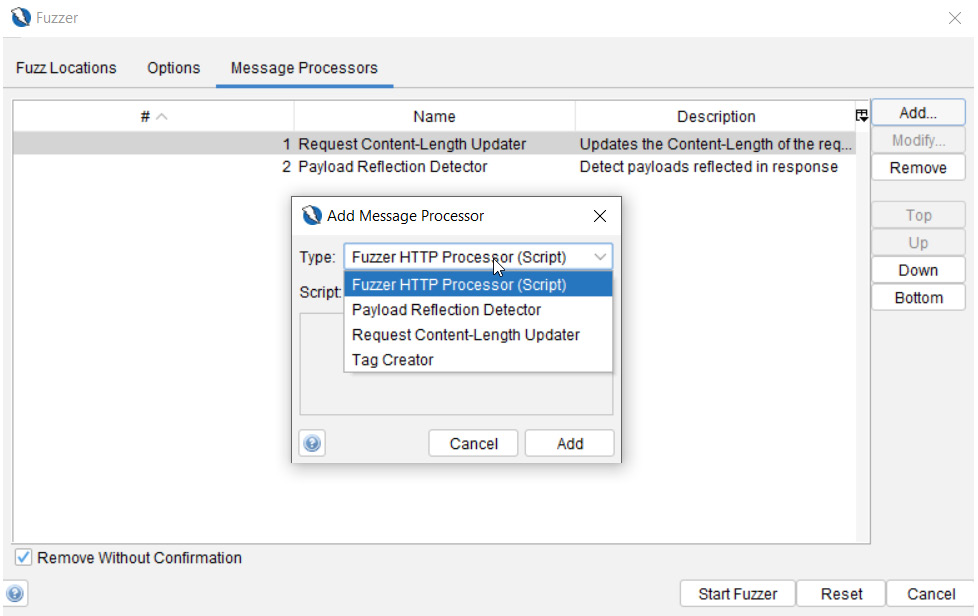
Figure 2.36 – Fuzzer Message Processors
Here are the types of message processors to know about. Keep in mind, a few of these will not work or be available, depending on the type of response seen or whether scripts are already built:
- Anti-CSRF Token Refresher: Allows a refresh of anti-CSRF tokens in a request but must be detected by ZAP to be used in this processor. Automatically added if an anti-CSRF token is detected.
- Fuzzer HTTP Processor (Script): Allows you to select enabled scripts if scripts have been added to ZAP.
- Payload Reflection Detector: This feature will let you know if a payload was found and uses a symbol (yellow sun icon) with the word Reflected to indicate this as well. This process is automatically added.
- Request Content-Length Updater: Updates or adds the content-length request header with the length of the body. This process is automatically added.
- Tag Creator: Adds custom tags based on content in the response to the state column in the results.
- User Message Processor: Fuzz a user. Users must exist to be able to select and add this processor.
Congratulations! You are now armed with an in-depth understanding of all the features, layouts, tabs, trees, and options of ZAP.
How it works…
The processors are ways to add more customization to fuzzing and increase the depth and obfuscation, or help bypass those pesky web application firewalls (WAFs) for an assessment against your target.
There’s more…
Using operating systems such as Kali or Parrot will come with wordlists already installed, and for other ways to generate wordlists, utilize tools such as CeWL, which scrapes words from a targeted web application, or John the Ripper, which comes with options for customizing wordlists.
See also
Check out the GitHub pages for great sources for obtaining already-built wordlists to quickly add to ZAP when it comes to fuzzing.