


HTML5 Canvas is an element that provides the user with a workspace of a desired size for drawing. The Canvas API contains a rich set of drawing functions that can be accessed through JavaScript. The canvas element can be styled using CSS (Cascaded Style Sheet). CSS styling can improve performance and add interesting effects.
Thus, HTML5 Canvas programming can be done with the support of JavaScript and CSS.
Why HTML5 Canvas?
HTML5 Canvas is fully interactive.
Every object drawn on canvas can be animated.
Canvas is flexible enough to let you draw dynamic graphics. Also it allows adding audio and video.
All major browsers support canvas. However, the support and implementation differs from browser to browser.
It is a standard open technology.
Canvas is portable. Once created, an HTML5 Canvas application can run on almost all devices.
To develop Canvas programs you just need a code editor and a browser. You can use sublime (available on www, Text, or HTMLPad), and you can test your code on Google Chrome or Firefox. You can find sublime text at http://www.sublimetext.com/ and HTMLPad at http://www.htmlpad.net/. However, for the recipes in this book I have used Notepad.
HTML5 Canvas can be used for gaming, advertising, data representation, education and training, and art and decoration.
This chapter explains how to draw lines, arcs, curves, and text. These basic building blocks are further combined to create colorful and beautiful drawings. In this chapter we will cover:
Drawing lines
Drawing horizontal, vertical, and assorted lines
Drawing joins
Drawing arc1
Drawing arc2
Drawing a quadratic curve
Drawing a rainbow
Drawing a Bezier curve
Drawing a flag
Drawing text
Drawing 3D text with shadows
Adding shadows to objects
Drawing a house
The most basic shape in drawing is a line. Here you will see the various types of line that can be drawn. Also, you will see how different effects can be given to them.
This is the output of our first recipe:

This recipe is made by undertaking the following steps:
Detect the canvas element.
Write the initiating function to create the canvas and its context.
Call the function to draw the line specified with different attributes.
The final code looks as follows:
<html>
<head>
  <title>Simple Lines</title>
    <script type="text/javascript">
      var can;
      var ctx;
      function init() {
        can = document.getElementById("MyCanvasArea");
        ctx = can.getContext("2d");
        drawLine(30,30,300,30,20,"orange","butt");//default cap style
        drawLine(30,80,300,80,20,"crimson","round");
        drawLine(30,130,300,130,20,"teal","square");
      }
      function drawLine(xstart,ystart,xend,yend,width,color,cap)
      {
        ctx.beginPath();
        ctx.strokeStyle=color;
        ctx.lineWidth=width
        ctx.lineCap=cap;
        ctx.moveTo(xstart,ystart);
        ctx.lineTo(xend,yend);
        ctx.stroke();
        ctx.closePath();
      }
    </script>
</head>
<body onload="init()">
<br/><br/>
  <center>
    <canvas id="MyCanvasArea"
width="320"
height="200"
style="border:3px solid brown;">
Your browser doesn't support canvas
    </canvas>
  </center>
</body>
</html>To set up the canvas you need the canvas element, which is embedded in the body tag of the code. The Canvas created will be of 320 x 200 and will have a brown colored border. The border color and the dimensions are specified through the properties of the canvas element. If your browser doesn't support canvas then it will display Your browser doesn't support canvas as mentioned in the canvas element of the HTML code.
The onload property is responsible for invoking the init() function to initialize the canvas and context as soon as you run the program:
<body onload="init()">
<canvas id="MyCanvasArea"
width="320"
height="200"
style="border:2px solid brown;">
</body>
The init() function, which is a part of <script> tag, has two parts:
Detecting the canvas
Calling the relevant functions
The following snippet shows how to do it:
      function init() {
        can = document.getElementById("MyCanvasArea");
        ctx = can.getContext("2d");
        drawLine(30,30,300,30,20,"orange","butt");  //default cap style
        drawLine(30,80,300,80,20,"crimson","round");
        drawLine(30,130,300,130,20,"teal","square");
      }
The purpose of the canvas API functions used in the preceding snippet are briefed here:
getElementById(): This function returns the element that has the ID attribute with the specified value. In our case the ID is MyCanvasArea. The function returns a null value if the ID doesn't exist. If there are two elements with the same ID then it returns the first element from the source code.getContext(): This function returns a 2D drawing context on the canvas. It returns a null value if it is not supported by the browser.
The next part of init() calls the drawLine() function to draw a line on the canvas. The parameters/arguments passed to the function are the two coordinates of the line to be drawn, the width, the color, and the cap style.
The following is the function definition:
      function drawLine(xstart,ystart,xend,yend,width,color,cap)
      {
        ctx.beginPath();
        ctx.strokeStyle=color;
        ctx.lineWidth=width;
        ctx.lineCap=cap;
        ctx.moveTo(xstart,ystart);
        ctx.lineTo(xend,yend);
        ctx.stroke();
        ctx.closePath();
      }
The following functions of the canvas API are used in here:
beginPath(): Starts a new path by emptying the list of sub-paths. It resets the current path. This function can be called whenever new paths need to be created.moveTo(x,y): Moves the starting point of the new sub-path to the(x,y)coordinates. This is like placing your pencil at a particular point from where you want to start drawing.lineTo(x,y): Connects the last point in the sub-path to the(x,y)coordinates with a straight line. This function actually doesn't draw the line, it just connects it.stroke(): Strokes the given path with the stroke style using the non-zero winding rule. This function actually draws the path.closePath(): This is the function to end a path.
The following properties of the canvas API are used here:
strokeStyle: This defines the color in which the strokes are to be applied.lineWidth: This defines the thickness of the line.lineCap: This defines the cap style. There are three types, namely butt, round and square. The butt style is default. For round and square styles, extra length is added on both sides of the line. This is 1/2 of the width specified by you. You can see the difference in length of the first and last two lines shown in the output.
The cap style has an impact on the display. Notice the length of the first and the next two lines in the output. The next two lines have a longer length because of their cap styles.
The butt value means that no additional line cap is added.
The round value means that a semi-circle with the diameter equal to the lineWidth (in our example it is 20) is added on both sides.
The square value means that a rectangle of length the same as lineWidth and width the same as half of the lineWidth is added on both sides of the line.
The effects of butt and square look similar; however the lengths of lines differ.
You can create your own functions for common lines of code wherever you find it necessary. For example, the following two lines of code can be converted into a function that returns the canvas context:
can = document.getElementById("MyCanvasArea");
ctx = can.getContext("2d");
Also, depending on the return value of getContext(), you can detect whether your browser supports canvas.
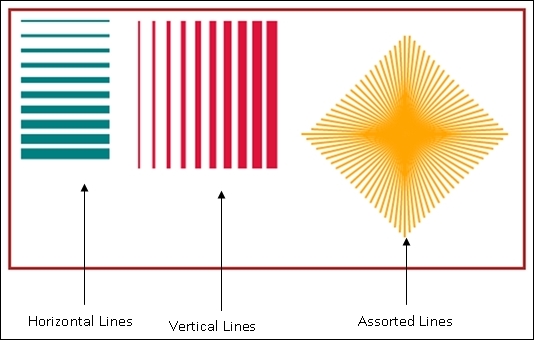
The output of our second recipe looks like this:
A small change in the previous example builds our new recipe.
You need to do the following to build this recipe:
Add three different functions named
drawHorizontalLines(),drawVerticalLines(), anddrawAssortedLines()to the<script>tag.Call these functions through the
init()method, the same way as thedrawLine()function was called.
After making the necessary changes, our recipe looks like this:
<html>
<head>
  <title>Lines Lines and More Lines</title>
    <script type="text/javascript">
      var can;
      var ctx;
      function init() {
        can = document.getElementById("MyCanvasArea");
        ctx = can.getContext("2d");
        drawHorizontalLines();
        drawVerticalLines();
        drawAssortedLines();
      }
      function drawLine(xstart,ystart,xend,yend,width,color)
      {
        ctx.beginPath();
        ctx.strokeStyle=color;
        ctx.lineWidth=width;
        ctx.moveTo(xstart,ystart);
        ctx.lineTo(xend,yend);
        ctx.stroke();
        ctx.closePath();
      }
      function drawHorizontalLines()
      {
        xs=10;  ys=10;xe=100; ye=10;
        c="teal"; w=2;
        //draw 10 lines
        for(i=1;i<=10;i++)
        {
          drawLine(xs,ys,xe,ye,w++,c);
          ys+=15;  //change through y axis
          ye+=15;
        }
      }
      function drawVerticalLines()
      {
        xs=130;  ys=10;xe=130;ye=160;
        c="crimson";w=2;
        //draw 10 lines
        for(i=1;i<=10;i++)
        {
          drawLine(xs,ys,xe,ye,w++,c);
          xs+=15; //change through x axis
          xe+=15;
        }
      }
      function drawAssortedLines()
      {
        //center point
        xcenter=400;ycenter=125;  xe=xcenter-100;ye=ycenter;
        c="orange";  w=2;
        //Second quadrant
        for(xe=xcenter-100;xe<=xcenter;xe+=5,ye-=5)
          drawLine(xcenter,ycenter,xe,ye,w,c);
        //first quadrant
        for(ye=ycenter-100;ye<=ycenter;xe+=5,ye+=5)
          drawLine(xcenter,ycenter,xe,ye,w,c);
        //fourth quadrant
        for(xe=xcenter+100;xe>=xcenter;xe-=5,ye+=5)
          drawLine(xcenter,ycenter,xe,ye,w,c);
        //third quadrant
        for(ye=ycenter+100;ye>=ycenter;xe-=5,ye-=5)
          drawLine(xcenter,ycenter,xe,ye,w,c);
      }
    </script>
</head>
<body onload="init()">
  <br/><br/>
  <center>
  <canvas id="MyCanvasArea" height="260" width="520" style="border:3px solid brown;">
  </canvas>
  </center>
</body>
</html>
For convenience, the function names and their calls shown through init() are made in bold to help you to understand where to make changes in the previous recipe.
The basic functions moveTo() and lineTo() remain the same. However, three different functions are created, which contain loops to repeatedly call the previously mentioned line drawing function.
In the drawHorizontalLines(),the lines are drawn along the x axis. In each iteration, the width of the line increases, thereby showing a gradual increase in thickness.
In the drawVerticalLines() function, the lines are drawn along the y axis.
The function drawAssortedLines() has four different loops drawing lines in four different quadrants. The drawLine() function is used in the loop and, in every iteration, the parameter values for the function change to draw lines starting from different coordinates. For instance, in the first loop, the value of xe starts from 300, which is less than the value of xcenter. So, we start drawing from the left side of the center. On every iteration, the value of xe increases and the value for ye decreases by 5. Thus, the starting point of a line moves a bit inwards and a bit upwards. The line is drawn from (xe,ye) to (xcenter,ycenter). The quadrants are filled in, in an anticlockwise direction, starting from the 2nd quadrant.
When you apply the concept of quadrants, bear in mind that the center is (400,125) and not (0,0).
All three functions mentioned previously are called within init().
This topic focuses on the lineJoin property of the context object.
The lineJoin property allows you to join two lines with three different effects. They are:
bevel (default)
round
miter
The effect of lineJoin can be easily observed in the output of our new recipe:

Again a small change in our first recipe makes this recipe.
Replace the drawLine() function with drawJoinedLines() and then call this function (three times) from init().
The recipe looks like this:
<html>
<head>
  <title>Simple Canvas</title>
    <script type="text/javascript">
      var can;
      var ctx;
      function init() {
        can = document.getElementById("MyCanvasArea");
        ctx = can.getContext("2d");
        drawJoinedLines(50,150,50,50,20,"blue","round");
        drawJoinedLines(50,300,50,200,20,"red","miter");
        drawJoinedLines(50,450,50,350,20,"green","bevel");
      }
      function drawJoinedLines(xstart,ystart,xnext,ynext,width,color,jointype){
        ctx.beginPath();
        ctx.lineJoin=jointype;
        ctx.lineCap="square";
        ctx.strokeStyle=color;
        ctx.lineWidth=width;
        x1=xstart;  y1=ystart;  x2=xnext;  y2=ynext;
        ctx.moveTo(x1,y1);
        for(i=1;i<=20;i+=1){
          ctx.lineTo(x2,y2);
          if(i%2==1){    //if 1 line is drawn, move along x axis
            x2=x2+50;
          }
          else{
            if(y2>ynext)
              y2=ynext;
            else
              y2=y2+100;
          }
        }
        ctx.stroke();
        ctx.closePath();
      }
    </script>
</head>
<body onload="init()">
  <br/><br/>
  <center>
  <canvas id="MyCanvasArea" height="500" width="600" style="border:3px solid brown;">
  </canvas>
  </center>
</body>
</html>Here, the main function, which does the job for us, is drawJoinedLines(). This function is called through the init() function three times. Obviously the output shows three different ways in which the lines are joined.
Outside the for loop we move to the (x1,y1) coordinates to start the drawing. The function lineTo() mentioned in the loop draws a line between (x1,y1) and (x2,y2). In the first iteration, the vertical line is drawn and the end points for the next line are set. If the line to be drawn is horizontal, we increment the value of x2 by 50, thus moving along the x axis. If the line to be drawn is vertical, then we increment the value of the y coordinate by 100 moving vertically downwards. The loop executes 20 times, drawing 10 vertical and 10 horizontal lines.
The function drawJoinedLines() is called three times from init(), each time specifying the different start point and join type. The effect of the joins can be seen in the output.
There are two different functions that allow drawing an arc. One of the functions is arcTo(xctrl,yctrl,xPos,yPos,radius).
You will see the second function in the next recipe. The arcTo() function accepts two coordinates and a radius. To use the arcTo() function work, it is necessary to first mark the position from where the arc is to be drawn. This is done by calling the moveTo() function, the same way as we do for drawing a line (refer to the lineTo() function).
The output of our arc recipe is as follows:

The recipe is as follows:
<html>
<head>
<title>Basic Arc</title>
<script>
  function init()
  {
  can = document.getElementById("MyCanvasArea");
  ctx = can.getContext("2d");

    drawArcMethod1(60,150,100,80,140,150,25,"blue");

    //function to draw curve by method 1
    function drawArcMethod1(xPos,yPos,xctrl,yctrl,xend,yend,radius,linecolor)
    {
      ctx.strokeStyle = linecolor;
      ctx.fillStyle="red";
      ctx.lineWidth   = 8;

      ctx.beginPath();
      ctx.moveTo(xPos,yPos);
      ctx.arcTo(xctrl,yctrl,xend,yend,radius);
      //ctx.fill();
      ctx.stroke();
    }
  }
</script>
</head>
<body onload="init()">
<canvas ID="MyCanvasArea" width="300" height="300" style="border:2px solid black;">
  your browser doesn't support canvas
</canvas>
</body>
</html>In our recipe, the syntax to draw the arc is as follows:
ctx.moveTo(xPos,yPos);
ctx.arcTo(xctrl,yctrl,xend,yend,radius);
On the canvas, the arc is drawn by following these steps:
Move to a coordinate
(xPos,yPos).Draw an imaginary line between
(xPos,yPos)and the control point(xctrl,yctrl).Then draw an imaginary line between
(xctrl,yctrl)and the end coordinate(xend,yend), thereby generating a cone shape.Draw an imaginary circle with the given radius between the two mentioned lines in such a way that the two lines are tangents to the circle at two different points.
Here is a diagrammatic representation:

The arc as shown previously will appear for the following parameters:
xPos,yPos = (60,150)
xctrl,yctrl=(100,80)
xend,yend=(140,150)
radius=15
If you increase the radius of the circle, the size will increase but it will lie within the angle formed by the two lines intersecting at the control point (xctrl,yctrl). So the circle will shift downwards, forming two tangent points, and the arc will bend. It will look as follows if the radius is increased to 25:

The second function, arc(xPos,yPos,radius,startAngle,endAngle,anticlockwise), is much easier and is used to develop our new recipe. The parameters here mean the following:
xPos: The x coordinate of the arc's center.yPos: The y coordinate of the arc's center.radius: The arc's radius.startAngle: The angle at which the arc starts, measured clockwise from the positive x axis and expressed in radians.endAngle: The angle at which the arc ends, measured clockwise from the positive x axis and expressed in radians.Anticlockwise(optional): A Boolean value which, ifTrue, causes the arc to be drawn counter-clockwise between the two angles. By default the arc is drawn clockwise.
Two new things are introduced here:
The
fillStyleproperty, which decides the color with which the arc needs to be filledThe
fill()method, which actually fills the area of the arc that you draw
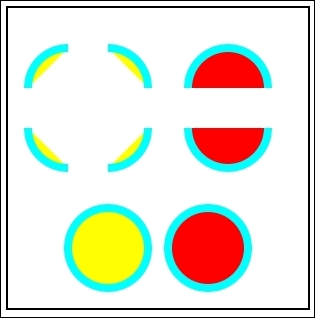
The output of this recipe looks like this:
Here is the recipe:
<html>
<head>
<title>Arcs</title>
<script>
  function init()
  {
  can = document.getElementById("MyCanvasArea");
  ctx = can.getContext("2d");

    drawArc(60,80,40,180,270,false,"aqua","yellow");
    drawArc(120,80,40,270,360,false,"aqua","yellow");
    drawArc(220,80,40,180,360,false,"aqua","red");

    drawArc(60,150,40,90,180,false,"aqua","yellow");
    drawArc(120,150,40,0,90,false,"aqua","yellow");
    drawArc(220,150,40,0,180,false,"aqua","red");

    drawArc(100,250,40,0,360,false,"aqua","yellow");
    drawArc(200,250,40,360,0,false,"aqua","red");

    //function to draw curve
    function drawArc(xPos,yPos,radius,startAngle,endAngle,anticlockwise,lineColor, fillColor,width)
       {
          var startAngle = startAngle * (Math.PI/180);
          var endAngle   = endAngle   * (Math.PI/180);

          var radius = radius;

          ctx.strokeStyle = lineColor;
          ctx.fillStyle   = fillColor;
          ctx.lineWidth   = width;

          ctx.beginPath();
          ctx.arc(xPos,yPos,radius,startAngle,endAngle,anticlockwise);

          ctx.fill();
          ctx.stroke();
       }
}
</script>
</head>
<body onload="init()">
<canvas ID="MyCanvasArea" width="300" height="300" style="border:2px solid black;">
  your browser doesn't support canvas
</canvas>
</body>
</html>Consider the following diagram for an explanation:
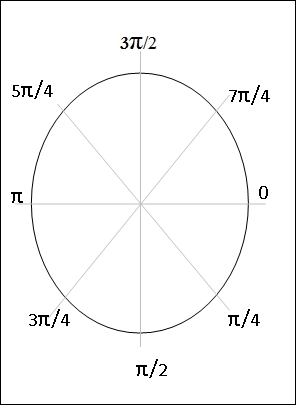
The arc function accepts the angles in radians. Refer to the circle shown previously for a better understanding. If you specify the start angle as zero and end angle as π, then you should see a semicircle drawn in a clockwise direction (starting from zero through π/2 and ending on π). If you are comfortable with angles in degrees then they need to be converted into radians before passing into the function. The formula for conversion is: Value in Radians = value in degrees * (π/180).
A partial chart of conversion is shown as follows:
|
Angle in degrees |
Angle in radians |
|---|---|
|
|
|
|
|
|
|
|
|
|
|
|
|
|
|
|
|
|
|
|
|
In this recipe, you will learn how to draw a quadratic curve. The quadratic curve provides much more flexibility. These curves can be used to create custom shapes in numerous drawings. You will find one implementation in the next recipe:

Here is a simple code to draw a quadratic curve:
<html>
  <head>
    <title>Arcs</title>
    <script>
    function init()
    {
      can  = document.getElementById("MyCanvasArea");
      ctx = can.getContext("2d");

      //call to the function to draw curve
      drawQuadraticCurve(50,100,150,30,250,100,'#df34ef',7);

      //function to draw quadratic curve
      function drawQuadraticCurve(xStart,yStart,xControl, yControl, xEnd, yEnd,color,width)
      {
        ctx.beginPath();
        ctx.strokeStyle=color;
        ctx.lineJoin="round";
        ctx.lineWidth=width;
        ctx.moveTo(xStart,yStart);
        ctx.quadraticCurveTo(xControl, yControl, xEnd, yEnd);
        ctx.stroke();
        ctx.closePath();
      }
    }
    </script>
    </head>
    <body onload="init()">
    <canvas ID="MyCanvasArea" width="300" height="200" style="border:2px solid black;">
    your browser doesn't support canvas
    </canvas>
    </body>
</html>The API function is quadraticCurveTo(cpX,cpY,epX,epY).
In this function, cpX and cpY are coordinates of the control point, and epX and epY are coordinates of the end point, the drawing has to start from some point. However, it is not part of this function. You have to move to a point that you want to draw from. This is done by using the moveTo() function.
Refer to the diagram:

Observe the points in the diagram. The parameters passed to the quadraticCurveTo() function are coordinates of the control point and end point. Before this function is called you need to call a function moveTo() from where you specify the start/context point.
This is an implementation of a quadratic curve.
The output of our new recipe looks like this:

The recipe is quite simple, comprising seven calls to the function quadraticTo() to draw seven different curves.
Here is the recipe:
<html>
<head>
  <title>Rainbow</title>
  <script type="text/javascript">
    var can;
    var ctx;
    function init() {
      can = document.getElementById("MyCanvasArea");
      ctx = can.getContext("2d");
      y=can.height/2;
      x=can.width-20;
      mid=can.width/2;
      //rainbow - vibgyor
      drawQuadraticCurve(20,y,mid,0,x,y,"violet",7);
      drawQuadraticCurve(20,y-10,mid,-10,x,y-10,"indigo",7);
      drawQuadraticCurve(20,y-20,mid,-20,x,y-20,"blue",7);
      drawQuadraticCurve(20,y-30,mid,-30,x,y-30,"green",7);
      drawQuadraticCurve(20,y-40,mid,-40,x,y-40,"yellow",7);
      drawQuadraticCurve(20,y-50,mid,-50,x,y-50,"orange",7);
      drawQuadraticCurve(20,y-60,mid,-60,x,y-60,"red",7);

    }
    function drawQuadraticCurve(xStart,yStart,xControl, yControl, xEnd, yEnd,color,width)
    {
      //refer the previous recipe for code
      //....
    }
  </script>
</head>
<body onload="init()">
  <canvas id="MyCanvasArea" width="800" height="400" style="border:2px solid black;" >
    browser doesn't support canvas
  </canvas>
</body>
</html>A Bezier curve is different from a quadratic curve. It is also known as a cubic curve and is the most advanced curvature available in HTML5. The simple Bezier curve looks as shown in the output of this recipe:

<html>

<head>

<title>A Bezier Curve</title>
<script>
  function init()
  {
    can  = document.getElementById("MyCanvasArea");
    ctx = can.getContext("2d");
    var xstart = 50;   var ystart = 50;
    var xctrl1 = 100;  var yctrl1 = 35;
    var xctrl2 = 100;  var yctrl2 = 95;
    var xend = 180;  var yend = ystart;
    //call to the function
    drawBezierCurve(xstart,ystart,xctrl1,yctrl1,xctrl2,yctrl2,xend,yend,"black",10);
  }
  function drawBezierCurve(xstart,ystart,xctrl1,yctrl1,xctrl2,yctrl2,xend,yend,color,width)

  {

    ctx.strokeStyle=color;

    ctx.lineWidth=width;
    ctx.beginPath();
    ctx.moveTo(xstart,ystart);
    ctx.bezierCurveTo(xctrl1,yctrl1,xctrl2,yctrl2,xend,yend);
    ctx.stroke();
  }
</script>
</head>
<body onload="init()">

  <canvas id="MyCanvasArea" width ="300"  height="200" style="border:2px solid black">

    Your browser doesn't currently support HTML5 Canvas.

  </canvas>
</body>
</html>In a Bezier curve there are two control points, one start point and one end point. So you have to move to the starting or context point, like we do in a quadratic curve, and then specify the control points and ending point in the bezierCurveTo(cp1X,cp1Y,cp2X,cp2Y,epX,epY) method. Here, cp1 and cp2 are the control points and ep is the end point. The two control points add more flexibility to the curve.
Refer to the diagram given here:

The curve starts at the start/context point and ends at the end point. It heads towards control point 1 and then comes down to the end point through control point 2. The control points control the curvature. Change the y coordinate of any control point and you will see the difference.
Bezier curves are actually a sequence of cubic segments rather than linear segments. They appear smooth at all scales and are used in computer graphics.
Using the knowledge of Bezier curves you can develop various examples of your own. Here is a recipe whose output looks like this:

If you observe the drawing of a flag, you can easily understand that it's drawn using a combination of a line, a Bezier curve, and a circle. Here is our recipe:
<html>
<head>
<title>A Flag</title>
<script>
  function init()
  {
    can = document.getElementById("MyCanvasArea");
    ctx = can.getContext("2d");
    var xstart = 50;   var ystart = 25;
    var xctrl1 = 100;  var yctrl1 = 10;
    var xctrl2 = 100;  var yctrl2 = 70;
    var xend = 180;  var yend = ystart;

    //10 curves having orange color
    for(i=1;i<=10;i++)
    {
      drawBezierCurve(xstart,ystart,xctrl1,yctrl1,xctrl2,yctrl2,xend, yend,"orange");
      ystart+=5;yend+=5;yctrl1+=5;yctrl2+=5;
    }
    //10 curves having white color
    for(j=1;j<=10;j++)
    {
      drawBezierCurve(xstart,ystart,xctrl1,yctrl1,xctrl2,yctrl2,xend,yend,"white");
      ystart+=5;yend+=5;yctrl1+=5;yctrl2+=5;
    }
    //10 curves having green color
    for(j=1;j<=10;j++)
    {
      drawBezierCurve(xstart,ystart,xctrl1,yctrl1,xctrl2,yctrl2,xend,yend,"green");
      ystart+=5;yend+=5;yctrl1+=5;yctrl2+=5;
    }
    //the ashoka wheel we draw two arcs and lines
    x1=120;
    y1=113;
    drawArc(x1,y1,22,0,360,false,"navy");
    //draw a stand for the flag
    drawLine(50,350,50,20,10,"brown");
  }
function drawBezierCurve(xstart,ystart,xctrl1,yctrl1,xctrl2,yctrl2,xend,yend,color,width)
{
    ctx.strokeStyle=color;
    ctx.lineWidth=6;
    ctx.beginPath();
    ctx.moveTo(xstart,ystart);
    ctx.bezierCurveTo(xctrl1,yctrl1,xctrl2,yctrl2,xend,yend);
    ctx.stroke();
}
function drawArc(xPos,yPos,radius,startAngle,endAngle,anticlockwise,lineColor)
{
    var startAngle = startAngle * (Math.PI/180);
    var endAngle   = endAngle   * (Math.PI/180);
    var radius = radius;
    ctx.strokeStyle = lineColor;
    ctx.fillStyle="navy";
    ctx.lineWidth   = 4;
    ctx.beginPath();
    ctx.arc(xPos,yPos,radius,startAngle,endAngle,anticlockwise);
    ctx.fill();
    ctx.stroke();
}
function drawLine(xstart,ystart,xend,yend,width,color)
{
    ctx.beginPath();
    ctx.strokeStyle=color;
    ctx.lineWidth=width;
    ctx.moveTo(xstart,ystart);
    ctx.lineTo(xend,yend);
    ctx.stroke();
    ctx.closePath();
}
</script>
</head>
<body onload="init()">
  <canvas id="MyCanvasArea" width ="300"  height="400" style="border:2px solid black">
    Your browser doesn't currently support HTML5 Canvas.
  </canvas>
</body>
</html>This is a simple recipe rendering text:
<html>
<head>
<title>A Simple Text</title>
<script>
function init()
{
can = document.getElementById("MyCanvasArea");
ctx = can.getContext("2d");
var X=Math.round(can.width/2);
drawLine(X,10,X,390,2,'black','butt');
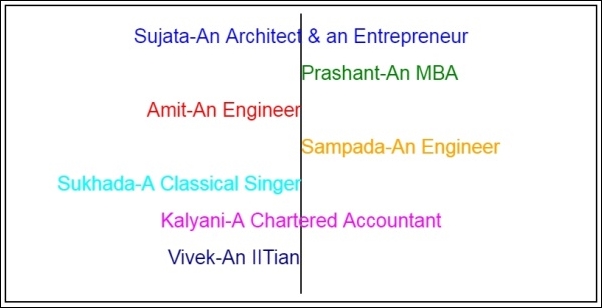
drawMyText(X,50,'Sujata-An Architect & an Entrepreneur','center','top','blue');
drawMyText(X,100,'Prashant-An MBA','left','middle','green');
drawMyText(X,150,'Amit-An Engineer','right','bottom','red');
drawMyText(X,200,'Sampada-An Engineer','start','alphabetic','orange');
drawMyText(X,250,'Sukhada-A Classical Singer','end','hanging','aqua');
drawMyText(X,300,'Kalyani-A Chartered Accountant','center','ideographic','magenta');
ctx.direction="rtl";
drawMyText(X,350,'Vivek-An IITian','start','alphabetic','navy');
}
function drawMyText(X,Y,message,align,baseline,color)
{
ctx.beginPath();
ctx.fillStyle=color;
ctx.font='20pt Arial';
ctx.textAlign=align;
ctx.textBaseLine=baseline;
ctx.fillText(message,X,Y);
ctx.closePath();
}
function drawLine(xstart,ystart,xend,yend,width,color,cap)
{
ctx.beginPath();
ctx.strokeStyle=color;
ctx.lineWidth=width;
ctx.lineCap=cap;
ctx.moveTo(xstart,ystart);
ctx.lineTo(xend,yend);
ctx.stroke();
ctx.closePath();
}
</script>
</head>
<body onload="init()">
<canvas id="MyCanvasArea" width ="800" height="400"
style="border:2px solid black">
Your browser doesn't currently support HTML5 Canvas.
</canvas>
</body>
</html>The output demonstrates the textAlign property. The values for this property can be left, right, center, start, or end. The value start is the same as left if the direction of text is from left to right, and the text display starts from the coordinates specified. In this recipe, it starts from 400,100 and 400,200 for two different texts. Observe the last text. The text seems to end on the line; however, the property is set with the value start. This happens because of this statement:
ctx.direction="rtl";
The direction of text rendered on the canvas is changed from default to right-to-left, so the start of the text changes. By default the direction is inherited from the parent element. Otherwise, it can be set to left-to-right or right-to-left.
If 2D text doesn't get you jazzed, you might consider drawing 3D text instead. Although the HTML5 canvas API doesn't directly provide us with a means of creating 3D text, we can certainly create a custom draw3dText() method using the existing API:

<html>
<head>

<title>A 3D Text</title>
<script>
  function init()
  {
    can  = document.getElementById("MyCanvasArea");

    ctx = can.getContext("2d");

    var X=Math.round(can.width/2);

    drawLine(X,10,X,390,2,'black','butt');

    draw3dText(X,50,'Sujata-An Architect & an Entrepreneur','center','top','blue',1);
    draw3dText(X,100,'Prashant-An MBA','left','middle','green',2);
    draw3dText(X,150,'Amit-An Engineer','right','bottom','red',3);
    draw3dText(X,200,'Sampada-An Engineer','start','alphabetic','orange',4);
    draw3dText(X,250,'Sukhada-A Classical Singer','end','hanging','aqua',5);
    draw3dText(X,300,'Kalyani-A Chartered Accountant','center','ideographic','magenta',6);
    ctx.direction="rtl";
    draw3dText(X,350,'Vivek-An IITian','start','alphabetic','navy',7);
  }
  function draw3dText(X,Y,message,align,baseline,color,depth)

  {

    ctx.beginPath();
    var i=0;
    ctx.font='20pt Arial';

    ctx.textAlign=align;
    ctx.textBaseLine=baseline;
    ctx.fillStyle=color;
    ctx.fillText(message,X,Y);
    ctx.shadowColor="lightgrey";
    ctx.shadowBlur=5;
    while(i<=depth)
    {
        ctx.shadowOffsetX=depth+1;
        ctx.shadowOffsetY=depth+2;
        ctx.fillText(message,X,Y);
        i++;
    }
    ctx.closePath();
  }
  function drawLine(xstart,ystart,xend,yend,width,color,cap)
  {
  //refer the first recipe
  //....
}
</script>
</head>
<body onload="init()">
  <canvas id="MyCanvasArea" width ="800"  height="400" style="border:2px solid black">

        Your browser doesn't currently support HTML5 Canvas.

  </canvas>
</body>
</html>This recipe is created by appending some code to the function for drawing the text. The properties to apply shadow are used on the text. The properties shadowColor, shadowOffsetX, shadowOffsetY, and shadowBlur are set to achieve the 3D effect. Before the loop begins, the text is drawn with the specified color. Then the shadow color and blur level is set. And within the loop, the text is drawn with changed X and Y offset for the shadow for certain depth. The properties used are summarized here:
Here, we will be using our first recipe. Just a few properties are set and we get a different output as shown:

Notice the difference between this and the output of the first recipe. Here you will notice a shadow for each line.
We use a few shadow-related properties to build this recipe:
<html>
<head>
  <title>Line Shadow</title>
    <script type="text/javascript">
      var can;
      var ctx;
      function init() {
        can = document.getElementById("MyCanvasArea");
        ctx = can.getContext("2d");
        drawLine(30,30,300,30,20,"orange","butt");  //default cap style
        drawLine(30,80,300,80,20,"crimson","round");
        drawLine(30,130,300,130,20,"teal","square");
      }
      function drawLine(xstart,ystart,xend,yend,width,color,cap)
      {
        ctx.beginPath();
        ctx.strokeStyle=color;
        ctx.lineWidth=width;

        //adding shadow
        ctx.shadowOffsetX = 4;
        ctx.shadowOffsetY = 4;
        ctx.shadowBlur    = 7;
        ctx.shadowColor   = "gray";
        //shadow properties set above

        ctx.lineCap=cap;
        ctx.moveTo(xstart,ystart);
        ctx.lineTo(xend,yend);
        ctx.stroke();
        ctx.closePath();
      }
    </script>
</head>
<body onload="init()">
  <br/><br/>
  <center>
  <canvas id="MyCanvasArea" width="320" height="200"  style="border:3px solid brown;">
  </canvas>
  </center>
</body>
</html>The final recipe of the chapter combines all the building blocks learned so far. Here is the output of our first drawing. As a kid, everyone loves to draw this:
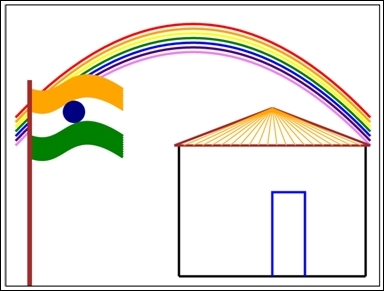
The recipe is just a combination of all the different functions developed and used so far. Here is the recipe:
<html>
<head>
  <title>My House</title>
    <script type="text/javascript">
      var can;
      var ctx;
      function init() {

        can = document.getElementById("myhouse");
        ctx = can.getContext("2d");
        drawRainbow();
        drawHouse();
        drawFlag();

      }
      function drawLine(xstart,ystart,xend,yend,width,color)
      {
        ctx.beginPath();
        ctx.lineJoin="miter";
        ctx.strokeStyle=color;
        ctx.lineWidth=width;
        ctx.moveTo(xstart,ystart);
        ctx.lineTo(xend,yend);
        ctx.stroke();
        ctx.closePath();
      }
      function drawHouse()
      {

        x1=can.width/2-30;
        y1=can.height-20;
        x2=can.width-30;
        y2=can.height-20;
        color="black";
        width=5;
        drawLine(x1,y1,x2,y2,width,color);    //base
        drawLine(x1,y1,x1,can.height/2,width,color);  //left wall
        drawLine(x2,y2,x2,can.height/2,width,color);  //right wall

        x3=x1-10;
        y3=can.height/2;
        x4=x2+10;
        y4=can.height/2;
        drawLine(x3,y3,x4,y4,width,"brown");    //roof base

        x5=x1+(x2-x1)/2;        //midpoint of the roof
        y5=can.height/2-80;

        drawLine(x3,y3,x5,y5,width,"brown");    //roof - left side
        drawLine(x4,y4,x5,y5,width,"brown");    //roof - right side
        //rslope=(x5-x4)/(y5-y4);
        j=20;
        k=23;
        g=1;
        m=4;
        for(i=1;i<=20;i++)
        {
          var X1=x3+j;
          var Y1=y3;
          var X2=x5;
          var Y2=y5;

          drawLine(var X1,var Y1,var X2,var Y2,2,"orange");
          j=j+20;
          k=k+23;
        }
        //draw the door
        dX1=x1+(x5-x1);
        dY1=y1;
        dX2=x5;
        dY2=y5+180;
        ctx.beginPath();
        ctx.strokeStyle="blue";
        ctx.lineWidth=5;
        ctx.lineJoin="miter";
        ctx.moveTo(dX1,dY1);
        ctx.lineTo(dX2,dY2);
        ctx.lineTo(dX2+70,dY2);
        ctx.lineTo(dX1+70,dY1);
        ctx.stroke();
      }
      function drawRainbow()
      {
        y=can.height/2;
        x=can.width-20;
        mid=can.width/2;
        //rainbow - vibgyor
        yc=-100;
        drawQuadraticCurve(20,y,mid,yc,x,y,"violet");
        drawQuadraticCurve(20,y-10,mid,yc-10,x,y-10,"indigo");
        drawQuadraticCurve(20,y-20,mid,yc-20,x,y-20,"blue");
        drawQuadraticCurve(20,y-30,mid,yc-30,x,y-30,"green");
        drawQuadraticCurve(20,y-40,mid,yc-40,x,y-40,"yellow");
        drawQuadraticCurve(20,y-50,mid,yc-50,x,y-50,"orange");
        drawQuadraticCurve(20,y-60,mid,yc-60,x,y-60,"red");
      }
      function drawFlag()
      {
        var xstart = 50;   var ystart = 180;
        var xctrl1 = 130;  var yctrl1 = 210;
        var xctrl2 = 130;  var yctrl2 = 100;
        var xend = 250;  var yend = ystart;

        //10 curves having orange color
        for(i=1;i<=10;i++)
        {
          drawBezierCurve(xstart,ystart,xctrl1,yctrl1,xctrl2,yctrl2,xend,yend,"orange",6);
          ystart+=5;yend+=5;yctrl1+=5;yctrl2+=5;
        }
        //10 curves having white color
        for(j=1;j<=10;j++)
        {
          drawBezierCurve(xstart,ystart,xctrl1,yctrl1,xctrl2,yctrl2,xend,yend,"white",6);
          ystart+=5;yend+=5;yctrl1+=5;yctrl2+=5;
        }
        //10 curves having green color

        for(j=1;j<=10;j++)
        {
          drawBezierCurve(xstart,ystart,xctrl1,yctrl1,xctrl2,yctrl2,xend,yend,"green",6);
          ystart+=5;yend+=5;yctrl1+=5;yctrl2+=5;
        }

        x1=145;
        y1=228;
        drawArc(x1,y1,22,0,360,false,"black","navy");
        //draw a stand for the flag
        drawLine(50,650,50,160,10,"brown");
      }
      function drawQuadraticCurve(xstart,ystart,xControl, yControl, xEnd, yEnd,color,width)
      {
        //refer the Quadratic curve recipe
        //....
      }
      function drawBezierCurve(xstart,ystart,xctrl1,yctrl1,xctrl2,yctrl2,xend,yend,color,width)

      {

        //refer the Bezier curve recipe
        //....

      }
      function drawArc(xPos,yPos,radius,startAngle,endAngle,anticlockwise,lineColor,fillColor,width)
       {
        //refer the Arc recipe
        //....
         }
    </script>
</head>
<body onload="init()">
  <canvas id="myhouse" height="600" width="800" style="border:2px solid black;">
  </canvas>
</body>
</html>The recipe is built on the concepts learned in the previous recipes. You will see here the use of a line, an arc, a quadratic curve, and a Bezier curve. All of these drawings are the building blocks for this recipe of a house. The functions are the same as used in the previous recipes. These functions are called to create a flag, a rainbow, and a hut, using only lines, arcs, and curves. Shapes can make your job easier. The next chapter is all about shapes.