


 Download code from GitHub
Introduction to Healthcare Analytics
This chapter is meant to introduce you to the field of healthcare analytics and is for all audiences. By the end of this chapter, you will understand the basic definition of healthcare analytics, the topics that healthcare analytics encompasses, a history of healthcare analytics, and some well-known application areas. In the second half of this chapter, we will guide you through installing the required software and provide a light introduction to Anaconda and SQLite.
In short, we will be covering the following topics in this chapter:
- Basics of healthcare analytics
- History of healthcare analytics
- Examples of healthcare analytics
- Introduction to Anaconda, Jupyter Notebook, and SQLite
What is healthcare analytics?
Unfortunately, a definition of healthcare analytics is not in Webster's dictionary yet. However, our own definition of healthcare analytics is the use of advanced computing technology to improve medical care. Let's break down this definition phrase by phrase.
Healthcare analytics uses advanced computing technology
At the time of this writing, we are approaching the year 2020, and computers and mobile phones have taken over many aspects of our lives, the healthcare industry being no exception. Most of our healthcare data is being migrated from paper charts to electronic ones, in many cases motivated by massive governmental incentives for doing so. Meanwhile, countless medical mobile applications are being written to track vital signs, including heart rates and weights, and even communicate with doctors. While this migration is not trivial, it will allow for the application of advanced computing techniques hopefully to unlock doors toward improving medical care for everyone.
What are some of these advanced computing technologies? We will discuss them in the upcoming sections.
Healthcare analytics acts on the healthcare industry (DUH!)
If you're looking for a book that demonstrates the use of machine learning to predict the year of the apocalypse, unfortunately, this is not it. Healthcare analytics is all things healthcare.
Healthcare analytics improves medical care
So far, we are using computers to do something in healthcare. What exactly are we doing? We are trying to improve medical care. Well that's broad, isn't it? The effectiveness of medical care is commonly measured using the so-called healthcare triple aim: improving outcomes, reducing costs, and ensuring quality (although we've seen different words used here). Let's look at each of these aims in turn.
Better outcomes
On a personal level, everyone can relate to better healthcare outcomes. We yearn for better outcomes in our own lives whenever we visit a doctor or a hospital. Specifically, here are some of the things about which we are concerned:
- Accurate diagnosis: When we see a physician, usually it is for a medical problem. The problem may be causing some amount of pain or anxiety in our lives. What we care about is that the cause of this problem will be accurately identified so that the problem may be effectively treated.
- Effective treatment: Treatment may be expensive, time-consuming, and may cause adverse side-effects; therefore, we want to be sure that the treatment is effective. We don't want to have to take another vacation day to see a doctor or be admitted to the hospital for the same problem two months from now–such an experience would be costly, in terms of both time and money (either through medical bills or tax dollars).
- No complications: We don't want to come down with a new infection or take a dangerous fall while we are seeking care for the current ailment.
- An overall improved quality of life: To summarize the concept of better health outcomes, while governmental bodies and physician organizations may have different ways of measuring outcomes, what we aim for is an improved quality and longevity of life that is pain- and worry-free.
Lower costs
So the goal is better health outcomes, right? Unfortunately, we can't provide 24-7 medical care to everyone all the time, because our economy would break down. We can't order whole-body x-rays to detect every cancer in advance. There is a careful balance between achieving better outcomes and decreasing costs in healthcare. The idea with healthcare analytics is that we will be able to do more with less expensive techniques. A CT scan of the chest to screen for lung cancer may cost thousands of dollars; however, doing mathematical calculations on a patient's medical history to screen for lung cancer costs much less. In this book, the plan is to show you how to make those calculations.
Ensure quality
Healthcare quality encompasses the satisfaction level of the patient after he or she receives medical care. In a capitalist system (such as the healthcare system of the United States), a tried-and-true method of improving the quality involves fair and objective measurement of how different providers are performing so that patients can make more informed decisions about their care.
Foundations of healthcare analytics
Now that we've defined and introduced healthcare analytics, it's important to give some background on the knowledge from which it draws. Healthcare analytics can be viewed as the intersection of three fields: healthcare (Healthcare Analytics), mathematics (Math), and computer science (CS), as seen in the following diagram. Let's explore each of these three areas in turn:
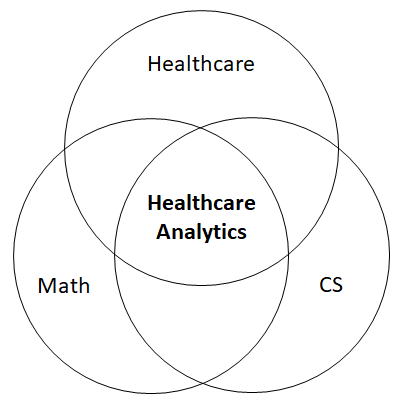
Healthcare
Healthcare is the domain-knowledge pillar of healthcare analytics. Here are some of the significant healthcare areas of knowledge that comprise healthcare analytics:
- Healthcare delivery and policy: An understanding of how the healthcare industry is structured, who the major players in healthcare are, and where the financial incentives lie can only help us in improving healthcare analytics endeavors.
- Healthcare data: Healthcare data is rich and complex, whether it is structured or unstructured. However, healthcare data collection often follows a specific template. Knowing the details of the typical history and physical examination (H&P) and how data is organized in a medical chart goes a long way in helping us turn that data into knowledge.
- Clinical science: A familiarity with medical terminology and diseases helps in knowing what's important in the vast ocean of medical information. Clinical science is commonly divided into two areas: physiology, or how the human body functions normally, and pathology, or how the human body functions with a disease. Some basic knowledge of both can be very helpful in doing effective healthcare analytics.
An introduction to healthcare for healthcare analytics will be provided in Chapter 2, Healthcare Foundations.
Mathematics
The second pillar of our healthcare analytics triumvirate is mathematics. We are not trying to scare you off with this list; a detailed knowledge of all of the following areas is not a prerequisite for doing effective healthcare analytics. A basic knowledge of high school math, however, may be essential. The other areas are most helpful while understanding the machine learning models that allow us to predict diseases. That being said, here are some of the significant mathematical domains that comprise healthcare analytics:
- High school mathematics: Subjects such as algebra, linear equations, and precalculus are essential foundations for the more advanced math topics seen in healthcare analytics.
- Probability and statistics: Believe it or not, every medical student takes a class in biostatistics during their training. Yes, effective medical diagnosis and treatment rely heavily on probability and statistics, including concepts such as sensitivity, specificity, and likelihood ratios.
- Linear algebra: Commonly, the operations done on healthcare data while making machine learning models are vector and matrix operations. You'll effectively perform plenty of these operations as you work with NumPy and scikit-learn to make machine learning models in Python.
- Calculus and optimization: These last two topics particularly apply to neural networks and deep learning, a specific type of machine learning that consists of layers of both linear and nonlinear transformations of data. Calculus and optimization are important for understanding for how these models are trained.
An introduction to mathematics and machine learning for healthcare analytics will be provided in Chapter 3, Machine Learning Foundations.
Computer science
Here are some of the significant computer science domains that comprise healthcare analytics:
- Artificial intelligence: At the center of healthcare analytics is artificial intelligence or the study of systems that interact with their environment. Machine learning is a subarea within artificial intelligence, in which predictions are made about future events using information from previous events. The models that we will study in the later parts of this book are machine learning models.
- Databases and information management: Healthcare data is often accessed using relational databases, which can often be dumped by electronic medical record (EMR) systems on demand, or which are located in the cloud. SQL (short for Structured Query Language) can be used to select the specific data in which we are interested and to make transformations on that data.
- Programming languages: A programming language provides an interface between the human programmer and the ones and zeros inside of a computer. A programming language allows a programmer to provide instructions to the computer to make calculations on data that humans cannot practically do. In this book, we will use Python, a popular and emerging programming language that is open source, comprehensive, and features plenty of machine learning libraries.
- Software engineering: Many of you are presumably learning about healthcare analytics because you are interested in deploying production-grade healthcare applications in your workplace. Software engineering is the study of the effective and efficient building of software systems that satisfy user and customer requirements.
- Human-computer interaction: The end users of healthcare analytics applications usually don't use programming to obtain their results, but instead rely on visual interfaces. Human-computer interaction is the study of how humans interact with computers and how such interfaces can be designed. A current hot topic in medicine is how EMR applications can be made more intuitive and palatable to physicians, rather than increasing the number of mouse clicks they must make per patient while writing notes.
Computer science is so pervasive in healthcare analytics that almost every chapter in this book deals with it.
History of healthcare analytics
The origin of healthcare analytics can be traced back to the 1950s, just a few years after the world's first computer (ENIAC) was invented in 1946. At the time, medical records were still on paper, regression analysis was done by hand, and there were no incentives given by the government for pursuing value-based care. Nevertheless, there was a burgeoning interest in developing automated applications to diagnose and treat human disease, and this is reflected in the scientific literature of the time. For example, in 1959, the journal Science published an article entitled "Reasoning Foundations of Medical Diagnosis," by Robert S. Ledley and Lee B. Lusted that explains mathematically how physicians make a medical diagnosis (Ledley and Lusted, 1959). The paper explains many concepts that are central to modern biostatistics, although at times using terminology and symbols that we may not recognize today.
In the 1970s, as computers gained prominence and became accessible in academic research centers, there was a growing interest in developing medical diagnostic decision support (MDDS) systems, an umbrella term for broadly based, all-in-one computer programs that pinpoint medical diagnoses when input with patient information. The INTERNIST-1 system is the most well-known of these systems and was developed by a group of researchers at the University of Pittsburgh in the 1970s (Miller et al., 1982). Described by its inventors as "an experimental program for computer-assisted diagnosis in general internal medicine," the INTERNIST system was developed over 15 person-years of work and involved extensive consultation with physicians. Its knowledge base spanned 500 individual diseases and 3,500 clinical manifestations across all medical subspecialties. The user starts by entering positive and negative findings for a patient, after which they can check a list of differential diagnoses and see how they change as new findings are added. The program intelligently asks for specific test results until a clear diagnosis is achieved. While it showed initial promise and captured the imagination of the medical world, it ultimately failed to enter the mainstream after its recommendations were outperformed by those made by a panel of leading physicians. Other reasons for its demise (and the demise of MDDS systems in general) may include the lack of an inviting visual interface (Microsoft Windows had not been invented yet) and the fact that modern machine learning techniques were yet to be discovered.
In the 1980s, there was a rekindled interest in artificial intelligence techniques that had largely been extinguished in the late 1960s, after the limitations of perceptrons had been explicated by Marvin Minsky and Seymour Papert in their book, Perceptrons (Minsky and Papert, 1969). The paper "Learning representations by back-propagating errors" by David E. Rumelhart, Geoffrey E. Hinton, and Ronald J. Williams was published in Nature in 1986 and marked the birth of the back-propagation-trained, nonlinear neural network, which today rivals humans in its performance on a variety of artificial intelligence, such as speech and digit recognition (Rumelhart et al., 1986).
It took only a few years before such techniques were applied to the medical field. In 1990, William Baxt published a study entitled "Use of an Artificial Neural Network for Data Analysis in Clinical Decision-Making: The Diagnosis of Acute Coronary Occlusion" in the journal Neural Computation (Baxt, 1990). In the study, an artificial neural network outperformed a group of medical physicians in diagnosing heart attacks using findings from electrocardiograms (EKGs). This pioneering study helped to open the floodgates for a tsunami of biomedical machine learning research that persists even today. Indeed, searching for "machine learning" using the biomedical search engine PubMed returns only 9 results in 1990 and over 4,000 results in 2017, with the results steadily increasing in the intervening years:

Several factors are responsible for this acceleration in biomedical machine learning research. The first is the increasing number and availability of machine learning algorithms. The neural network is just one example of this. In the 1990s, medical researchers began using a variety of alternative algorithms, including recently developed algorithms such as decision trees, random forests, and support vector machines, in addition to traditional statistical models, such as logistic and linear regression.
The second factor is the increased availability of electronic clinical data. Prior to the 2000s, almost all medical data was on paper charts and conducting computerized machine learning studies meant hours of manually entering the data into computers. The growth and eventual spread of electronic medical records made it much simpler to use this data to make machine learning models. Additionally, more data meant more accurate models.
This brings us to the present day, in which healthcare analytics is experiencing an exciting time. Today's modern neural networks (commonly referred to as deep learning networks) are commonly outperforming humans in tasks that are more complex than EKG interpretation, such as cancer recognition from x-ray images and predicting sequences of future medical events in patients. Deep learning often achieves this using millions of patient records, coupled together with parallel computing technology that makes it possible to train large models in shorter time spans, as well as newly developed techniques for tuning, regularizing, and optimizing machine learning models. Another exciting occurrence in present healthcare analytics is the introduction of governmental incentives to eliminate excessive spending and misdiagnosis in healthcare. Such incentives have led to an interest in healthcare analytics not just from academic researchers, but also from industrial players and companies looking to save money for healthcare organizations (and to make themselves some money as well).
While healthcare analytics and machine algorithms aren't redefining medical care just yet, the future for healthcare analytics looks bright. Personally, I like to imagine a day when hospitals, equipped with cameras, privately and securely record every aspect of patient care, including conversations between patients and physicians and patient facial expressions as they hear the results of their own medical tests. These words and images could then be passed to machine learning algorithms to predict how patients will react to future results, and what those results will be in the first place. But we are getting ahead of ourselves; before we arrive at that day, there is much work to be done!
Examples of healthcare analytics
To give you an idea of what healthcare analytics encompasses, here are some examples of healthcare analytics use cases that demonstrate the breadth and depth of modern healthcare analytics.
Using visualizations to elucidate patient care
Analytics is often divided into three subcomponents–descriptive analytics, predictive analytics, and prescriptive analytics. Descriptive analytics encompasses using the analytic techniques previously discussed to better describe or summarize the process under study. Understanding how care is delivered is one process that stands to benefit from descriptive analytics.
How can we use descriptive analytics to better understand healthcare delivery? The following is one example of a visualization of a toddler's emergency department (ED) care record when they presented complaining of an asthma exacerbation (Basole et al., 2015). It uses structured clinical data commonly found in EMR systems to summarize the temporal relationships of the care events they experienced in the ED. The visualization consists of four types of activities–administrative (yellow), diagnostic (green), medications (blue), and lab tests (red). These are encoded by color and by y-position. Along the x-axis is time. The black bar on top is divided by vertical tick marks into hour-long blocks. This patient's visit lasted a little over two hours. Information about the patient is displayed before the black time bar.
While descriptive analytical studies such as these may not directly impact costs or medical care recommendations, they serve as a starting point for exploring and understanding the patient care and often pave the way for more specific and actionable analytical methods to be launched:

Predicting future diagnostic and treatment events
A central problem in medicine is identifying patients who are at risk of developing a certain disease. By identifying high-risk patients, steps can be taken to hinder or delay the onset of the disease or prevent it altogether. This is an example of predictive analytics at work–using information from previous events to make predictions about the future. There are certain diseases that are particularly popular for prediction research: congestive heart failure, myocardial infarction, pneumonia, and chronic obstructive pulmonary disease are just a few examples of high-mortality, high-cost diseases that benefit from early identification of high-risk patients.
Not only do we care about what diseases will occur in the future, we are also interested in identifying patients who are at risk of requiring high-cost treatments, such as hospital readmissions and doctor visits. By identifying these patients, we can take money-saving steps proactively to reduce the risk of these high-risk treatments, and we can also reward healthcare organizations that do a good job.
This is a broad example with several unknowns to consider. First: what specific event (or disease) are we interested in predicting? Second: what data will we use to make our predictions? Structured clinical data (data organized as tables) drawn from electronic medical records is currently the most popular data source; other possibilities include unstructured data (medical text), medical or x-ray images, biosignals (EEG, EKG), data recorded from devices, or even data from social media. Third: what machine learning algorithm will we use?
Measuring provider quality and performance
While making nice visualizations or predictions represent the sexier aspects of healthcare analytics, there are other types of analytics that are also important. Sometimes, it boils down to good, old number crunching. Monitoring the performance of physicians and healthcare organizations using healthcare measures is a good example of this type of analytical technique. Healthcare measures provide a mechanism by which individuals can measure and compare the compliance of participating providers on evidence-based medical recommendations. For example, it is a widely accepted recommendation that patients with diabetes receive foot exams to detect diabetic foot ulcers every three months by a physician.
A state-sponsored healthcare measure might specify guidelines for calculating the number of diabetic patients receiving care at an institution, and then determine the percentage of those patients that received appropriate foot care. Similar measures would exist for the common heart, lung, and joint diseases, among many others. This provides a way to identify the providers that provide the highest quality care, and these recommendations can be downloaded for public consumption. We will discuss specific healthcare measures in Chapter 6, Measuring Healthcare Quality.
Patient-facing treatments for disease
In rare cases, healthcare analytics comprise medical technologies that are used to actually treat diseases, not just perform research on them. An example of this is neuroprosthetics. Neuroprosthetics can be defined as the enhancement of nervous system function using man-made devices. Neuroprosthetics research has enabled patients with disabilities such as blindness or paraplegia to recover some of their lost function. For example, a paralyzed patient may be able to move a computer cursor on a screen not with their hand, but by using their brain signals! In this specific application, recordings of the electrical activity of specific neurons are obtained, and a machine learning model is used to determine in which direction the cursor should move given the firing of the neurons. Similar analytics can be used for visual impairments, or for visualizing what a human is seeing. A second example includes implanting devices in the body that detect seizures before they occur and proactively administer preventive medication. Certainly, the sky is the limit for analytic-driven treatments.
Exploring the software
In this section, we'll download, install, and explore Anaconda and SQLite, the distributions that we will use in this book for Python and SQL, respectively.
Anaconda
The examples in this book require the use of the Python programming language. There are many distributions of Python available. Anaconda is a free, open source Python distribution designed specifically for machine learning. It includes Python and over 1,000 data science Python libraries (for example, NumPy, scikit-learn, pandas) that can be used on top of the base Python language. It also includes Jupyter notebook, an interactive Python console that we will use extensively in this book. Additional tools that come with Anaconda include the Spyder IDE (short for interactive development environment) and RStudio.
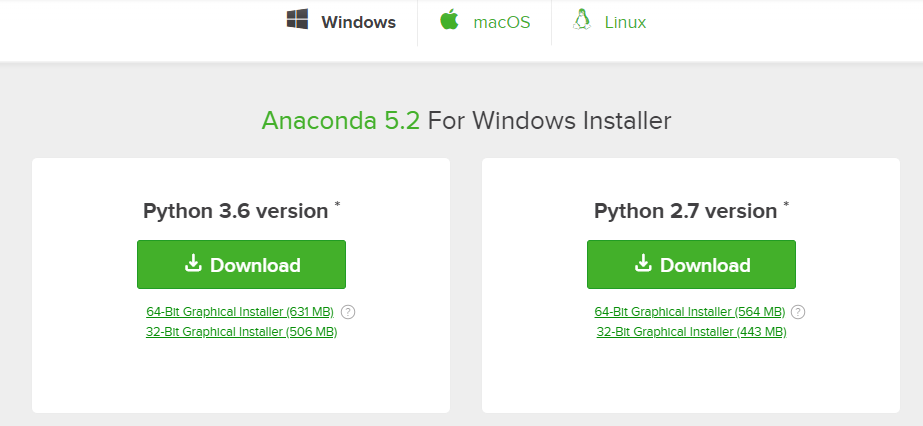
Anaconda can be downloaded from https://www.continuum.io/downloads.
To download the Anaconda distribution of Python, complete the following steps:
- Navigate to the preceding website.
- Choose the appropriate Python download depending on your operating system and desired Python version. For this book, we used Anaconda 5.2.0 (the 64-bit installation for Windows, which includes Python 3.6):
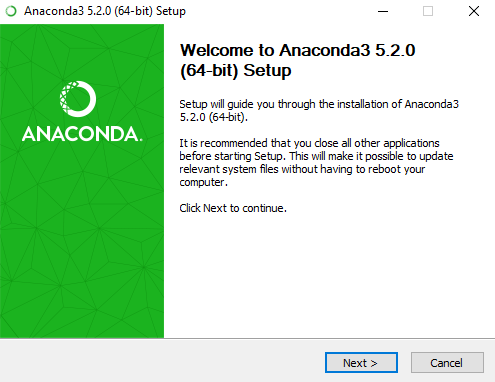
- Click Download. Your browser will begin to download the file. Once it is finished, click on the file in your web browser or in your OS file manager.
- A window will appear (shown in the following screenshot). Click on the Next> button:
- Continue to follow the prompts, which include accepting the license agreement, choosing the users for the installation, selecting the file destination, and choosing various options.
- Anaconda will begin to install. Due to the number of packages included in the installation, this may take a while.
- After the installation is complete, close the Anaconda window.
Anaconda navigator
Now that you have installed Anaconda, you can access its features by searching for Anaconda Navigator in the Windows toolbar, or by looking for Anaconda Navigator in the Applications folder of your Mac. Once you click on the icon, after a short pause, you will see a screen similar to the following:
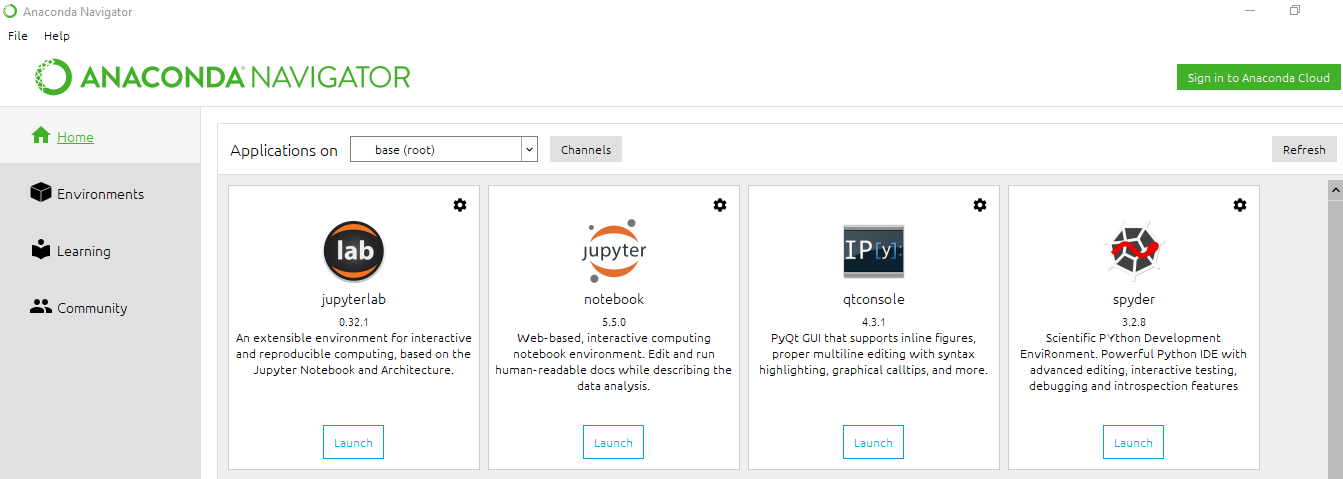
You are currently at the Home tab, which lists the different applications included in Anaconda. You can access Jupyter notebook from this screen, as well as the Spyder IDE.
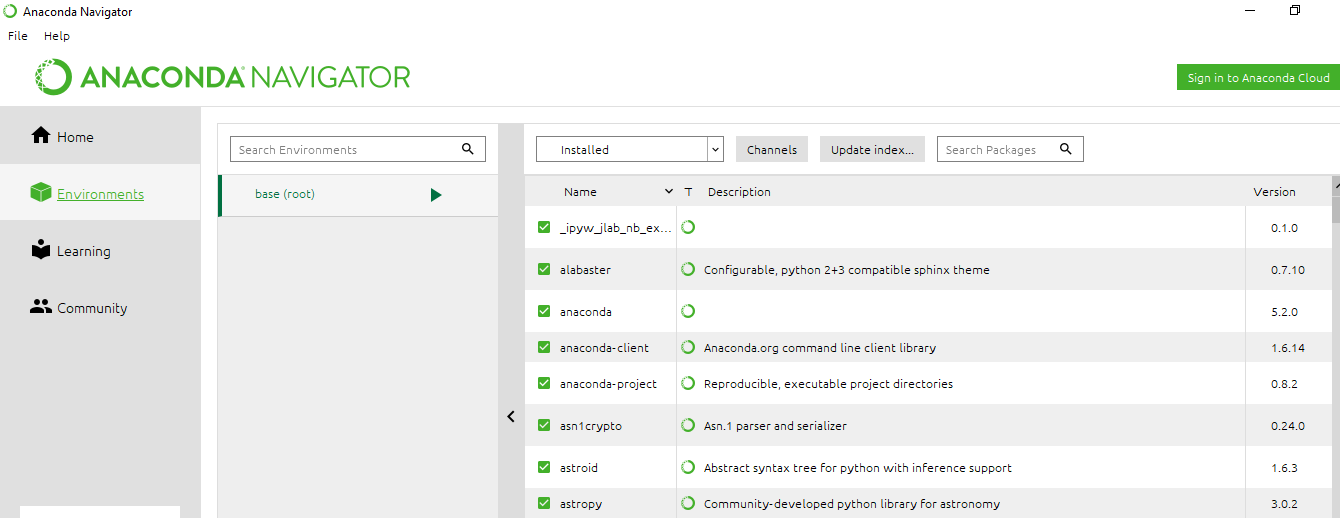
To see which software libraries are installed, click on the Environments tab on the left. You can use this tab to download and upgrade specific libraries as desired, as shown in the following screenshot:
Jupyter notebook
Now, let's explore Jupyter notebook, the Python programming tool we will use for most of this book. Go back to the Home tab and click the Launch button inside Jupyter icon. A new tab should open in your default browser that looks similar to the following screenshot:
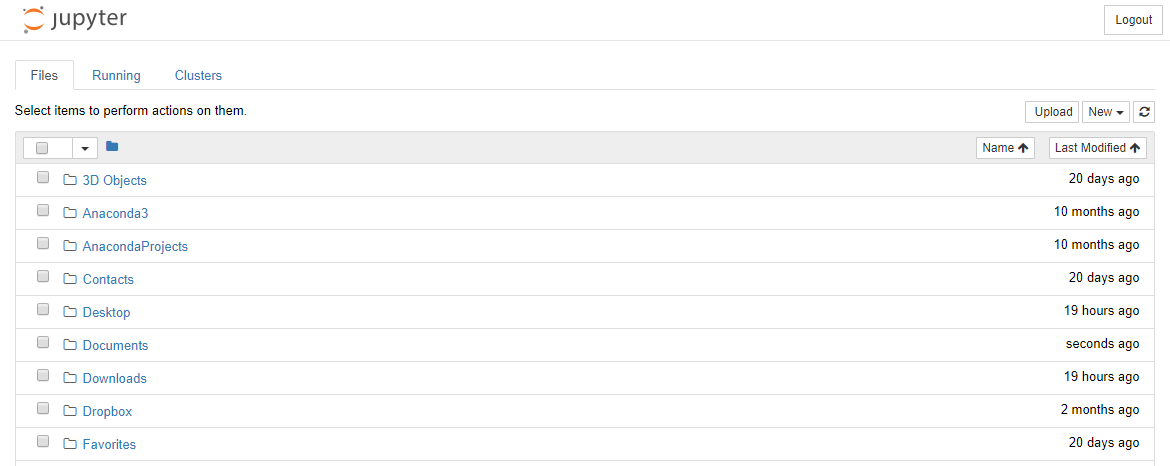
This is the Files tab of the Jupyter application, where you can navigate your computer's directories to launch a new Jupyter notebook, open an existing one, or manage your directories.
Let's create a new Jupyter notebook. Locate the New drop-down menu on the upper right of the console and click it. In the drop-down menu, click Python 3. Another tab will open what looks like the following screenshot:
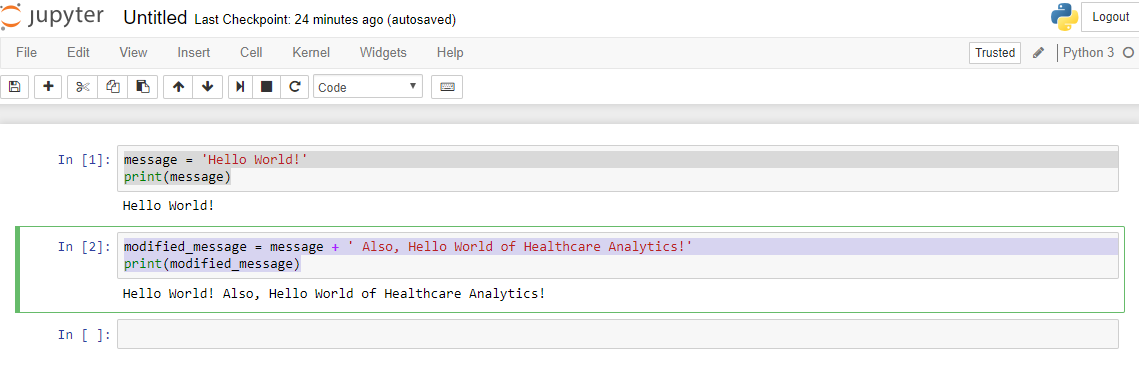
The box labeled with In is called a cell. The cell is the functional unit of Python programming inside of Jupyter. You enter your code in a cell and then click run to execute it. After you see the result, you can create a new cell and continue with your workflow, building on the previous results if you so choose.
Let's try an example. Click in the cell body, and type the following lines:
message = 'Hello World!'
print(message)
Then, find the Play button on the top toolbar and click it. You should see the Hello World! message immediately following the cell. You will also see a new cell below the text. This is the way Jupyter works.
Now, in the new cell, enter the following:
modified_message = message + ' Also, Hello World of Healthcare Analytics!'
print(modified_message)
Again, click the Play button. You should see the modified message under the second cell and the appearance of a third cell. Notice that the second cell is aware of what the message variable contains, even though it was assigned in the first cell. Jupyter remembers every command entered into the console for each session. To clear the memory, you must shut down and restart the kernel:
Now, let's end the current session. Go back to the Home tab in your browser. Click on the Running tab in the upper left. Under the Notebooks menu, you should see that Untitled.ipynb is running. Click the Shutdown button to the right and the notebook will disappear.
That's enough Jupyter for now. You will get more closely acquainted with it in the coming chapters.
Spyder IDE
The Spyder IDE offers a complete environment for Python development, including a text editor, variable explorer, IPython console, and optionally, a command prompt, as seen in the following screenshot:
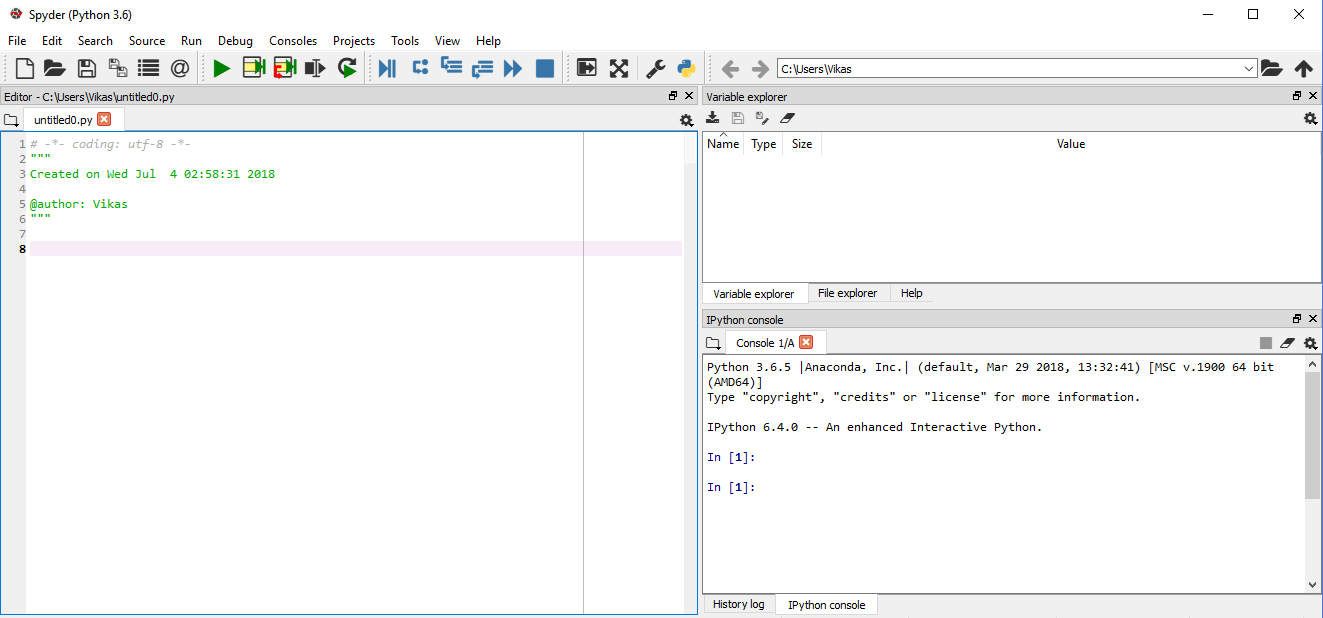
On the left half of the screen is the Editor window. This is where you will write your Python code. Once we are finished with the scripts, we will run them using the green Play button in the upper toolbar.
The right half of the screen is divided horizontally into two parts. The top-right window, in its most useful form, functions as a Variable explorer (as shown). This window lists the name, type, size, and value of every variable that is currently in your Python environment (for example, in memory). By clicking on the tabs at the bottom of the window, you can also change the window to a File explorer or explore Python's helper documentation.
The bottom-right window is the console. It features a Python command prompt. This is useful for running single Python commands; it can also be used to run Python scripts and for other functions. The third option for this window is a history log of previously entered commands.
We will not use Spyder extensively in this book; however, it is good to know how it works in case you would like to use it for later projects.
SQLite
Healthcare data is commonly stored in databases. To manipulate and extract the desired data from these databases, you should know SQL. SQL is a language that has many variations depending on the engine you use. We will be using SQLite, a free, public-domain SQL database engine.
To download SQLite, do the following:
- Navigate to the SQLite homepage (www.sqlite.org). Then, click on the Downloads tab at the top.
- Download the appropriate precompiled binary file for your operating system. You want the bundle file, not the DLL file (the file named with the following format: sqlite-tools-{Your OS}-x86-{Version Number}.zip).
- Using a shell or command prompt, navigate to the directory containing the sqlite3.exe program.
- At the prompt, type sqlite3 test.db and press Enter.
You are now in the SQLite program. Later, we will use SQLite commands to create, save, and manipulate mock patient data. SQLite commands start with a period followed by a lowercase word and then the command arguments.
To exit SQLite, type .exit and press Enter.
Command-line tools
All operating systems, whether Windows, MacOS, or Linux, come with a command-line tool for entering commands. On Mac or Linux, the shell program takes bash commands. On Windows, there are DOS commands that are different than bash. For this book, we used a Windows PC and the DOS command prompt. Where necessary, we have included the commands we used in the text along with the corresponding bash command.
Installing a text editor
Some of the data files used in this book are quite large and may not open using the standard text editor that comes with your computer. We recommend using a downloadable source code editor instead. Popular choices include Sublime (for Windows and Mac) or Notepad++ (for Windows). We used Notepad++ for this book.
Summary
Now that we have introduced the subject of healthcare analytics and set up your computer for the remainder of this book, we are ready to dive into some foundations of healthcare analytics. In Chapter 2, Healthcare Foundations, we will look at some of the healthcare foundations of healthcare analytics.
References
Basole RC, Kumar V, Braunstein ML, et al. (2015). Analyzing and Visualizing Clinical Pathway Adherence in the Emergency Department. Nashville, TN: INFORMS Healthcare Conference, July 29-31, 2015.
Baxt, WG (1990). "Use of an Artificial Neural Network for Data Analysis in Clinical Decision-Making: The Diagnosis of Acute Coronary Occlusion." Neural Computation 2 (4): 480-489.
Ledley RS, Lusted LB (1959). "Reasoning Foundations of Medical Diagnosis." Science 130 (3366): 9-21.
Miller RA, Pople Jr. HE, Myers JD (1982). "INTERNIST-1, An Experimental Computer-Based Diagnostic Consultant for General Internal Medicine." New Engl J Med 307: 468-476.
Minsky M, Papert SA ( 1969). "Perceptrons." Cambridge, MA: The MIT Press.
Rumelhart DE, Hinton GE, Williams RJ (1986). "Learning representations by back-propagating errors." Nature 323(9): 533-536.