Download code from GitHub
The technique used to collect data often determines the type of models that can be utilized. If a seismograph only reported the current reading of seismic activity once an hour, it would be meaningless. The data would not be high fidelity enough to predict earthquakes. The job of a data scientist in an IoT project does not start after the data is collected but rather, the data scientist needs to be part of the building of the device. When a device is built, the data scientist needs to determine whether the device is emitting the type of data that is appropriate for machine learning. Next, the data scientist helps the electrical engineer determine whether the sensors are in the right places and whether there is a correlation between sensors, and finally, the data scientist needs to store data in a way that is efficient to perform analytics. By doing so, we avoid the first major pitfall of IoT, which is collecting and storing data that is, in the end, useless for machine learning.
This chapter examines storing, collecting, and analyzing data to ensure that there is enough data to perform effective and efficient machine learning. We are going to start by looking at how data is stored and accessed. Then, we are going to look at data collection design to ensure that the data coming off the device is feasible for machine learning.
This chapter will cover the following recipes:
- Storing data for analysis using Delta Lake
- Data collection design
- Windowing
- Exploratory factor analysis
- Implementing analytic queries in Mongo/hot path storage
- Ingesting IoT data into Spark
Storing data for analysis using Delta Lake
Today, there are many options for dealing with data for analysis. You can store it in a data lake, Delta Lake, or a NoSQL database. This recipe covers data storage and retrieval and using Delta Lake. Delta Lake provides the fastest way to work with data and the most efficient way to store data. It also allows you to look at data as it existed at any given time in the past.
Getting ready
While Delta Lake is an open source project, the easiest way to store files in Delta Lake is through Databricks. The setup of Databricks was discussed in Chapter 1, Setting Up the IoT and AI Environment. This recipe assumes you have Databricks set up and running.
How to do it...
Importing files into Delta Lake is easy. Data can be imported through files or streaming. The steps for this recipe are as follows:
- In Databricks, open the data panel by clicking on the Data button, click on the Add Data button, and drag your file into the Upload section.
- Click on Create Table in Notebook. The code generated for you will start with this:
# File location and type
file_location = "/FileStore/tables/soilmoisture_dataset.csv"
file_type = "csv"

# CSV options
infer_schema = "false"
first_row_is_header = "false"
delimiter = ","

df = spark.read.format(file_type) \
  .option("inferSchema", infer_schema) \
  .option("header", first_row_is_header) \
  .option("sep", delimiter) \
  .load(file_location)

display(df)
- Review the data and when you are ready to save to Delta Lake, uncomment the last line:
# df.write.format("parquet").saveAsTable(permanent_table_name)
- Then, change "parquet" to "delta":
df.write.format("delta").saveAsTable(permanent_table_name)
- From here, query the data:
%sql
SELECT * FROM soilmoisture
- Alternatively, you can optimize how Delta Lake saves the file, making querying faster:
%sql
OPTIMIZE soilmoisture ZORDER BY (deviceid)
Delta Lake data can be updated, filtered, and aggregated. In addition, it can be turned into a Spark or Koalas DataFrame easily.
How it works...
Delta Lake is built on top of Parquet. Utilizing columnar compression and metadata storage, it can make the retrieval of data 10 times faster than standard Parquet. In addition to faster performance, Delta Lake's data versioning allows data scientists to look at how data was at a particular time, allowing data scientists to perform root cause analysis when their models drift.
Data collection design
The single most important factor in machine learning and IoT is data collection design. If the data collected is garbage data, then no machine learning can be done on top of it. Suppose you are looking at vibrations of a pump (shown in the following graph) to determine whether the pump is having issues with its mechanics or ball bearings so that preventive maintenance can be performed before serious damage is done to the machine:
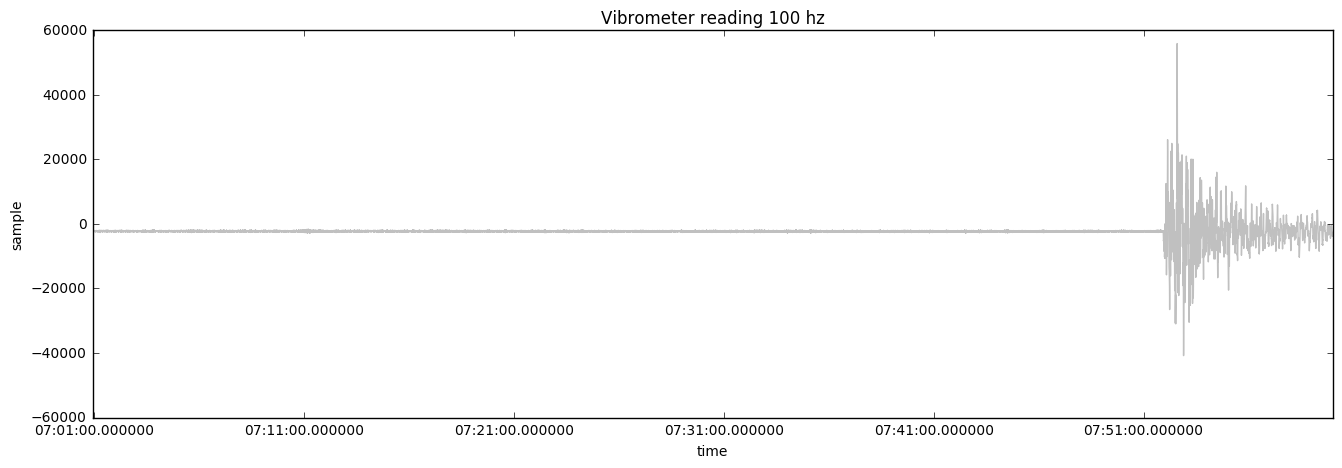
Importantly, real-time data at 100 Hz is prohibitively expensive to store in the cloud. To keep costs down, engineers often send data at frequencies of 1 minute. Low-frequency sensor data often cannot accurately represent the issue that is being looked at. The next chart shows how the data looks when only sampled once per minute:
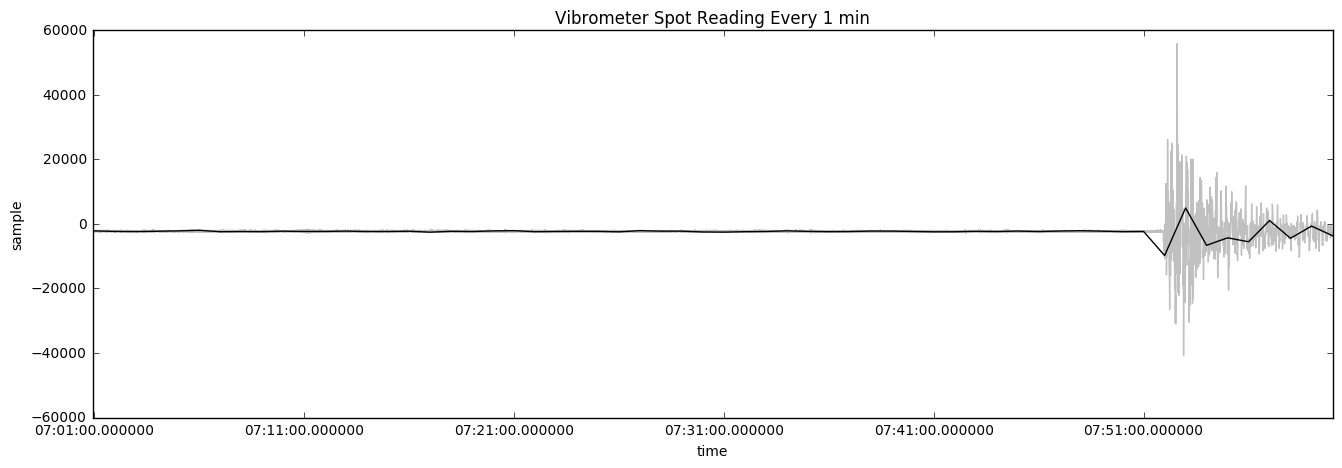
Here, we see vibrometer data overlaid with the data that is being collected in 1-minute intervals. The data has some use but it is not accurate as it does not show the true magnitude of what is going on with the data. Using the mean is worse. The following chart shows the average reading of the vibrometer's mean over 1 minute:
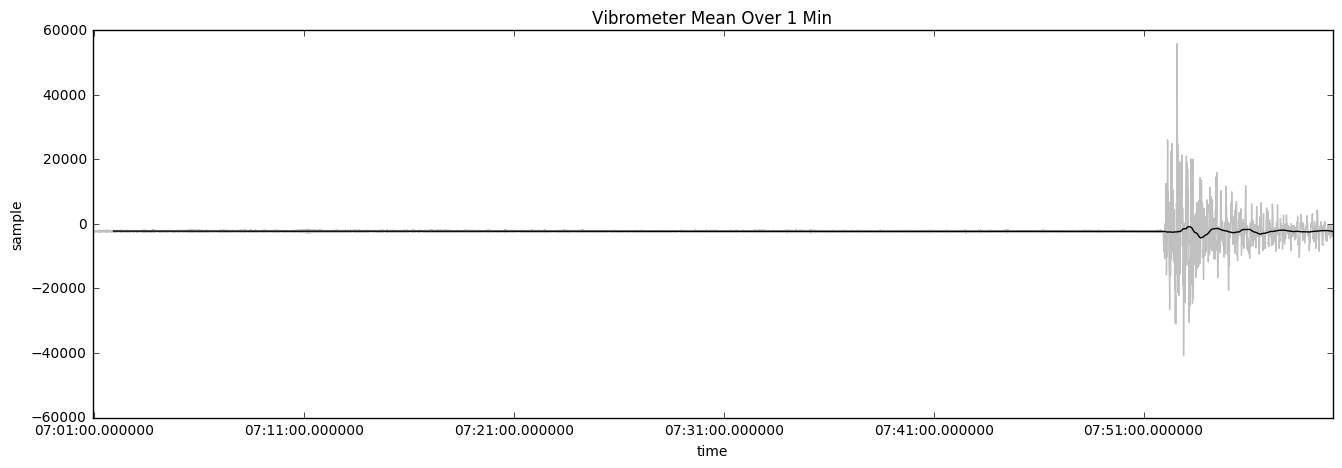
Taking the average reading windowed over 1 minute is an even worse solution because the average value is not changing when there is a problem with the pump. The following chart shows the vibrometer's standard reading over 1 minute:
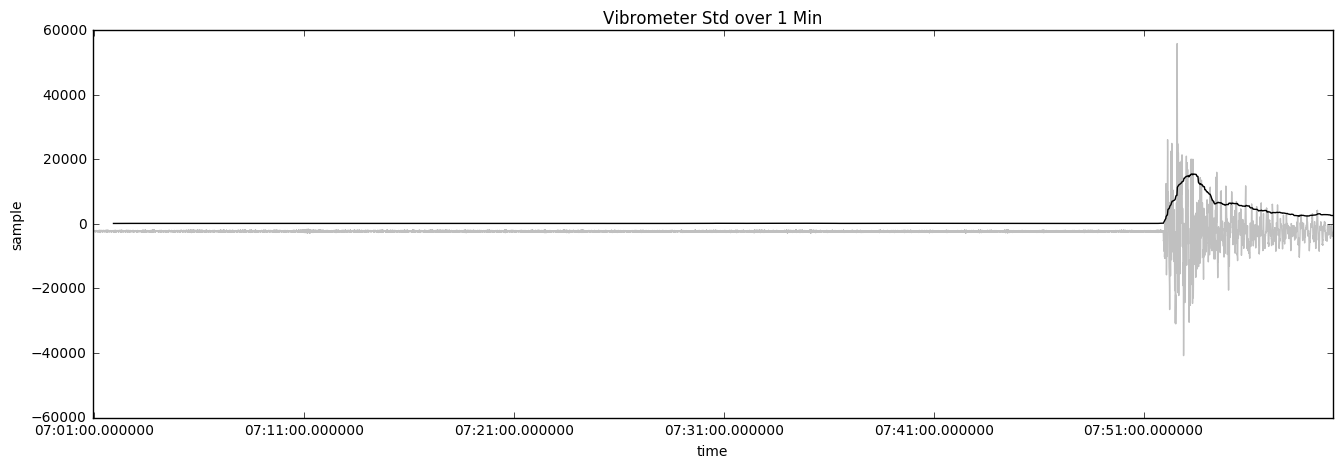
Using a standard deviation technique shows variance compared to the mean to determine whether there is an issue with the pump. This is a more accurate solution over the average technique.
Using minimum and maximum windowed over a 1-minute window can present the best representation of the magnitude of the situation. The following chart shows what the reading will look like:
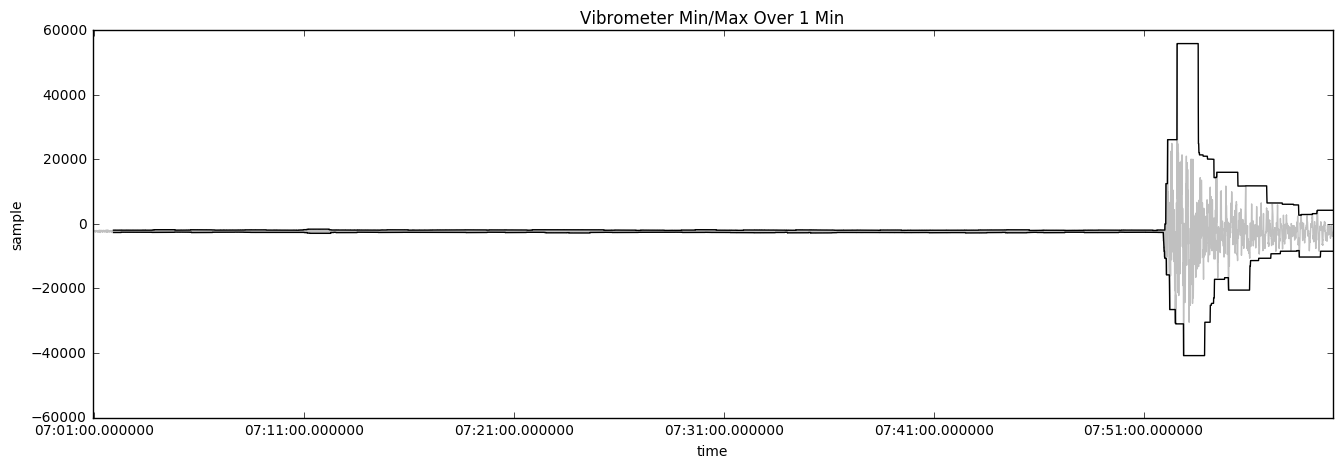
Because IoT machines can work correctly for years before having issues and forwarding high-frequency data in the cloud is cost-prohibitive, other measurements are used to determine whether the device needs maintenance. Techniques such as min/max, standard deviation, or spikes can be used to trigger a cloud-to-device message telling the device to send data at a much higher frequency. High-frequency diagnostic data can use blob storage to store large files.
One of the challenges of IoT is finding meaningful data in a sea of data. In this recipe, we shall demonstrate techniques to mine for valuable data.
Getting ready
To get ready for data collection design, you will need a device streaming data at a high rate. In Chapter 1, Setting Up the IoT and AI Environment, we discussed getting a device streaming data into IoT Hub. Often in production, device data is sent in intervals of 15 seconds or 1 minute. But for data collection design, one device is sending data at a high rate of 10 Hz, or 10 times a second. Once that data is flowing in, you can pull it into Databricks for real-time analysis.
How to do it...
In our Databricks notebooks, we will analyze of the IoT data using techniques such as variance, Z-Spikes, and min/max.
Variance
Variance is the measure of how much the data varies from the mean. In the code that follows, we are using Koalas, a distributed clone of pandas, to do our basic data engineering tasks, such as determining variance. The following code uses standard deviation over a rolling window to show data spike issues:
import databricks.koalas as ks

df = ks.DataFrame(pump_data)
print("variance: " + str(df.var()))
minuite['time'] = pd.to_datetime(minuite['time'])
minuite.set_index('time')
minuite['sample'] = minuite['sample'].rolling(window=600,center=False).std()
We can also look at high and low values such as maximum to show whether the sensor is throwing out appropriate readings. The following code shows the maximum reading of our dataset:
max = DF.agg({"averageRating": "max"}).collect()[0]
Z-Spikes
Spikes can help determine whether there is an issue by looking at how rapidly a reading is changing. For example, an outdoor IoT device may have a different operating temperature in the South Pole compared to one in direct sun in Death Valley. One way of finding out whether there is an issue with the device is by looking at how fast the temperature is changing. Z-Spikes are a typical time-based anomaly detection. It is used because it only looks at that device's readings and can give a value independent of environmental factors.
Min/max
Mins and maxes can show the value that shows the most stress on the system. The following code shows how to get the min and max values of a 1-minute window:
minute['max'] = minute['sample'].rolling(window=600,center=False).max()

minute['sample'] = minute['sample'].rolling(window=600,center=False).min()
Minimum and maximum values can emphasize outliers. This can be useful in determining anomalies.
Windowing
There are three primary windowing functions: tumbling, hopping, and sliding. Both Spark and Stream Analytics can do windowing. Windowing allows you to look at aggregate functions such as average, count, and sum. It also allows you to look at minimum and maximum values. Windowing is a feature engineering technique to help make data more manageable. In this recipe, we are going to cover several tools for windowing and the ways to window.
Getting ready
To get ready, you will also need a device streaming data to IoT Hub. That stream will need to be ingested by either Azure's Stream Analytics, Spark, or Databricks.
How to do it...
Utilize a Databricks notebook or Stream Analytics workspace to perform the recipes. Windowing turns the static of large datasets into meaningful features of your machine learning model.
Tumbling
Tumbling window functions group data streams into time segments (as shown in the following diagram). Tumbling windows means that the window does not repeat or overlap data from one segment waterfall into the next:

Stream Analytics
In Stream Analytics, one way to use a tumbling window to count the events that happen every 10 seconds would be to do the following:
SELECT EventTime, Count(*) AS Count
FROM DeviceStream TIMESTAMP BY CreatedAt
GROUP by EventTime, TumbelingWindow(minuites, 10)
Spark
In Spark, to do the same count of events happening every 10 minutes, you would do the following:
from pyspark.sql.functions import *
windowedDF = eventsDF.groupBy(window("eventTime", "10 minute")).count()
Hopping
Hopping windows are tumbling windows that overlap. They allow you to set specific commands and conditions, such as every 5 minutes, give me the count of the sensor readings over the last 10 minutes. To make a hopping window the same as a tumbling window, you would make the hop size the same as the window size, as shown in the following diagram:

Stream Analytics
The following Stream Analytics example shows a count of messages over a 10-minute window. This count happens every 5 minutes:
SELECT EventTime, Count(*) AS Count
FROM DeviceStream TIMESTAMP BY CreatedAt
GROUP by EventTime, HopingWindow(minuites, 10, 5)
Spark
In PySpark, this would be done through a window function. The following example shows a Spark DataFrame that is windowed, producing an entry in a new entry in a DataFrame for every 5 minutes spanning a 10-minute period:
from pyspark.sql.functions import *
windowedDF = eventsDF.groupBy(window("eventTime", "10 minute", "5 minute")).count()
Sliding
Sliding windows produce an output when an event occurs. The following diagram illustrates this concept:

Stream Analytics
In the Stream Analytics example, by using a sliding window, we only receive a result when there are more than 100 messages over a 10-minute window. Unlike other methods that look at an exact window of time and show one message for that window, in sliding windows, we would receive a message on every input message. Another use of this would be to show a rolling average:
SELECT EventTime, Count(*) AS Count
FROM DeviceStream TIMESTAMP BY CreatedAt
GROUP by EventTime,
SlidingWindow(minutes, 10)
WHERE COUNT(*) > 100
How it works...
Using windowing, IoT data can show factors such as frequency, sums, standard deviation, and percentile distribution over a period of time. Windowing can be used to enrich the data with feature engineering or can transform the data into an aggregate dataset. Windowing, for example, can show how many devices were produced in a factory or show the modulation in a sensor reading.
Exploratory factor analysis
Garbage data is one of the key issues that plague IoT. Data is often not validated before it is collected. Often, there are issues with bad sensor placement or data that appears to be random because it is not an appropriate measure for the type of data being used. For example, a vibrometer may show, because of the central limit theorem, that the data is centered around the mean, whereas the data is actually showing a large increase in magnitude. To combat this, it is important to do exploratory factor analysis on the device data.
In this recipe, we will explore several techniques of factor analysis. Aggregate data and raw telemetry data are used in Databricks notebooks to perform this analysis.
Getting ready
You will need to have data in a table in Databricks, which we implemented in the Storing data for analysis using Delta Lake recipe. Once data is in a Spark data table, it is ready for factor analysis.
How to do it...
This recipe is composed of two sections. The first is performing a visual inspection of data. Visual inspection can reveal software bugs, learn about how the device behaves, and determine device data patterns. The second part looks at correlation and co-variance. These techniques are often used to determine whether a sensor is redundant.
Visual exploration
Spark allows you to look at basic charts without much code. Using the magic symbol at the top of the notebook segment, you can change language easily from Python to Scala or SQL. One word of caution about using Databricks' built-in charting system is that it only looks at the first 10,000 records. For a large dataset, there are other charting libraries. The steps are as follows:
- Query the data in Databricks using the %sql magic, as shown:
%sql
select * from Telemetry
- Select the chart icon at the bottom of the returned data grid. It will bring up the chart builder UI, as shown in the following screenshot:

- Select the chart type that best represents the data. Some charts are better suited for variable comparison while others can help reveal trends.
The following section reviews when and why you would use different chart types.
Chart types
Different types of charts illuminate different aspects of the data, such as comparison, composition, relationship, and distribution. Relationship charts are used to test a hypothesis or look at how one factor affects other factors. Composition shows the percentage breakdown of a dataset. It is often used to show how factors compare against others. A pie chart is a simple composition chart. Distribution charts are used to show distributions of a population. They are often used to determine whether the data is random, has a large spread, or is normalized. Comparison charts are used to compare one value against others.
Bar and column charts
Bar and column charts are used to make a comparison between items. Bar charts can have many items simply because of the page layout. Column and bar charts can also show change over time. The following chart is an example of a bar and column chart:

Scatter plot
Scatter plots can show the relationship between two variables. It also can show a trend line. The following is an example of a scatter plot:

Bubble charts
When you want to show the relationship between three variables, you can use bubble charts. This can be used to show anomalous behavior. The following is an example of a bubble chart:

Line charts
These charts show changes over time and can be used to show how a device's data changes over a day. If a device has seasonal data, you may need to include the time of day as part of the algorithm or use de-seasonal algorithms. The following is an example of a line chart:

Area charts
Area charts are like line charts but are used to show how the volume of one segment compares to another. The following is an example of an area chart:

Quantile plot
Help determine population shape by spitting data into segments (quantiles). Common quantiles are 25%, 50%, and 75%, or 33% and 66%, or 5% and 95% (percentages in general are quartiles). Understanding whether data is behaving within expected parameters is important in understanding whether a device is having problems. The following is an example of a quantile plot:

Redundant sensors
One of the challenges of IoT is determining where to place the sensors and how many sensors are needed. Take pumps, for example: one way of determining whether a pump's bearings are going out is to use a microphone to listen for a high-pitched squeal. Another way is to use a parameter to determine whether it is vibrating more. Yet another way is to measure the current and see whether it is fluctuating. There is no one right way to determine whether a pump's ball bearings are going out; however, implementing all three techniques may be cost-prohibitive and redundant. A common way of looking at the correlation between different sensors is using a heat map. In the following code, we use a heat map to find the correlation between sensors. In other words, we are looking for sensors that are transmitting redundant information:
import numpy as np
import pandas as pd
import matplotlib.pyplot as plt
import seaborn as sns


# load the sample training data
train = pd.read_csv('/dbfs/FileStore/tables/Bike_train.csv')

for i in range(50):
    a = np.random.normal(5,i+1,10)
    b.append(a)
c = np.array(b)
cm =np.corrcoef(c)

plt.imshow(cm,interpolation='nearest')
plt.colorbar()

#heat map
plt.figure(figsize=(17,11))
sns.heatmap(train.iloc[:,1:30].corr(), cmap= 'viridis', annot=True)
display(plt.show())
The following screenshot shows the heat map:

In the preceding example, we can see that count and registered have a very high correlation because both numbers are close to 1. Similarly, we can see that temp and atemp have a high degree of correlation. Using this data without pruning out the corollary data can give a weighted effect to machine learning models training on the dataset.
When a device has very little data, it still may be valuable to perform analysis of variance, distribution, and deviation. Because it has a lower bar of entry than machine learning, it can be deployed at an earlier phase in the machine's life cycle. Doing statistical analysis helps ensure that the device is setting proper data that is not duplicated or false and can be used for machine learning.
Cross-tabulation provides a table of the frequency distributions. This can be used to determine whether two different sensors are counting the same. The following is the code to display the cross-tabulation table:
display(DF.stat.crosstab("titleType", "genres"))
Sample co-variance and correlation
Co-variance measures the joint variability change of two sensors with respect to each other. Positive numbers would indicate that the sensors are reporting the same data. Negative numbers indicate that there is an inverse relationship between the sensors. The co-variance of two sensors can be calculated using the DataFrame stat.cov function in a Spark DataFrame:
df.stat.cov('averageRating', 'numVotes')
How it works...
Modifying physical devices after they have been produced can be costly. This recipe shows how to inspect a prototype device to make sure the data produced by it will not be meaningless. Using data analysis tools such as Databricks for preliminary data analysis can save us from issues that plague IoT and AI, such as bad sensor placement, under- or overcommunication, and data that is not usable for machine learning. Performing standard machine learning tasks such as predictive maintenance, anomaly detection, or remaining useful life is dependent on good data.
There's more...
You can further explore data by creating a filtering widget. For example, you could use the CREATE WIDGET DROPDOWN query as shown:
%sql
CREATE WIDGET DROPDOWN tytleType DEFAULT "movie" CHOICES SELECT DISTINCT titleType FROM imdbTitles
Creating a widget allows you to create a data query that can be easily segmented, as shown in the following code:
%sql
select * from imdbTitles where titleType = getArgument("tytleType")
Other widget types, such as text, combo box, and multi-select, also are available.
Implementing analytic queries in Mongo/hot path storage
In IoT architectures, there is hot and cold path data. Hot path data can be accessed immediately. This is typically stored in a NoSQL or time-series database. An example of this would be to use a time-series database such as InfluxDB to count the number of resets per device over the last hour. This could be used to aid in feature engineering. Another use of hot data is precision analysis. If a machine breaks in the field, a database such as MongoDB can be queried for just the data that that machine has generated over the last month.
Cold path data is typically used for batch processing, such as machine learning and monthly reports. Cold path data is primarily data stored in a blob, S3 storage, or HDFS-compliant data store. Separating a hot path from a cold path is usually a factor of cost and scalability. IoT data generally falls into the category of big data. If a data scientist queries years' worth of data from a NoSQL database, the web application that is using it can falter. The same is not true for data stored in the cold path on a disk. On the other hand, if the data scientist needs to query a few hundred records from billions of records, a NoSQL database would be appropriate.
This recipe is focused on working with hot data. This recipe's primary focus is on extracting IoT data from MongoDB. First, we extract data from one device, and then we will aggregate it across multiple devices.
Getting ready
Stream Analytics can get IoT data into MongoDB. To do this, start up MongoDB. This can be done through Azure Kubernetes Service or using the Atlas MongoDB cloud provider. Once you have a database, you can use a function app to move data between IoT Hub and MongoDB.
How to do it...
Mongo has a list of filtering options comparable to SQL. The following code shows how to connect to a local version of Mongo and query for all products with an inventory status of A:
df = spark.read.format("mongo").option("uri",
"mongodb://127.0.0.1/products.inventory").load()
pipeline =  "{'deviceid':'8ea23889-3677-4ebe-80b6-3fee6e38a42c'}"
df = spark.read.format("mongo").option("pipeline", pipeline).load()
df.show()
The next example shows how to do a complicated filter followed by a group by operation. It finally sums the information. The output will show the count of items with a status of A:
pipeline = "[ { '$match': { 'status': 'A' } }, { '$group': { '_id': '$item', 'total': { '$sum': '$qty' } } } ]"
df = spark.read.format("mongo").option("pipeline", pipeline).load()
df.show()
How it works...
Mongo stores indexed data on multiple computers or partitions. This allows retrieval of specific data to be done with latency times in milliseconds. NoSQL databases can provide fast lookup for data. In this recipe, we discussed how to query data from MongoDB into Databricks.
Ingesting IoT data into Spark
To connect Spark to IoT Hub, first, create a consumer group. A consumer group is a pointer to the current position in the journal that the consumer has reached. There can be multiple consumers on the same journal of data. The consumer group is paralyzed and distributable, enabling you to write programs that can remain stable even on a massive scale.
Getting ready
For this recipe, go into the Azure IoT Hub portal and click on the Build-in endpoints menu option. Then, add a consumer group by entering some text. While still on that screen, copy the Event Hub-compatible endpoint connection string.
How to do it...
The steps for this recipe are as follows:
- In Databricks, start a new notebook and enter the information needed to connect to IoT Hub. Then, enter the following code:
import datetime as dt
import json

ehConf = {}
ehConf['eventhubs.connectionString'] = ["The connection string you copies"]
ehConf['eventhubs.consumerGroup'] = "[The consumer group you created]"

startingEventPosition = {
  "offset": -1,
  "seqNo": -1, #not in use
  "enqueuedTime": None, #not in use
  "isInclusive": True
}

endingEventPosition = {
  "offset": None, #not in use
  "seqNo": -1, #not in use
  "enqueuedTime": endTime,
  "isInclusive": True
}
ehConf["eventhubs.recieverTimeout"] = 100
- Put the data into a Spark DataFrame:
df = spark \
 .readStream \
 .format("eventhubs") \
 .options(**ehConf) \
 .load()
- The next step is to apply a structure to the data so that you can use structured streaming:
from pyspark.sql.types import *
Schema = StructType([StructField("deviceEndSessionTime", StringType()), StructField("sensor1", StringType()),
 StructField("sensor2", StringType()),
 StructField("deviceId", LongType()),
 ])
- The final step is to apply the schema to a DataFrame. This allows you to work with the data as if it were a table:
from pyspark.sql.functions import *

rawData = df. \
  selectExpr("cast(Body as string) as json"). \
  select(from_json("json", Schema).alias("data")). \
 select("data.*")
How it works...
In this recipe, we connected to IoT Hub and put the data into a DataFrame. Later, we added a structure to that frame, allowing us to query data similarly to the way we query a database table.
In the next few chapters, we will discuss how to create models. After creating models using cold path data, you can perform near-real-time machine learning on it by pushing those trained models into Databricks structured streaming.