Download code from GitHub
In this chapter, we will cover the following recipes:
- Creating, debugging, and executing an analyzer project in Visual Studio
- Creating a symbol analyzer to report issues about symbol declarations
- Creating a syntax node analyzer to report issues about language syntax
- Creating a syntax tree analyzer to analyze source file and report syntax issues
- Creating a method body analyzer to analyze whole method and report issues
- Creating a compilation analyzer to analyze whole compilation and report issues
- Writing unit tests for an analyzer project
- Publishing the NuGet package and VSIX for an analyzer project
Diagnostic analyzers are extensions to the Roslyn C# compiler and Visual Studio IDE to analyze user code and report diagnostics. Users will see these diagnostics in the error list after building the project from Visual Studio, and even when building the project on the command line. They will also see the diagnostics live while editing the source code in the Visual Studio IDE. Analyzers can report diagnostics to enforce specific code styles, improve code quality and maintenance, recommend design guidelines, or even report very domain-specific issues which cannot be covered by the core compiler. This chapter enables C# developers to write, debug, test, and publish analyzers that perform different kinds of analyses.
Note
If you are not familiar with the Roslyn's architecture and API layers, it is recommended that, before reading this chapter further, you read the Preface of this book to gain a basic understanding of Roslyn APIs.
Diagnostic analyzers are built on top of the Roslyn's CodeAnalysis/Compiler layer API. Analyzers can analyze specific code units, such as a symbol, syntax node, code block, compilation, and so on, by registering one or more analyzer actions. The compiler layer makes a callback into the analyzer whenever it compiles a code unit of interest. The analyzer can report diagnostics on code units, which are added to the list of the compiler diagnostics and reported back to the end user.
Analyzers can be broadly categorized into the following two buckets based on the kind of analysis performed:
- Stateless analyzers: Analyzers that report diagnostics about a specific code unit by registering one or more analyzer actions that:
- Do not require maintaining any state across analyzer actions.
- Independent of the order of execution of individual analyzer actions.
For example, an analyzer that looks at every single class declaration independently and reports issues about the declaration is a stateless analyzer. We will show you how to write a stateless symbol, syntax node, and syntax tree analyzer, later in this chapter.
- Stateful analyzers: Analyzers that report diagnostics about a specific code unit, but in the context of an enclosing code unit, such as a code block or a compilation. These are more complicated analyzers that require powerful and wider analysis, hence, need careful design to achieve efficient analyzer execution without memory leaks. These analyzers require at least one of the following kinds of state manipulation for analysis:
- Access to immutable state objects for the enclosing code unit, such as a compilation or the code block. For example, access to certain well-known types defined in a compilation.
- Perform analysis over the enclosing code unit, with mutable state defined and initialized in a start action for the enclosing code unit, intermediate nested actions that access and/or update this state, and an end action to report diagnostic on the individual code units.
For example, an analyzer that looks at all class declarations in a compilation, gathering and updating a common state when analyzing each class declaration, and then finally, after it has analyzed all declarations, reports issues about those declarations is a stateful analyzer. We will show you how to write a stateful method body and compilation analyzer in this chapter.
Note
By default, analyzers can analyze and report diagnostics on source files in a project. However, we can also write an analyzer that analyzes additional files, that is, non-source text files included in the project, and also report diagnostics in additional files. Non-source files could be files, such as Web.config files in a web project, cshtml files in a Razor project, XAML files in a WPF project, and so on. You can read more about how to write and consume additional file analyzers at https://github.com/dotnet/roslyn/blob/master/docs/analyzers/Using%20Additional%20Files.md.
We will show you how to install the .NET Compiler Platform SDK, create an analyzer project from a template, and then debug and execute the default analyzer.
Note
The analyzer project that you create in this recipe can be used in the subsequent recipes in this chapter to add new analyzers and write unit tests.
You will need to have Visual Studio 2017 installed on your machine to execute the recipes in this chapter. You can install a free community version of Visual Studio 2017 from https://www.visualstudio.com/thank-you-downloading-visual-studio/?sku=Community&rel=15.
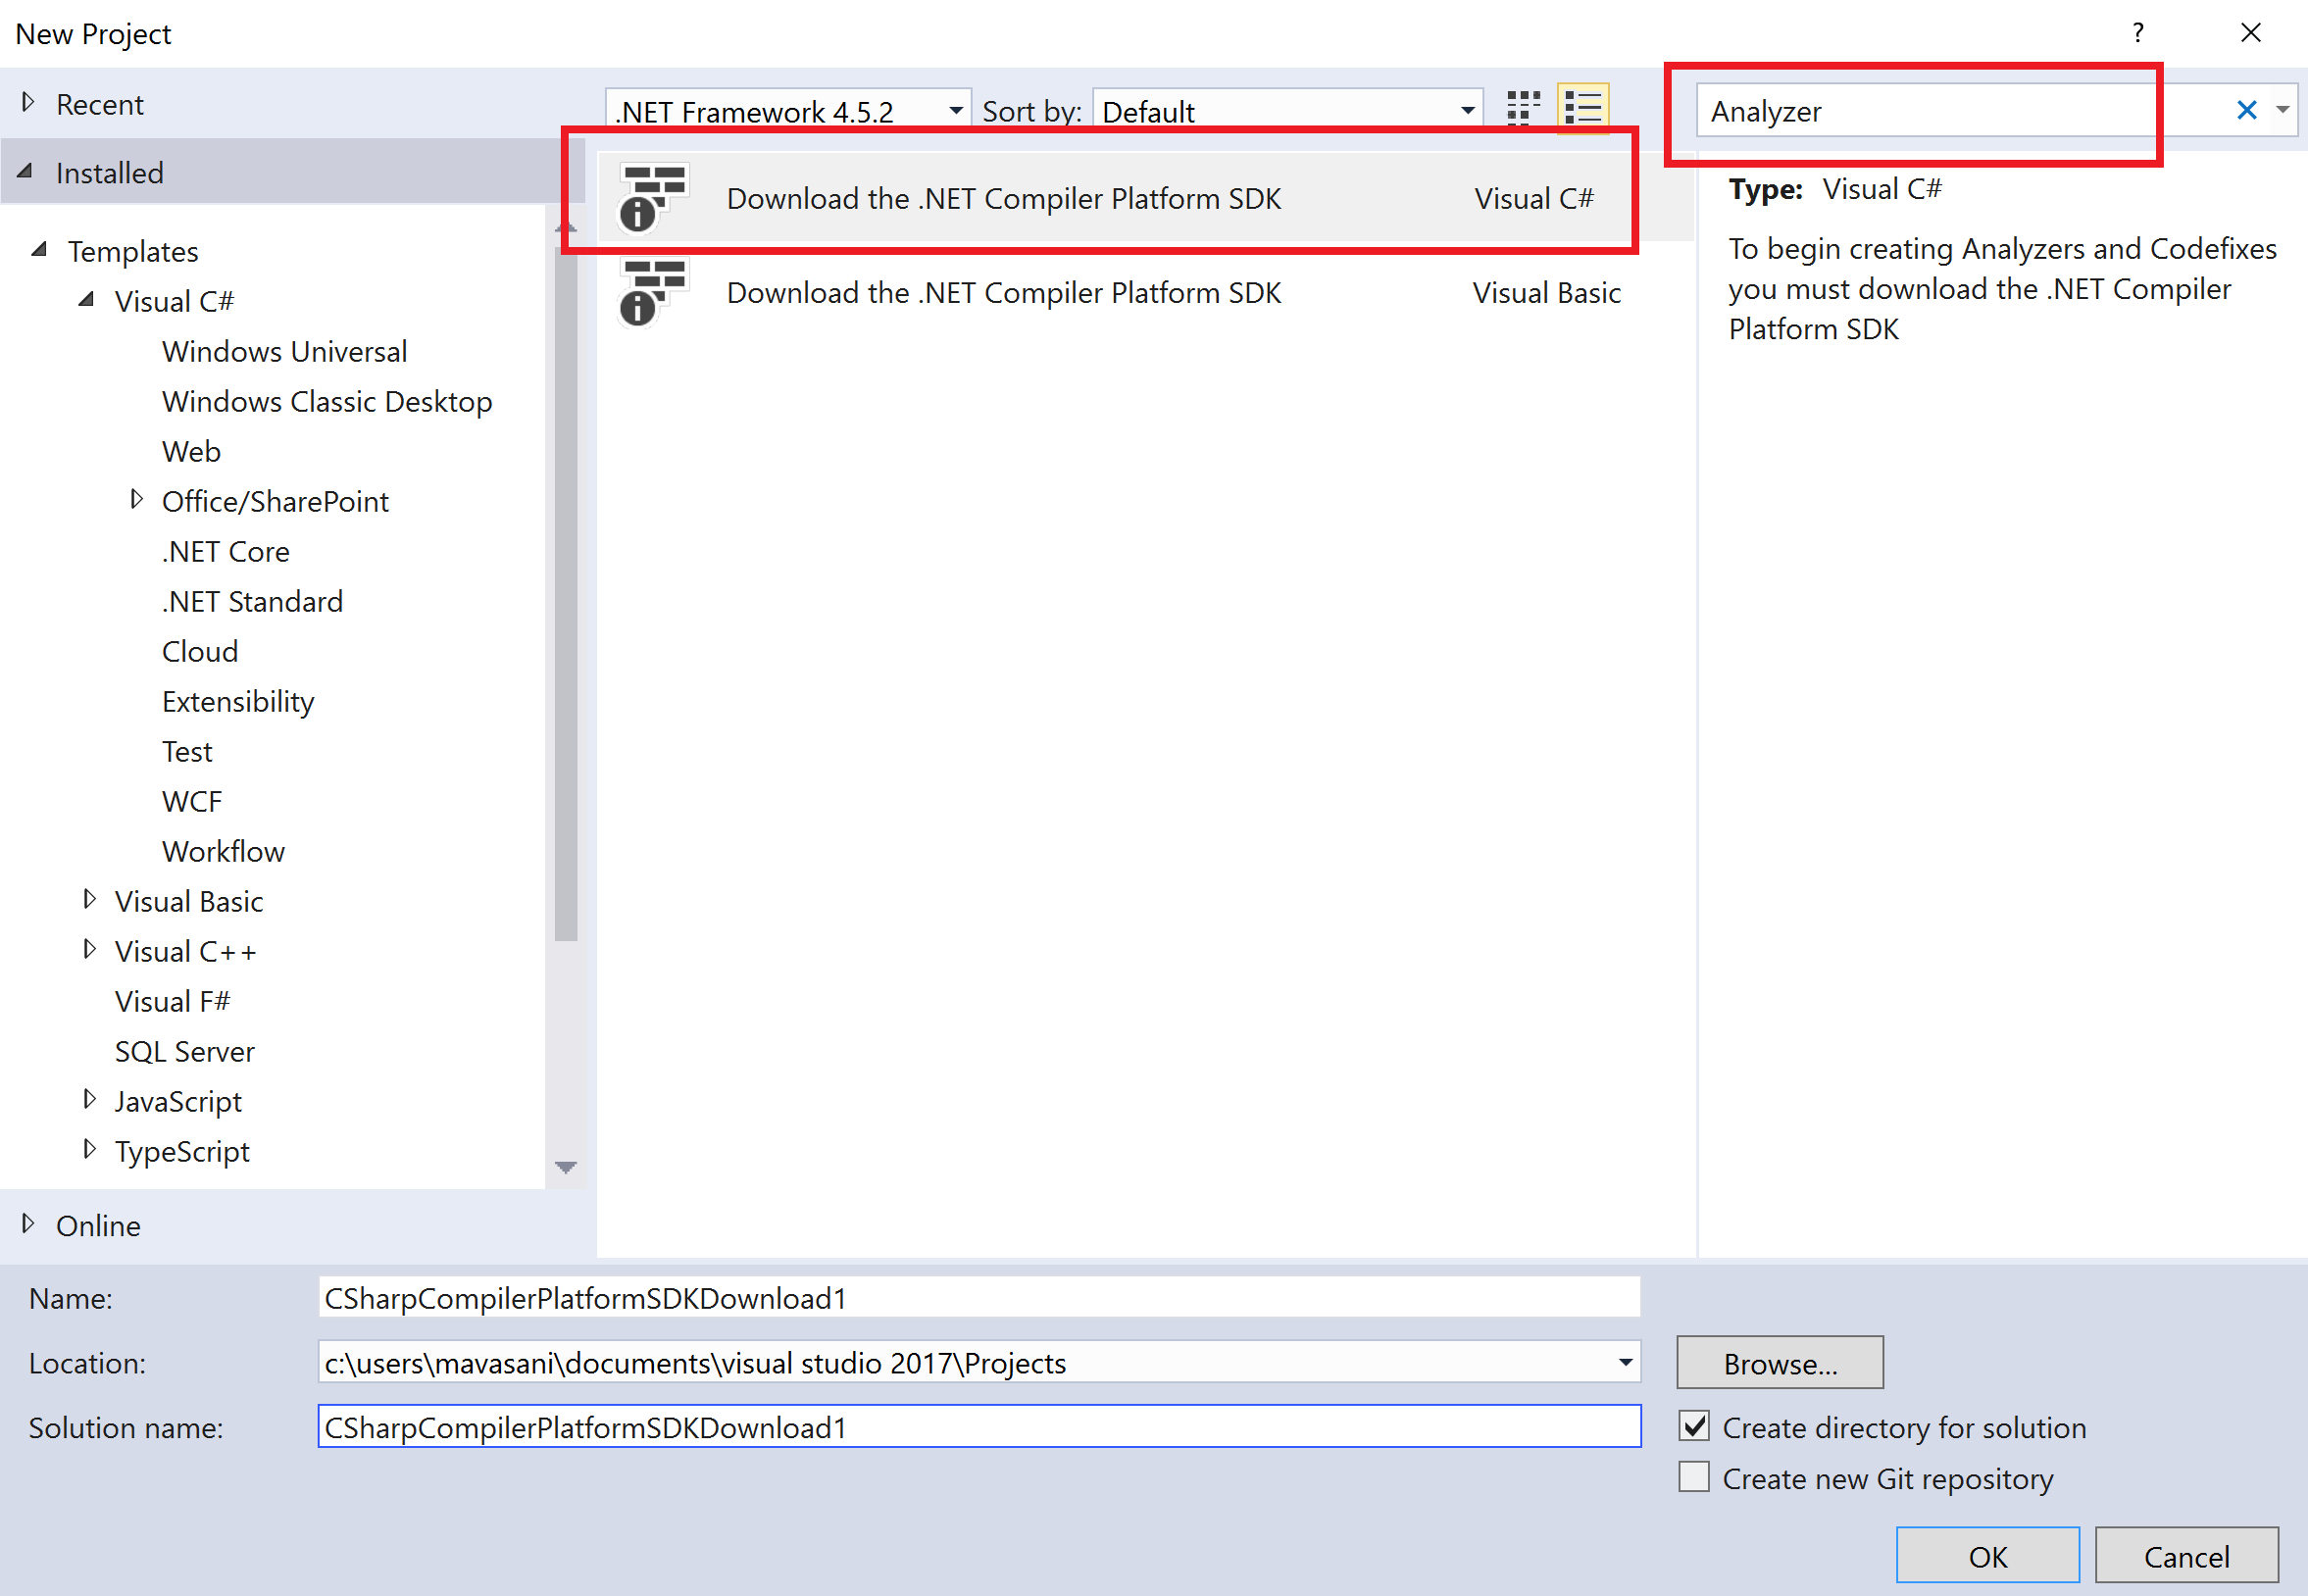
- Start Visual Studio and click on
File|New|Project. - Search for
Analyzertemplates in the textbox at the top right corner of theNew Projectdialog, selectDownload the .NET Compiler Platform SDK, and click onOK:
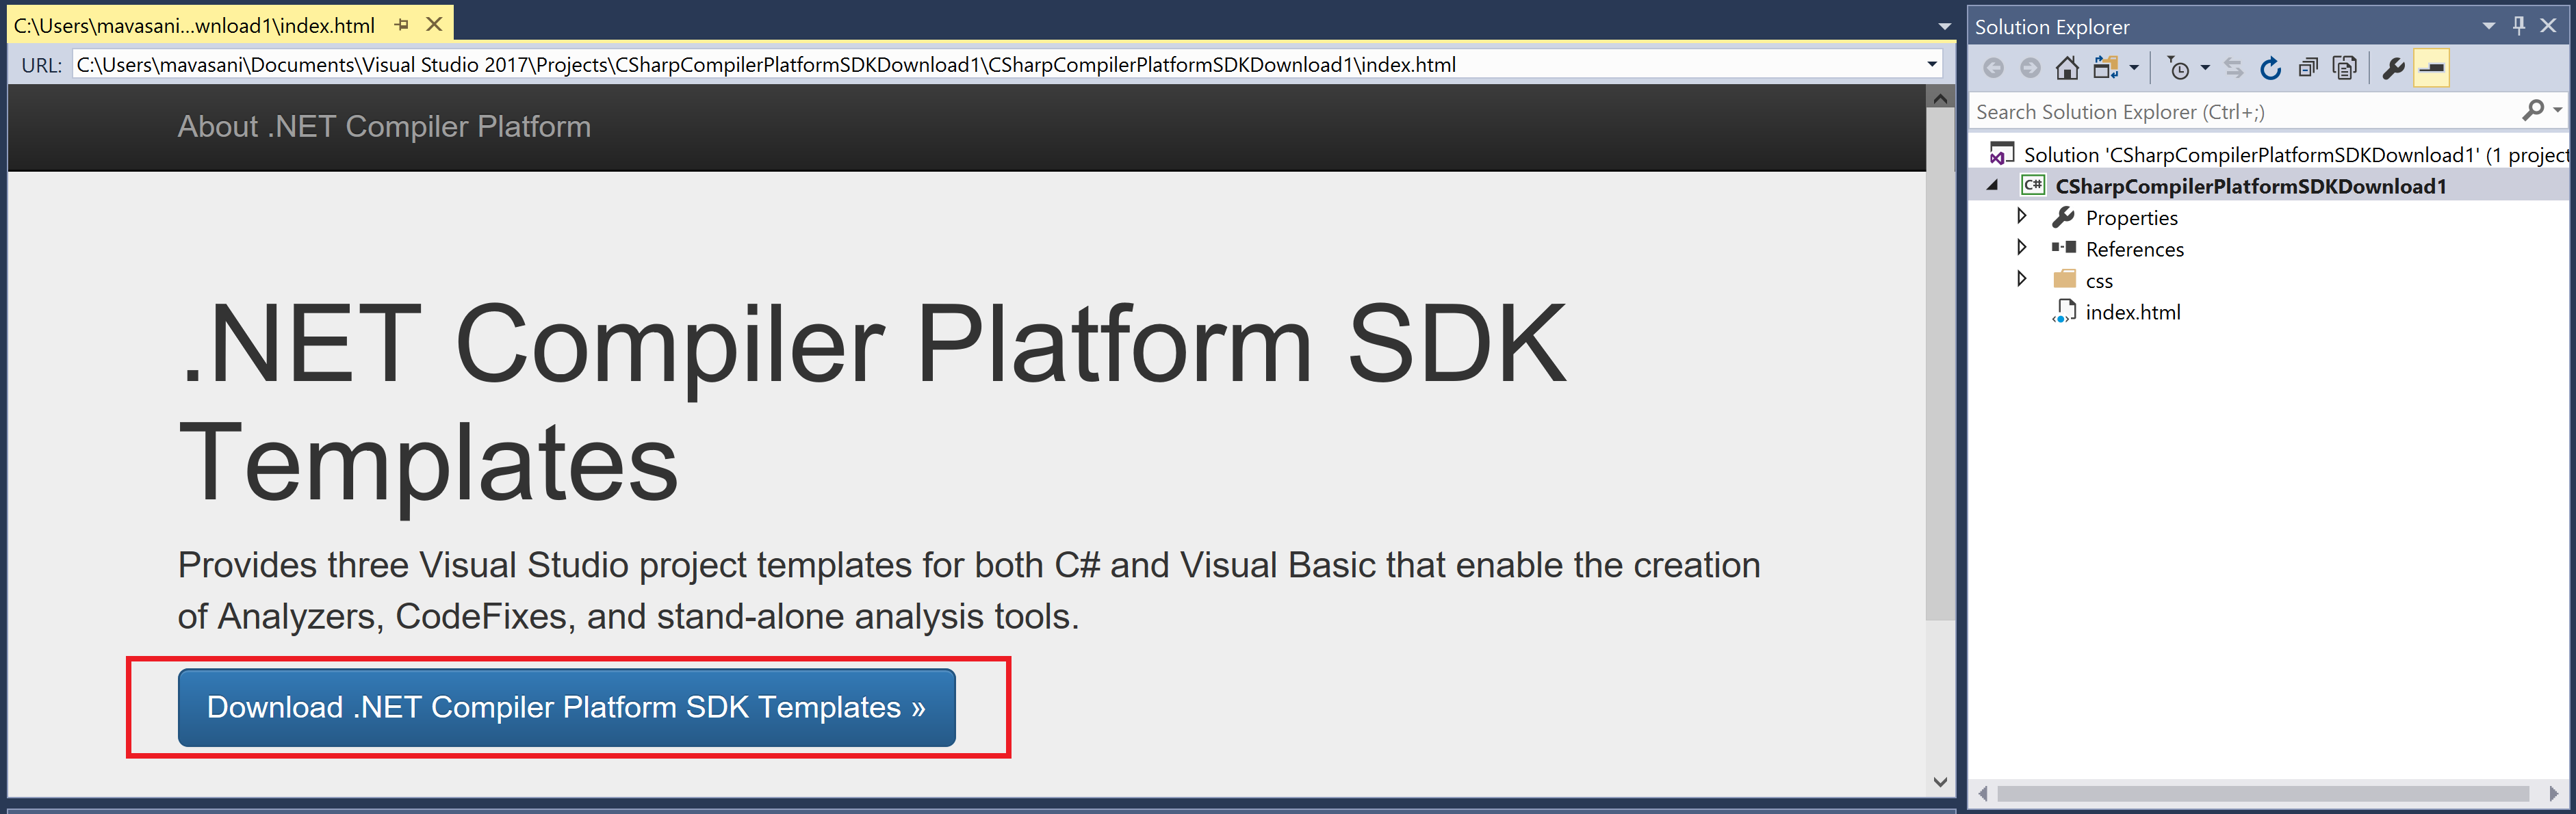
- The new project will have an
index.htmlfile opened by default. Click onDownload .NET Compiler Platform SDK Templates >>button to install the analyzer SDK templates.
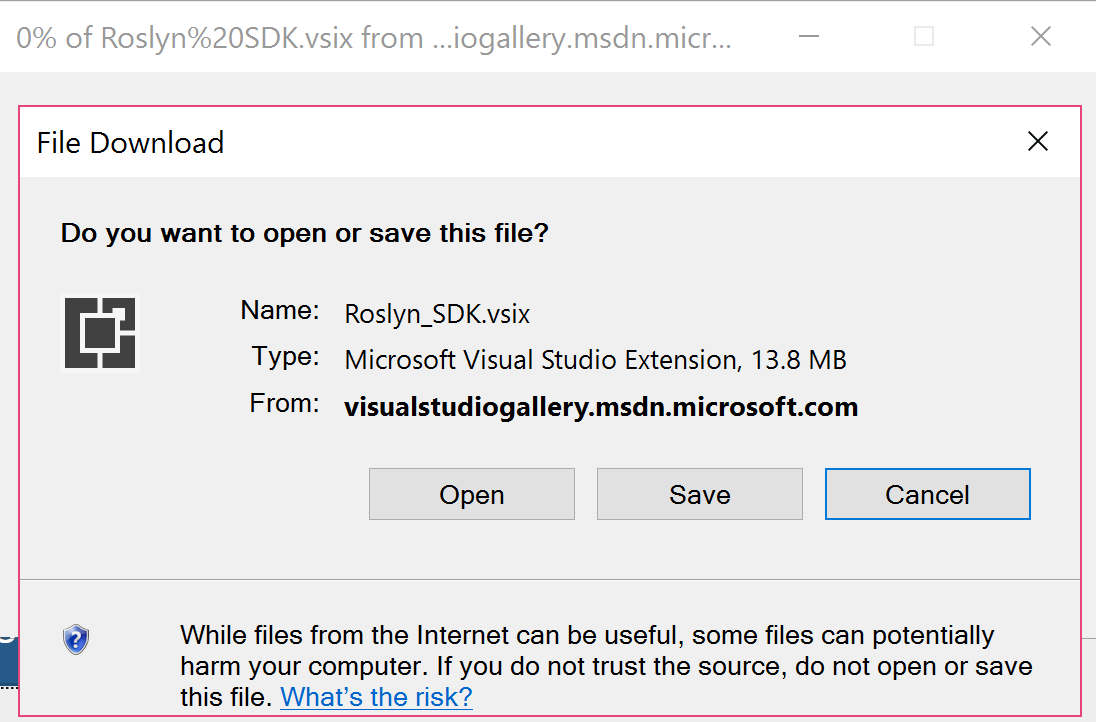
- In the subsequent
File Downloaddialog, click onOpen.
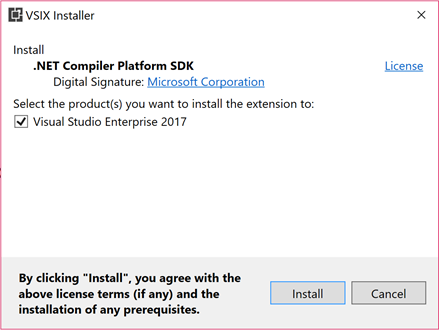
- Click
Installon the nextVSIX Installerdialog andEnd Taskson the subsequent prompt to install the SDK:
- Start a new instance of Visual Studio and click on
File|New|Project...to get theNew Projectdialog. - Change the project target framework combo box to
.NET Framework 4.6(or above). UnderVisual C#|Extensibility, chooseAnalyzer with Code Fix (NuGet + VSIX), name your projectCSharpAnalyzers, and click onOK.

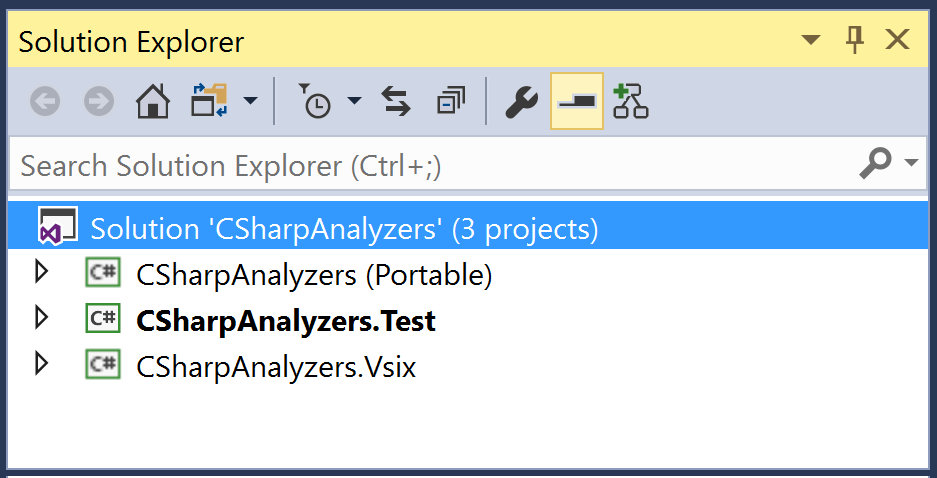
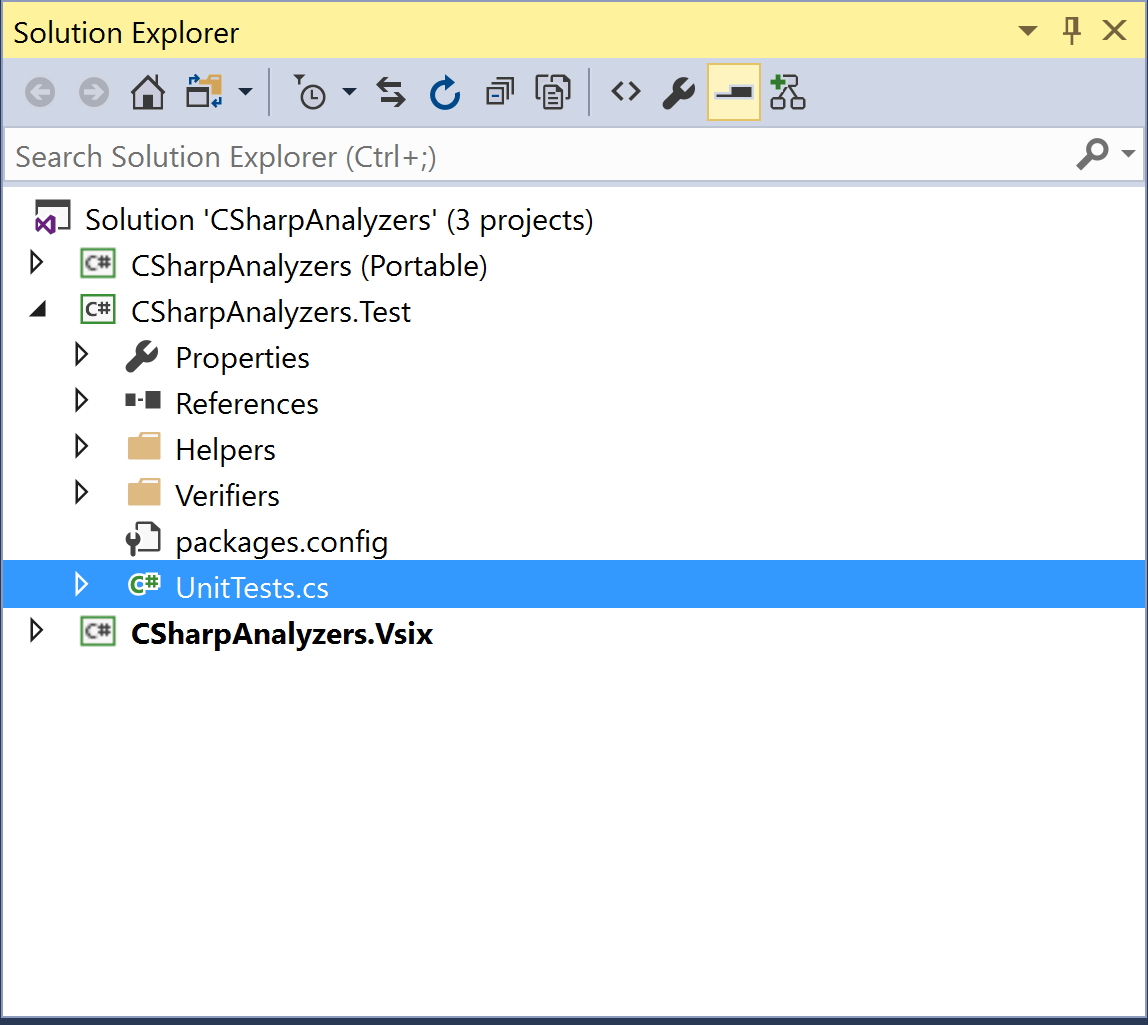
- You should now have an analyzers solution with 3 projects:
CSharpAnalyzers (Portable),CSharpAnalyzers.Test, andCSharpAnalyzer.Vsix:
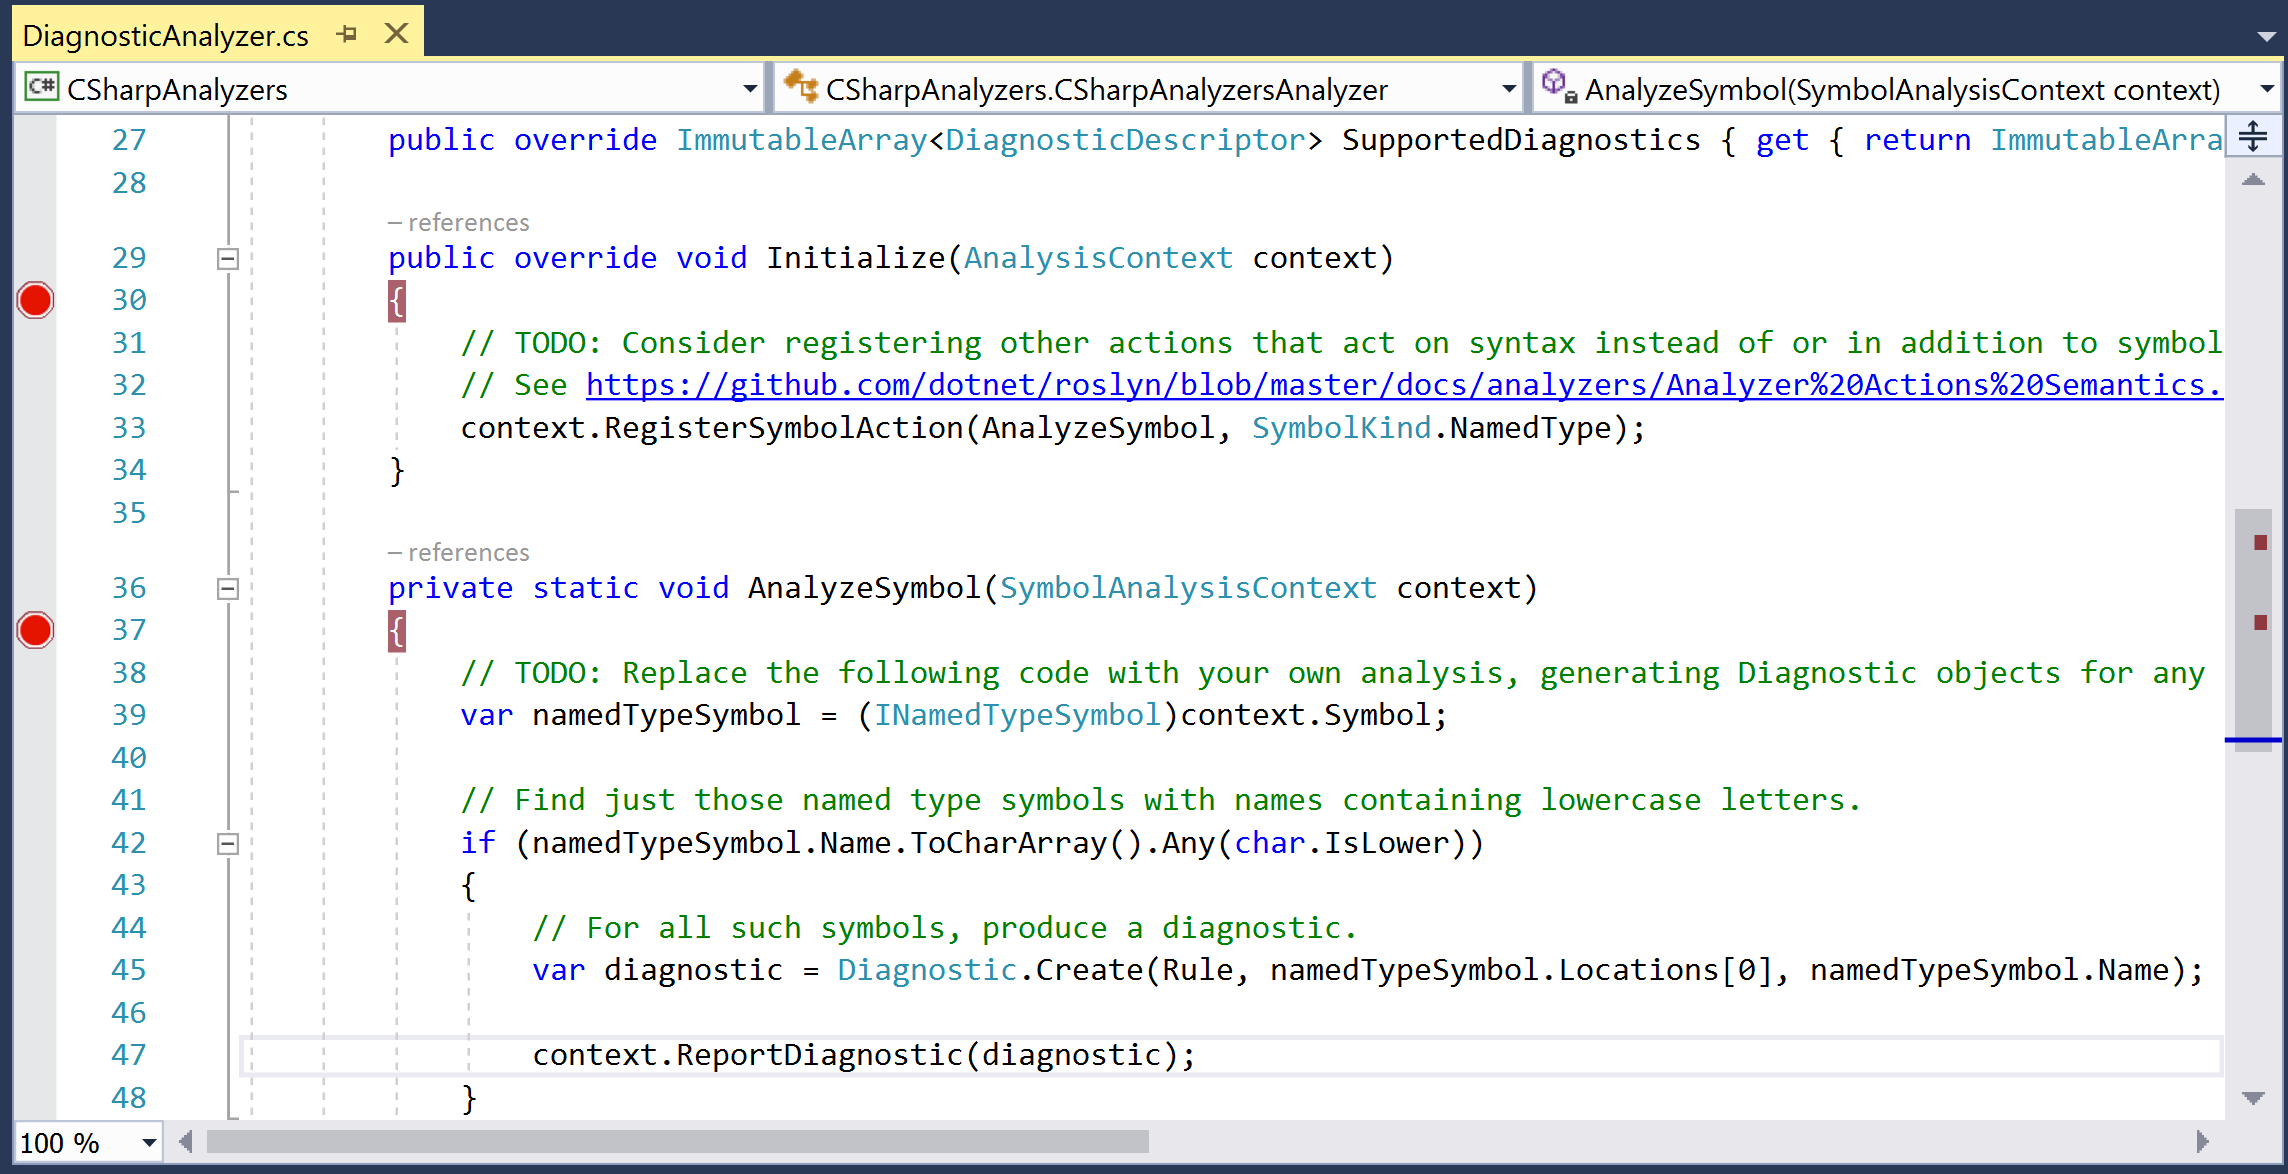
- Open source file
DiagnosticAnalyzer.csinCSharpAnalyzersproject and set breakpoints (press F9) at the start of theInitializeandAnalyzeSymbolmethods, as shown here:
- Set
CSharpAnalyzers.Vsixas the start-up project and click on F5 to build the analyzer and start debugging a new instance of Visual Studio with the analyzer enabled. - In the new Visual Studio instance, create a new C# class library project, say
ClassLibrary. - Verify that we hit both the preceding breakpoints in our analyzer code in the first VS instance. You can step through the analyzer code using F10 or click on F5 to continue debugging.
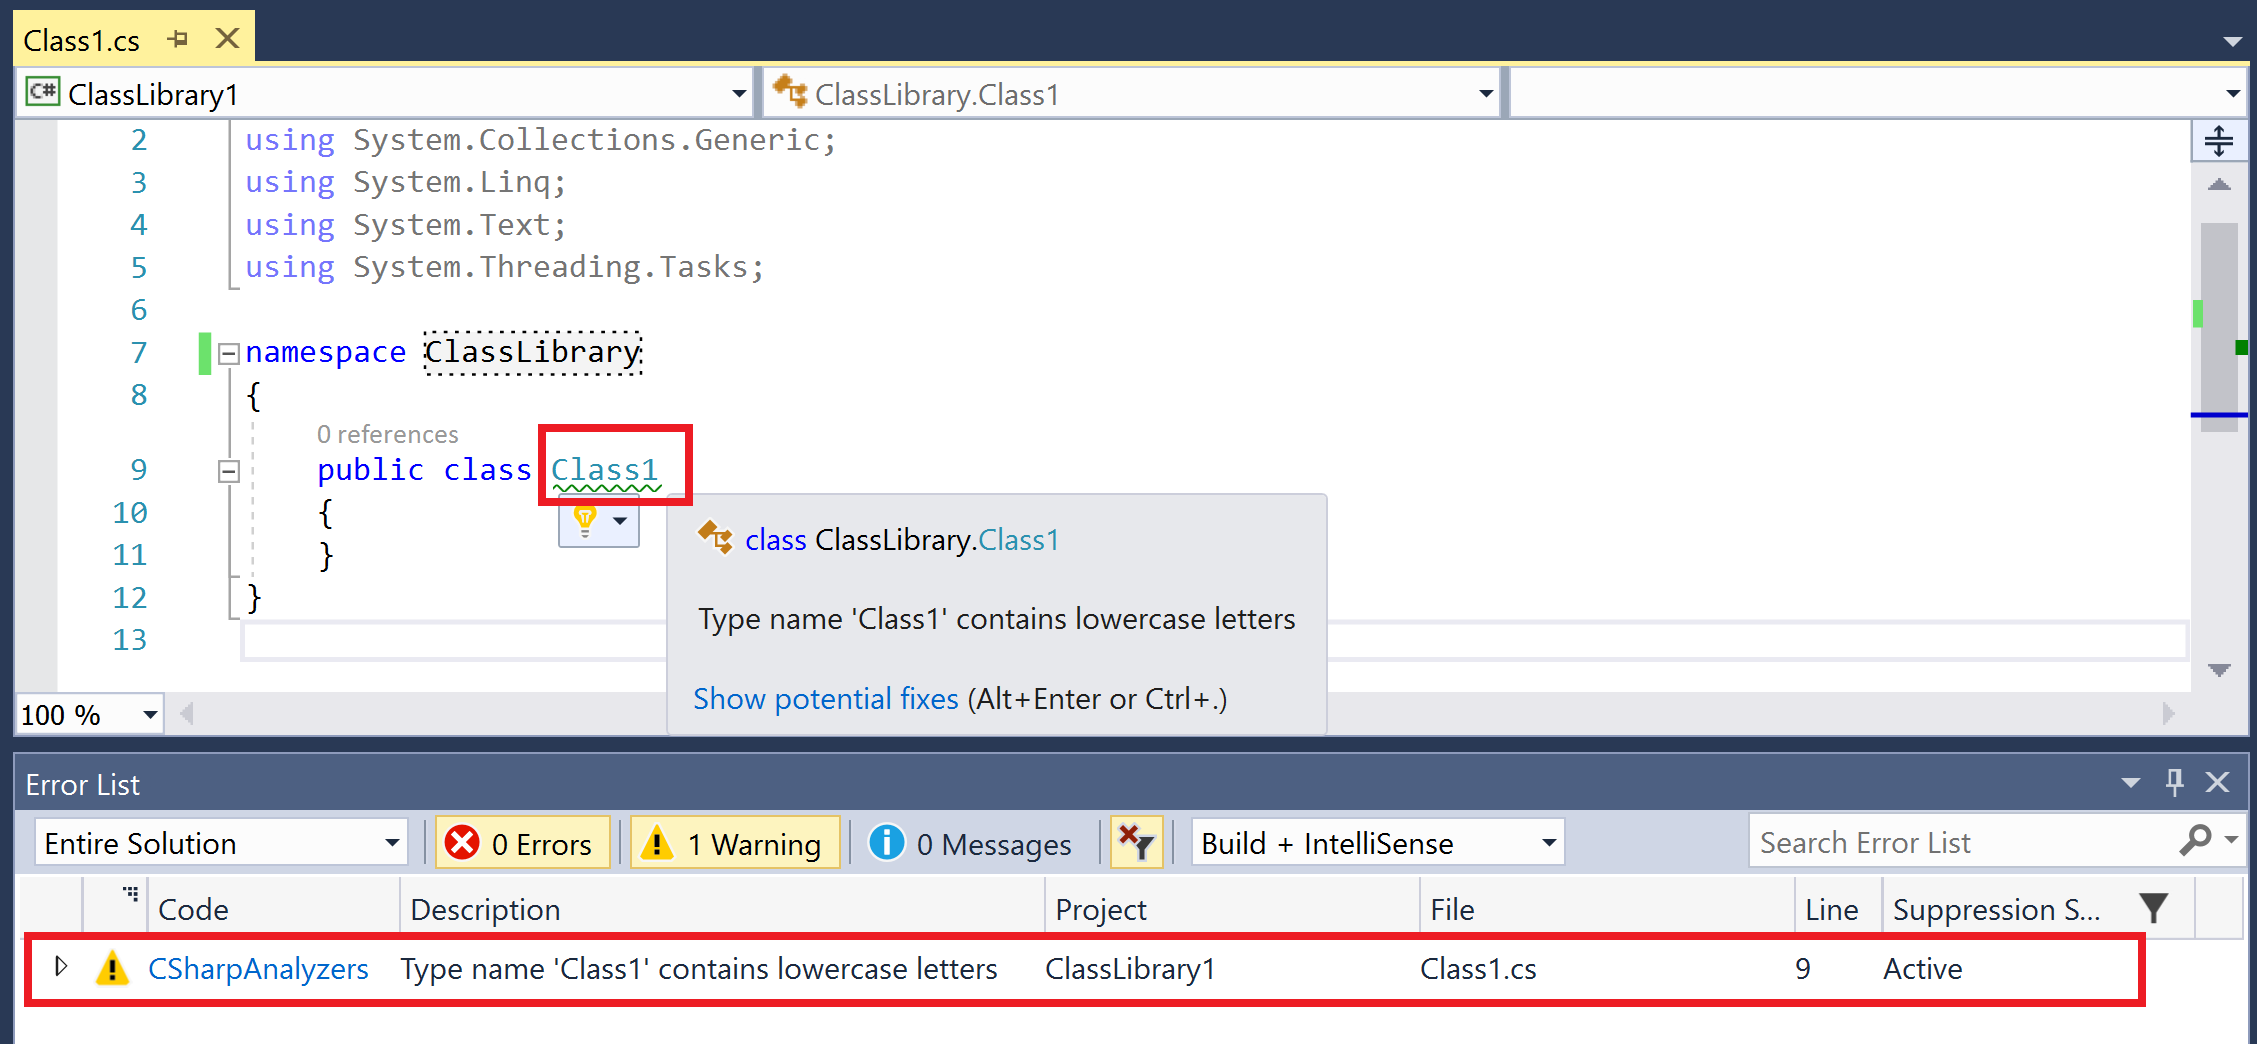
- We should now see the analyzer diagnostic in the error list and a squiggle in the editor:
- Edit the name of the class from
Class1toCLASS1. - We should hit the breakpoint in the
AnalyzeSymbolmethod again. Continue debugging with F5 and the diagnostic and squiggle should go away immediately, demonstrating the powerful live and extensible analysis.
.NET Compiler Platform SDK is a wrapper project that redirects us to fetch the project templates for analyzer + CodeFix projects for C# and Visual Basic. Creating a new project from these templates creates a fully functional analyzer project which has a default analyzer, unit tests, and a VSIX project:
CSharpAnalyzers: Core analyzer project that contains the default analyzer implementation that reports a diagnostic for all type names that contain any lowercase letters.CSharpAnalyzers.Test: Analyzer unit test project that contains a couple of analyzer and code fixer unit tests and test helpers.CSharpAnalyzers.Vsix: The VSIX project that packages the analyzer into a VSIX. This is the start-up project in the solution.
Clicking on F5 to start debugging the solution builds and deploys the analyzer to the Visual Studio extension hive and then starts a new Visual Studio instance from this hive. Our analyzer is enabled by default for all C# projects created in this VS instance.
Let's expand a bit more on the diagnostic analyzer source code defined in DiagnosticAnalyzers.cs. It contains a type named CSharpAnalyzersAnalyzer, which derives from DiagnosticAnalyzer. DiagnosticAnalyzer is an abstract type with the following two abstract members:
SupportedDiagnosticsproperty: Analyzer must define one or more supported diagnostic descriptors. Descriptors describe the metadata for the diagnostics that an analyzer can report in analyzer actions. It contains fields such as the diagnostic ID, message format, title, description, hyperlink to documentation for the diagnostic, and so on. Can be used to create and report diagnostics:
private static DiagnosticDescriptor Rule = new DiagnosticDescriptor(DiagnosticId, Title, MessageFormat, Category, DiagnosticSeverity.Warning, isEnabledByDefault: true, description: Description);

public override ImmutableArray<DiagnosticDescriptor> SupportedDiagnostics { get { return ImmutableArray.Create(Rule); } }Initializemethod: Diagnostic analyzers must implement theInitializemethod to register analyzer action callbacks for a specific code entity kind of interest, which is named type symbols for the default analyzer. The initialize method is invoked once for the analyzer lifetime to allow analyzer initialization and registration of actions.
 public override void Initialize(AnalysisContext context)
 {
  context.RegisterSymbolAction(AnalyzeSymbol, SymbolKind.NamedType);
 }

 private static void AnalyzeSymbol(SymbolAnalysisContext context)
 {
   ...
 }
Note
Invoke AnalysisContext.EnableConcurrentExecution() in the Initialize method if your analyzer can handle action callbacks from multiple threads simultaneously -- this enables the analyzer driver to execute the analyzer more efficiently on a machine with multiple cores. Additionally, also invoke AnalysisContext.ConfigureGeneratedCodeAnalysis() in theInitialize method to configure whether or not the analyzer wants to analyze and/or report diagnostics in generated code.
Analyzer actions are invoked for every code entity of interest in a user s source code. Additionally, as the user edits code and a new compilation is created, action callbacks are continuously invoked for entities defined in the new compilation during code editing. The error list makes sure that it only reports the diagnostics from the active compilation.
Note
Use http://source.roslyn.io for rich semantic search and navigation of Roslyn source code, which is open sourced at https://github.com/dotnet/roslyn.git. For example, you can look at the definition and references for DiagnosticAnalyzer using the query URL http://source.roslyn.io/#q=DiagnosticAnalyzer.
A symbol analyzer registers action callbacks to analyze one or more kinds of symbol declarations, such as types, methods, fields, properties, events, and so on, reports semantic issues about declarations.
In this section, we will create a symbol analyzer that extends the compiler diagnostic CS0542 (member names cannot be the same as their enclosing type) to report a diagnostic if member names are the same as any of the outer parent type. For example, the analyzer will report a diagnostic for the innermost type NestedClass here:
public class NestedClass
{
  public class InnerClass
  {
    public class NestedClass
    {
    }
  }
}You will need to have created and opened an analyzer project, say CSharpAnalyzers in Visual Studio 2017. Refer to the first recipe in this chapter to create this project.
- In
Solution Explorer, double-click onResources.resxfile inCSharpAnalyzersproject to open the resource file in the resource editor. - Replace the existing resource strings for
AnalyzerDescription,AnalyzerMessageFormatandAnalyzerTitlewith new strings:

- Replace the
Initializemethod implementation with the following:
public override void Initialize(AnalysisContext context)
{
  context.RegisterSymbolAction(symbolContext =>
  {
    var symbolName = symbolContext.Symbol.Name;

    // Skip the immediate containing type, CS0542 already covers this case.
    var outerType = symbolContext.Symbol.ContainingType?.ContainingType;
    while (outerType != null)
    {
      // Check if the current outer type has the same name as the given member.
      if (symbolName.Equals(outerType.Name))
      {
        // For all such symbols, report a diagnostic.
        var diagnostic = Diagnostic.Create(Rule, symbolContext.Symbol.Locations[0], symbolContext.Symbol.Name);
        symbolContext.ReportDiagnostic(diagnostic);
        return;
      }

      outerType = outerType.ContainingType;
    }
  },
  SymbolKind.NamedType,
  SymbolKind.Method,
  SymbolKind.Field,
  SymbolKind.Event,
  SymbolKind.Property);
}- Click on Ctrl + F5 to start a new Visual Studio instance with the analyzer enabled.
- In the new Visual Studio instance, create a new C# class library with the following code:
namespace ClassLibrary
{
 public class OuterClass
 {
  public class NestedClass
  {
   public class NestedClass
   {
   }
  }
 }
}- Verify the compiler reported diagnostic CS0542 in the error list:
'NestedClass': member names cannot be the same as their enclosing type. - Change the class library code to following:
namespace ClassLibrary
{
 public class OuterClass
 {
  public class NestedClass
  {
   public class InnerClass
   {
    public class NestedClass
    {
    }
   }
  }
 }
}- Verify that CS0542 isn t reported anymore, but the error list has our analyzer diagnostic:

- Replace the innermost type declaration for
NestedClasswith a field:public int NestedClass, and verify the same analyzer diagnostic is reported. You should get the same diagnostic for other member kinds such as method, property, and events with the same name.
Symbol analyzers register one or more symbol action callbacks to analyze symbol kinds of interest. Note that, unlike the default implementation that registered a delegate method named AnalyzeSymbol, we registered a lambda callback.
We specified interest in analyzing all the top-level symbol kinds that can have an enclosing type, namely types, methods, fields, properties, and events in the RegisterSymbolAction invocation:
context.RegisterSymbolAction(symbolContext =>
{
 ...
},
SymbolKind.NamedType,
SymbolKind.Method,
SymbolKind.Field,
SymbolKind.Event,
SymbolKind.Property);
The analyzer driver ensures that the registered lambda is invoked for all symbols of the registered interest kinds in the compilation.
Analysis skips the immediate enclosing type, as C# compiler already reports error CS0542, if a member has the same name as its enclosing type.
// Skip the immediate containing type, CS0542 already covers this case.
var outerType = symbolContext.Symbol.ContainingType?.ContainingType;
Core analysis works by looping over the outer types and comparing the name of the symbol in a symbol analysis context with the relevant outer types, until it finds a match, in which case, it reports a diagnostic; if the outer type has no containing type, it doesn t report a diagnostic.
while (outerType != null)
{
 // Check if the current outer type has the same name as the given member.
 if (symbolName.Equals(outerType.Name))
 {
  // For all such symbols, report a diagnostic.
  ...
 }

 outerType = outerType.ContainingType;
}Trivia: The preceding implementation of the symbol analyzer does not have optimal performance. For example, if you have n levels of type nesting, and m fields in the inner innermost nested type, the analysis we implemented will be O(m*n) algorithmic complexity. Can you implement an alternate implementation where the analysis can be implemented with a much superior O(m + n) complexity?
Our current analyzer implementation is completely stateless because it doesn t require analysis that is dependent upon more than one symbol at a time. We analyze each symbol individually and report diagnostics for it. However, if you need to do more complex analysis that requires collecting state from multiple symbols and then doing a compilation-wide analysis, you should write a stateful compilation analyzer with symbol and compilation actions. This is covered later in this chapter in the recipe Creating a compilation analyzer to analyze a whole compilation and report issues.
A syntax node analyzer registers action callbacks to analyze one or more kinds of syntax nodes, such as operators, identifiers, expressions, declarations, and so on, and reports semantic issues about syntax. These analyzers generally need to fetch semantic information about different syntax nodes being analyzed and use the compiler semantic model APIs to get this information.
In this section, we will create a syntax analyzer that analyzes VariableDeclarationSyntax nodes for local declarations and reports a diagnostic recommending use of the explicit type instead of an implicitly typed declaration, that is, variables defined with the keyword var, such as var i = new X();. Analyzer will not report diagnostics if there is a compiler syntax error (implicitly typed declarations cannot define more than one variable), or the right side of the assignment has an error type or special System type such as int, char, string, and so on. For example, the analyzer will not flag locals local1, local2, and local3 here, but will flag local4.
int local1 = 0;
Class1 local2 = new Class1();
var local3 = 0;
var local4 = new Class1();
You will need to have created and opened an analyzer project, say CSharpAnalyzers in Visual Studio 2017. Refer to the first recipe in this chapter to create this project.
- In
Solution Explorer, double-click onResources.resxfile inCSharpAnalyzersproject to open the resource file in the resource editor. - Replace the existing resource strings for
AnalyzerDescription,AnalyzerMessageFormatandAnalyzerTitlewith new strings:

- Replace the
Initializemethod implementation with the following:
public override void Initialize(AnalysisContext context)
{
  context.RegisterSyntaxNodeAction(syntaxNodeContext =>
  {
    // Find implicitly typed variable declarations.
    // Do not flag implicitly typed declarations that declare more than one variables,
    // as the compiler already generates error CS0819 for those cases.
    var declaration = (VariableDeclarationSyntax)syntaxNodeContext.Node;
    if (!declaration.Type.IsVar || declaration.Variables.Count != 1)
    {
      return;
    }

    // Do not flag variable declarations with error type or special System types, such as int, char, string, and so on.
    var typeInfo = syntaxNodeContext.SemanticModel.GetTypeInfo(declaration.Type, syntaxNodeContext.CancellationToken);
    if (typeInfo.Type.TypeKind == TypeKind.Error || typeInfo.Type.SpecialType != SpecialType.None)
    {
      return;
    }

    // Report a diagnostic.
    var variable = declaration.Variables[0];
    var diagnostic = Diagnostic.Create(Rule, variable.GetLocation(), variable.Identifier.ValueText);
    syntaxNodeContext.ReportDiagnostic(diagnostic);
  },
  SyntaxKind.VariableDeclaration);
}- Click on Ctrl + F5 to start a new Visual Studio instance with the analyzer enabled.
- In the new Visual Studio instance, create a new C# class library with the following code:
namespace ClassLibrary
{
  public class Class1
  {
    public void M(int param1, Class1 param2)
    {
      // Explicitly typed variables - do not flag.
      int local1 = param1;
      Class1 local2 = param2;
    }
  }
}- Verify the analyzer diagnostic is not reported in the error list for explicitly typed variables.
- Now, add the following implicitly typed variable declarations to the method:
 // Implicitly typed variable with error type - do not flag.
 var local3 = UndefinedMethod();

 // Implicitly typed variable with special type - do not flag.
 var local4 = param1;
- Verify the analyzer diagnostic is not reported in the error list for implicitly typed variables with error type or special type.
- Add the violating implicitly typed variable declaration to the method:
 // Implicitly typed variable with user defined type - flag.
 var local5 = param2;
- Verify the analyzer diagnostic is reported for this implicitly typed variable:

Syntax node analyzers register one or more syntax node action callbacks to analyse syntax kinds of interest. We specified interest in analyzing VariableDeclaration syntax kind in the RegisterSyntaxNodeAction invocation.
context.RegisterSyntaxNodeAction(syntaxNodeContext =>
{
...
}, SyntaxKind.VariableDeclaration);
Analysis works by operating on the syntax node and semantic model exposed off the syntax node analysis context in the callback. We first do syntactic checks to verify that we are operating on a valid implicitly typed declaration:
// Do not flag implicitly typed declarations that declare more than one variables,
// as the compiler already generates error CS0819 for those cases.
var declaration = (VariableDeclarationSyntax)syntaxNodeContext.Node;
if (!declaration.Type.IsVar || declaration.Variables.Count != 1)
{
 return;
}
We then perform semantic checks using the semantic model APIs to get semantic type information about the type declaration syntax node and verify it is not an error type or primitive system type:
// Do not flag variable declarations with error type or special System types, such as int, char, string, and so on.
var typeInfo = syntaxNodeContext.SemanticModel.GetTypeInfo(declaration.Type, syntaxNodeContext.CancellationToken);
if (typeInfo.Type.TypeKind == TypeKind.Error || typeInfo.Type.SpecialType != SpecialType.None)
{
 return;
}
Note
You can perform many powerful semantic operations on the syntax node exposed from the SyntaxNodeAnalysisContext using the public semantic model APIs, for reference see https://github.com/dotnet/roslyn/blob/master/src/Compilers/Core/Portable/Compilation/SemanticModel.cs.
If both the syntactic and semantics check succeed, then we report a diagnostic about recommending explicit type instead of var.
A syntax tree analyzer registers action callbacks to analyze the syntax/grammar for the source file and reports pure syntactic issues. For example, a missing semicolon at the end of a statement is a syntactic error, while assigning an incompatible type to a symbol with no possible type conversion is a semantic error.
In this section, we will write a syntax tree analyzer that analyzes all the statements in a source file and generates a syntax warning for any statement that is not enclosed in a block, that is curly braces { and }. For example, the following code will generate a warning for both the if statement and the System.Console.WriteLine invocation statement, but the while statement is not flagged:
void Method()
{
 while (...)
  if (...)
   System.Console.WriteLine(value);
}You will need to have created and opened an analyzer project, say CSharpAnalyzers in Visual Studio 2017. Refer to the first recipe in this chapter to create this project.
- In
Solution Explorer, double-click on theResources.resxfile inCSharpAnalyzersproject to open the resource file in the resource editor. - Replace the existing resource strings for
AnalyzerDescription,AnalyzerMessageFormatandAnalyzerTitlewith new strings.

- Replace the
Initializemethod implementation with the following:
public override void Initialize(AnalysisContext context)
{
   context.RegisterSyntaxTreeAction(syntaxTreeContext =>
   {
     // Iterate through all statements in the tree.
     var root = syntaxTreeContext.Tree.GetRoot(syntaxTreeContext.CancellationToken);
     foreach (var statement in root.DescendantNodes().OfType<StatementSyntax>())
     {
       // Skip analyzing block statements.
       if (statement is BlockSyntax)
       {
         continue;
       }

       // Report issue for all statements that are nested within a statement,
       // but not a block statement.
       if (statement.Parent is StatementSyntax && !(statement.Parent is BlockSyntax))
       {
         var diagnostic = Diagnostic.Create(Rule, statement.GetFirstToken().GetLocation());
         syntaxTreeContext.ReportDiagnostic(diagnostic);
       }
     }
   });
}- Click on Ctrl + F5 to start a new Visual Studio instance with the analyzer enabled.
- In the new Visual Studio instance, create a new C# class library with the following code:
namespace ClassLibrary
{
  public class Class1
  {
    void Method(bool flag, int value)
    {
      while (flag)
      if (value > 0)
      System.Console.WriteLine(value);
    }
  }
}- Verify the analyzer diagnostic is neither reported for the method block for
Methodnor thewhilestatement, but is reported for theifstatement andSystem.Console.WriteLineinvocation statement:

- Now, add curly braces around the
System.Console.WriteLineinvocation statement and verify the only single warning is now reported for theifstatement:

Syntax tree analyzers register callbacks to analyze syntax of all source files in the compilation. Our analysis works by getting the roots of the syntax tree and then operating on all the descendant syntax nodes of the roots which are of type StatementSyntax. First, we note that a block statement is itself an aggregate statement, and by definition has curly braces, so we skip past these.
// Skip analyzing block statements.
if (statement is BlockSyntax)
{
  continue;
}
We then perform syntactic checks for the parent of statement syntax. If the parent of the statement is also a statement, but not a block with curly braces, then we report a diagnostic on the first syntax token of the statement recommending usage of curly braces.
// Report issue for all statements that are nested within a statement,
// but not a block statement.
if (statement.Parent is StatementSyntax && !(statement.Parent is BlockSyntax))
{
  var diagnostic = Diagnostic.Create(Rule, statement.GetFirstToken().GetLocation());
  syntaxTreeContext.ReportDiagnostic(diagnostic);
}A stateful method body or code block analyzer registers action callbacks that require whole method body analysis to report issues about the method declaration or executable code. These analyzers generally need to initialize some mutable state at the start of the analysis, which is updated while analyzing the method body, and the final state is used to report diagnostics.
In this section, we will create a code block analyzer that flags unused method parameters. For example, it will not flag param1 and param2 as unused, but will flag param3 and param4.
void M(int param1, ref int param2, int param3, params int[] param4)
{
 int local1 = param1;
 param2 = 0;
}You will need to have created and opened an analyzer project, say CSharpAnalyzers in Visual Studio 2017. Refer to the first recipe in this chapter to create this project.
- In
Solution Explorer, double-click onResources.resxfile inCSharpAnalyzersproject to open the resource file in the resource editor. - Replace the existing resource strings for
AnalyzerDescription,AnalyzerMessageFormatandAnalyzerTitlewith new strings.

- Replace the
Initializemethod implementation with the code fromCSharpAnalyzers/CSharpAnalyzers/CSharpAnalyzers/DiagnosticAnalyzer.cs/method namedInitialize. - Add private class
UnusedParametersAnalyzerfromCSharpAnalyzers/CSharpAnalyzers/CSharpAnalyzers/DiagnosticAnalyzer.cs/type namedUnusedParametersAnalyzerin your analyzer to perform the core method body analysis for a given method. - Click on Ctrl + F5 to start a new Visual Studio instance with the analyzer enabled.
- In the new Visual Studio instance, create a new C# class library with the following code:
namespace ClassLibrary
{
  public class Class1
  {
    void M(int param1, ref int param2, int param3, params int[] param4)
    {
      int local1 = param1;
      param2 = 0;
    }
  }
}- Verify the analyzer diagnostic is not reported for
param1andparam2, but is reported forparam3andparam4:

- Now, add code to use
param3in the local declaration statement, deleteparam4, and verify the diagnostics go away:

Code block analyzers register code block actions to analyze executable code blocks in the compilation. You can register either a stateless CodeBlockAction or a stateful CodeBlockStartAction with nested actions to analyze syntax nodes within a code block. Our analyzer registers a CodeBlockStartAction to perform stateful analysis.
 context.RegisterCodeBlockStartAction<SyntaxKind>(startCodeBlockContext =>
 {
  ...
 }
Analysis begins with a couple of early bail out checks: we are only interested in analyzing executable code within a method body and methods that have at least one parameter.
  // We only care about method bodies.
  if (startCodeBlockContext.OwningSymbol.Kind != SymbolKind.Method)
  {
    return;
  }

  // We only care about methods with parameters.
  var method = (IMethodSymbol)startCodeBlockContext.OwningSymbol;
  if (method.Parameters.IsEmpty)
  {
    return;
  }
We allocate a new UnusedParametersAnalyzer instance for every method to be analyzed. A constructor of this type initializes the mutable state tracked for analysis (explained later):
  // Initialize local mutable state in the start action.
  var analyzer = new UnusedParametersAnalyzer(method);
We then register a nested syntax node action, UnusedParametersAnalyzer.AnalyzeSyntaxNode, on the given code block context for the given method. We register interest in analyzing IdentifierName syntax nodes within the code block:
// Register an intermediate non-end action that accesses and modifies the state. startCodeBlockContext.RegisterSyntaxNodeAction(analyzer.AnalyzeSyntaxNode, SyntaxKind.IdentifierName);
Finally, we register a nested CodeBlockEndAction to be executed on the instance of UnusedParametersAnalyzer at the end of the code block analysis.
// Register an end action to report diagnostics based on the final state. startCodeBlockContext.RegisterCodeBlockEndAction(analyzer.CodeBlockEndAction);
Note
Nested end actions are always guaranteed to be executed after all the nested non-end actions registered on the same analysis context have finished executing.
Let's now understand the working of the core UnusedParametersAnalyzer type to analyze a specific code block. This analyzer defines mutable state fields to track parameters (and their names) that are considered to be unused:
  #region Per-CodeBlock mutable state
  private readonly HashSet<IParameterSymbol> _unusedParameters;
  private readonly HashSet<string> _unusedParameterNames;
  #endregion
We initialize this mutable state in the constructor of the analyzer. At the start of the analysis, we filter out implicitly declared parameters and parameters with no source locations - these are never considered to be redundant. We mark the remaining parameters as unused.
  #region State intialization
  public UnusedParametersAnalyzer(IMethodSymbol method)
  {
    // Initialization: Assume all parameters are unused, except for:
    //  1. Implicitly declared parameters
    //  2. Parameters with no locations (example auto-generated parameters for accessors)
    var parameters = method.Parameters.Where(p => !p.IsImplicitlyDeclared && p.Locations.Length > 0);
    _unusedParameters = new HashSet<IParameterSymbol>(parameters);
    _unusedParameterNames = new HashSet<string>(parameters.Select(p => p.Name));
  }
  #endregion
AnalyzeSyntaxNode has been registered as a nested syntax node action to analyze all IdentifierName nodes within the code block. We perform a couple of quick checks at the start of the method and bail out of analysis if (a) We have no unused parameters in our current analysis state, or (b) The identifier name doesn't match any of the unused parameter names. The latter check is done to avoid the performance hit of attempting to compute symbol info for the identifier.
  #region Intermediate actions
  public void AnalyzeSyntaxNode(SyntaxNodeAnalysisContext context)
  {
    // Check if we have any pending unreferenced parameters.
    if (_unusedParameters.Count == 0)
    {
      return;
    }

    // Syntactic check to avoid invoking GetSymbolInfo for every identifier.
    var identifier = (IdentifierNameSyntax)context.Node;
    if (!_unusedParameterNames.Contains(identifier.Identifier.ValueText))
    {
      return;
    }
Then, we use the semantic model APIs to get semantic symbol info for the identifier name and check if it binds to one of the parameters that is currently considered unused. If so, we remove this parameter (and it's name) from the unused set.
    // Mark parameter as used.
    var parmeter = context.SemanticModel.GetSymbolInfo(identifier, context.CancellationToken).Symbol as IParameterSymbol;
    if (parmeter != null && _unusedParameters.Contains(parmeter))
    {
      _unusedParameters.Remove(parmeter);
      _unusedParameterNames.Remove(parmeter.Name);
    }
  }
  #endregion
Finally, the registered code block end action walks through all the remaining parameters in the unused set and flags them as unused parameters.
  #region End action
  public void CodeBlockEndAction(CodeBlockAnalysisContext context)
  {
    // Report diagnostics for unused parameters.
    foreach (var parameter in _unusedParameters)
    {
      var diagnostic = Diagnostic.Create(Rule, parameter.Locations[0], parameter.Name, parameter.ContainingSymbol.Name);
      context.ReportDiagnostic(diagnostic);
    }
  }
#endregionA stateful compilation analyzer registers action callbacks that require compilation-wide analysis of symbols and/or syntax to report issues about declarations or executable code in the compilation. These analyzers generally need to initialize some mutable state at the start of the analysis, which is updated while analyzing the compilation, and the final state is used to report diagnostics.
In this section, we will create an analyzer that performs compilation-wide analysis and reports. Diagnostic secure types must not implement interfaces with insecure methods for the following scenarios:
- Assume we have an interface, say
MyNamespace.ISecureType, which is a well-known secure interface, i.e. it is a marker for all secure types in an assembly. - Assume we have a method attribute, say
MyNamespace.InsecureMethodAttribute, which marks the method on which the attribute is applied as insecure. An interface which has any member with such an attribute, must be considered insecure. - We want to report diagnostics for types implementing the well-known secure interface that also implements any insecure interfaces.
Analyzer performs compilation-wide analysis to detect such violating types and reports diagnostics for them in the compilation end action.
You will need to have created and opened an analyzer project, say CSharpAnalyzers in Visual Studio 2017. Refer to the first recipe in this chapter to create this project.
- In
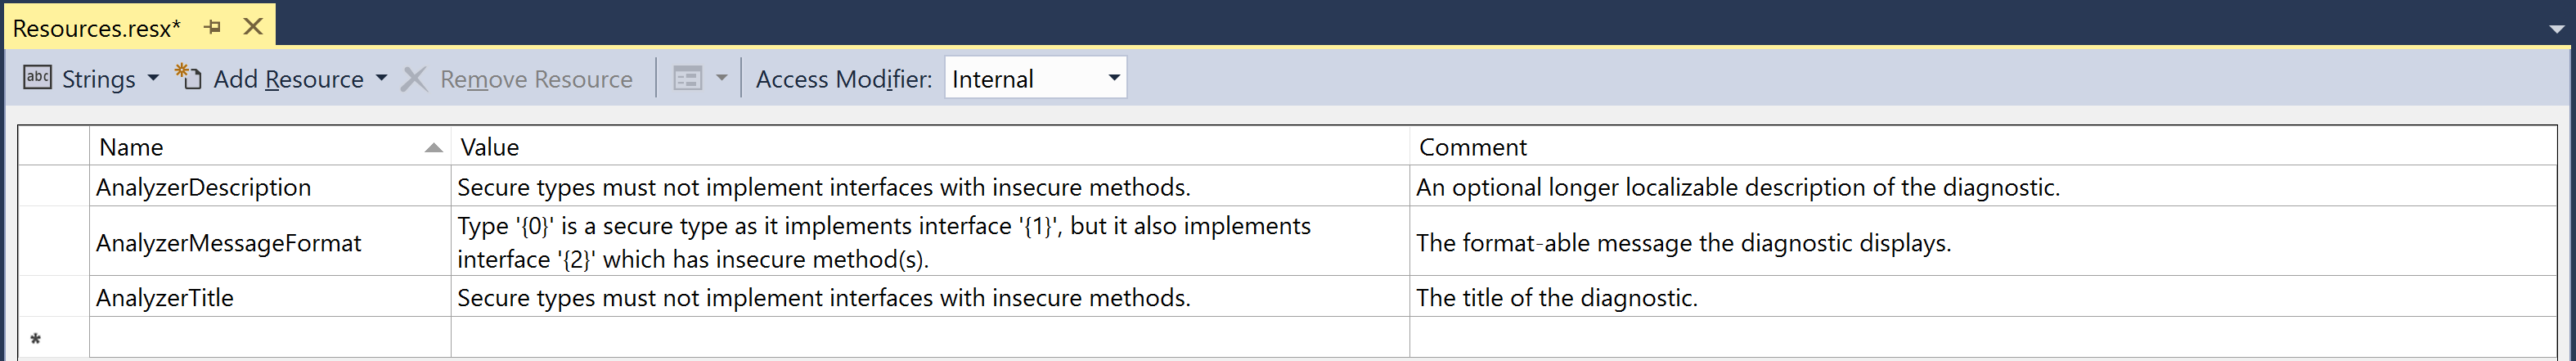
Solution Explorer, double click onResources.resxfile inCSharpAnalyzersproject to open the resource file in the resource editor. - Replace the existing resource strings for
AnalyzerDescription,AnalyzerMessageFormatandAnalyzerTitlewith new strings.
- Replace the
Initializemethod implementation with the code fromCSharpAnalyzers/CSharpAnalyzers/CSharpAnalyzers/DiagnosticAnalyzer.cs/method namedInitialize.
- Add a private class
CompilationAnalyzerfromCSharpAnalyzers/CSharpAnalyzers/CSharpAnalyzers/DiagnosticAnalyzer.cs/type namedCompilationAnalyzerin your analyzer to perform the core method body analysis for a given method. - Click on Ctrl + F5 to start a new Visual Studio instance with the analyzer enabled.
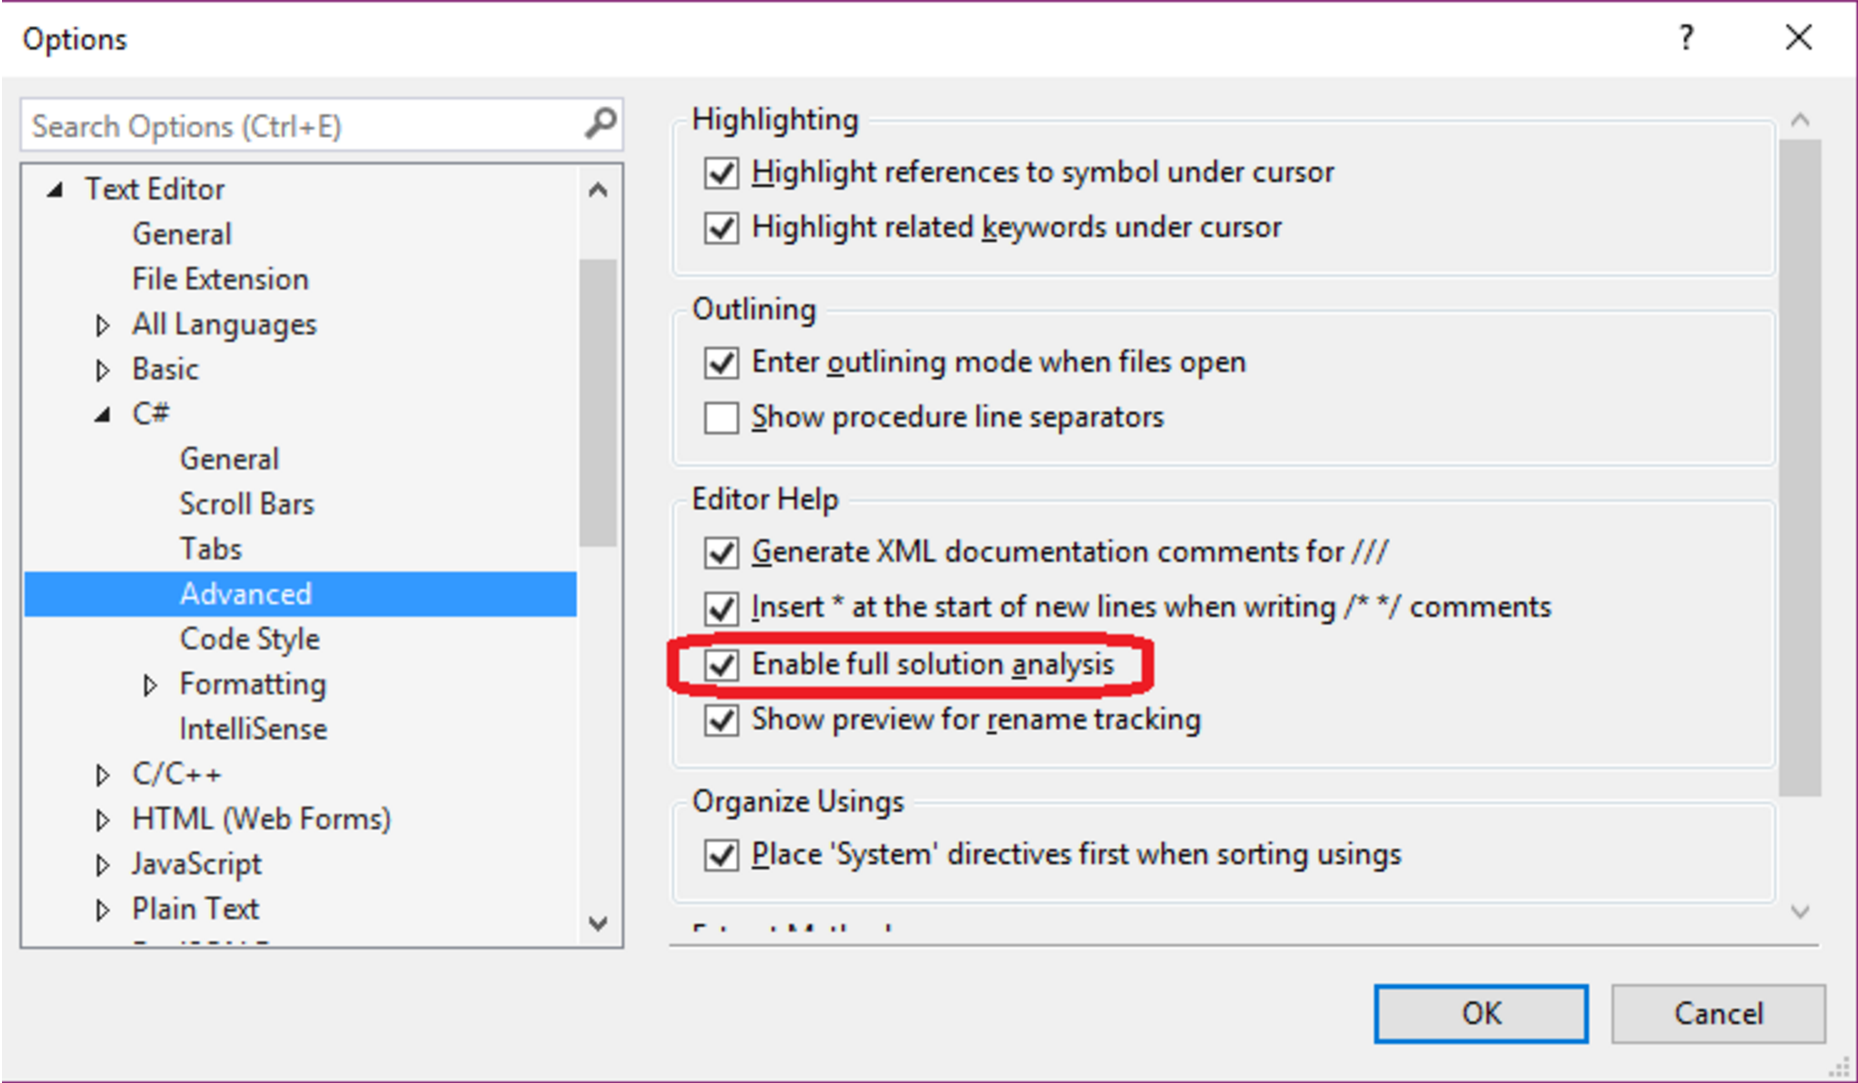
- In the new Visual Studio instance, enable full solution analysis for C# projects by following the steps here: https://msdn.microsoft.com/en-us/library/mt709421.aspx
- In the new Visual Studio instance, create a new C# class library with the following code:
namespace MyNamespace
{
  public class InsecureMethodAttribute : System.Attribute { }

  public interface ISecureType { }

  public interface IInsecureInterface
  {
    [InsecureMethodAttribute]
    void F();
  }

  class MyInterfaceImpl1 : IInsecureInterface
  {
    public void F() {}
  }

  class MyInterfaceImpl2 : IInsecureInterface, ISecureType
  {
    public void F() {}
  }

  class MyInterfaceImpl3 : ISecureType
  {
    public void F() {}
  }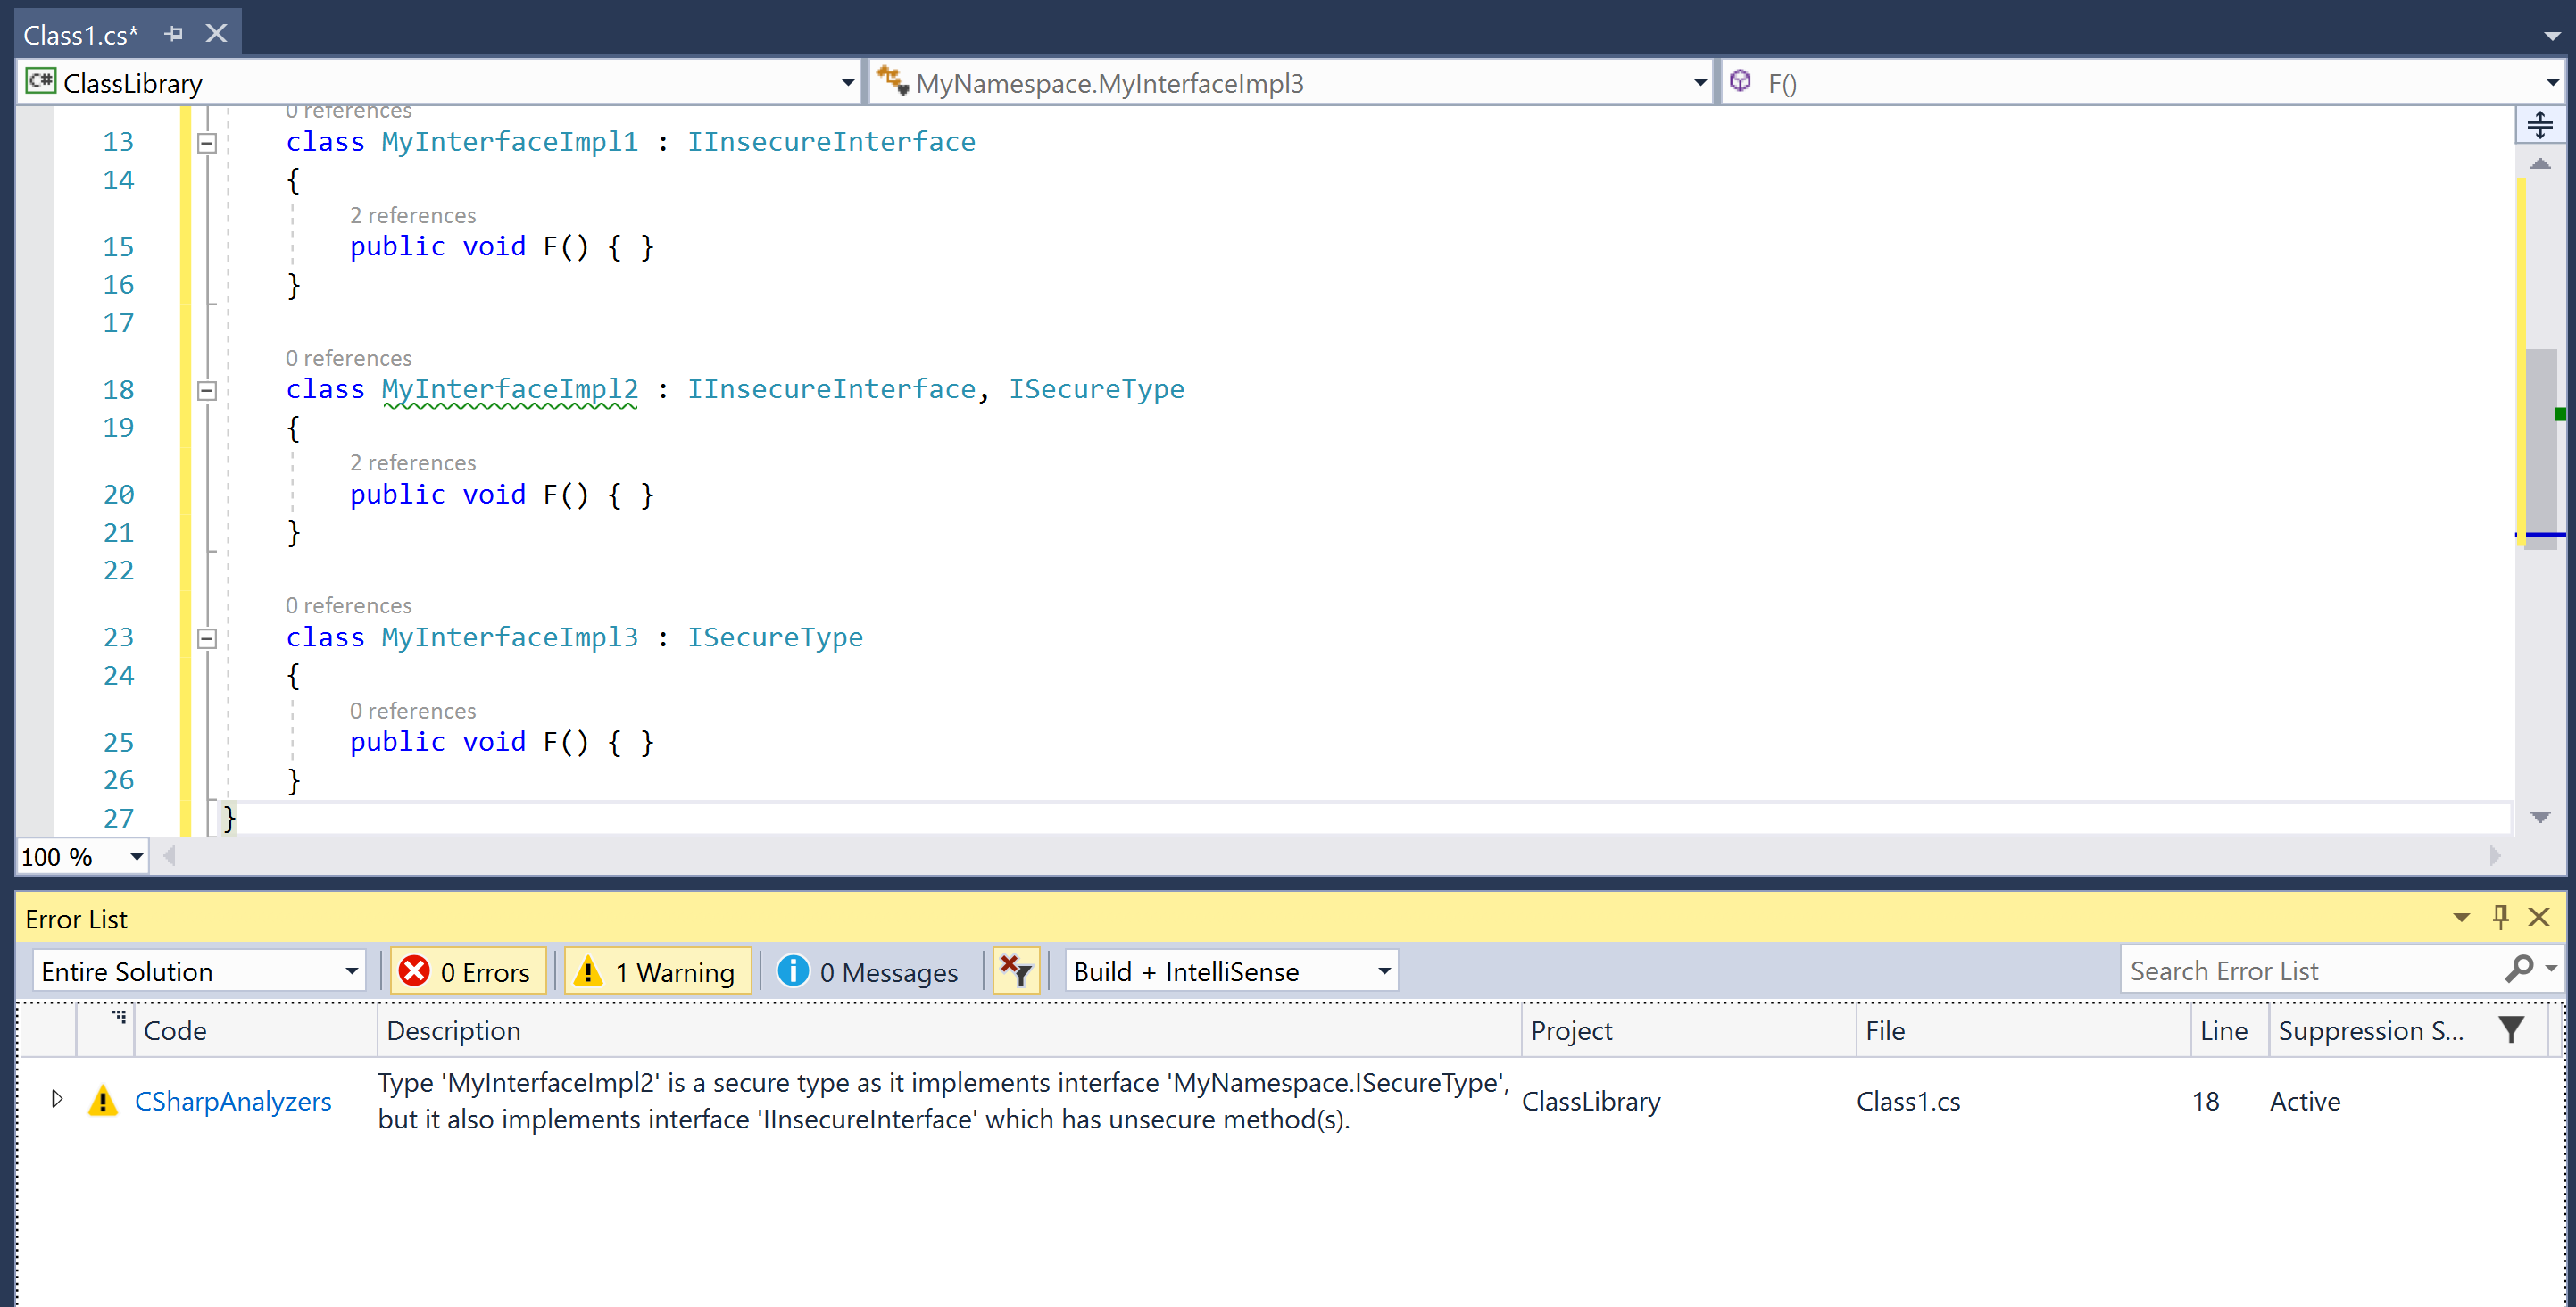
}- Verify the analyzer diagnostic is not reported for
MyInterfaceImpl1andMyInterfaceImpl3, but is reported forMyInterfaceImpl2:
- Now, change
MyInterfaceImpl2so that it no longer implementsIInsecureInterfaceand verify that the diagnostic is no longer reported.
class MyInterfaceImpl2 : ISecureType
{
  public void F() {}
}Compilation analyzers register compilation actions to analyze symbols and/or syntax nodes in the compilation. You can register either a stateless CompilationAction or a stateful CompilationStartAction with nested actions to analyze symbols and/or syntax nodes within a compilation. Our analyzer registers a CompilationStartAction to perform stateful analysis.
context.RegisterCompilationStartAction(compilationContext =>
{
 ...
}
Analysis begins with a couple of early bail out checks: we are only interested in analyzing compilations which have source or metadata types by name MyNamespace.ISecureType and MyNamespace.InsecureMethodAttribute.
 // Check if the attribute type marking insecure methods is defined.
 var insecureMethodAttributeType = compilationContext.Compilation.GetTypeByMetadataName("MyNamespace.InsecureMethodAttribute");
 if (insecureMethodAttributeType == null)
 {
   return;
 }

 // Check if the interface type marking secure types is defined.
 var secureTypeInterfaceType = compilationContext.Compilation.GetTypeByMetadataName("MyNamespace.ISecureType");
 if (secureTypeInterfaceType == null)
 {
   return;
 }
We allocate a new CompilationAnalyzer instance for compilations to be analyzed. A constructor of this type initializes the mutable and immutable state tracked for analysis (explained later).
// Initialize state in the start action.
var analyzer = new CompilationAnalyzer(insecureMethodAttributeType, secureTypeInterfaceType);
We then register a nested symbol action, CompilationAnalyzer.AnalyzeSymbol, on the given compilation start context for the given compilation. We register interest in analyzing type and method symbols within the compilation.
// Register an intermediate non-end action that accesses and modifies the state. compilationContext.RegisterSymbolAction(analyzer.AnalyzeSymbol, SymbolKind.NamedType, SymbolKind.Method);
Finally, we register a nested CompilationEndAction to be executed on the instance of CompilationAnalyzer at the end of the compilation analysis.
// Register an end action to report diagnostics based on the final state. compilationContext.RegisterCompilationEndAction(analyzer.CompilationEndAction);
Note
Nested compilation end actions are always guaranteed to be executed after all the nested non-end actions registered on the same analysis context have finished executing.
Let's now understand the working of the core CompilationAnalyzer type to analyze a specific compilation. This analyzer defines an immutable state for type symbols corresponding to the secure interface and insecure method attribute. It also defines mutable state fields to track the set of types defined in the compilation that implement the secure interface and a set of interfaces defined in the compilation that have methods with an insecure method attribute.
#region Per-Compilation immutable state
 private readonly INamedTypeSymbol _insecureMethodAttributeType;
 private readonly INamedTypeSymbol _secureTypeInterfaceType;
#endregion

#region Per-Compilation mutable state
 /// <summary>
 /// List of secure types in the compilation implementing secure interface.
 /// </summary>
 private List<INamedTypeSymbol> _secureTypes;

 /// <summary>
 /// Set of insecure interface types in the compilation that have methods with an insecure method attribute.
 /// </summary>
 private HashSet<INamedTypeSymbol> _interfacesWithInsecureMethods;
#endregion
At the start of the analysis, we initialize the set of secure types and interfaces with insecure methods to be empty.
#region State intialization
 public CompilationAnalyzer(INamedTypeSymbol insecureMethodAttributeType, INamedTypeSymbol secureTypeInterfaceType)
{
  _insecureMethodAttributeType = insecureMethodAttributeType;
  _secureTypeInterfaceType = secureTypeInterfaceType;

  _secureTypes = null;
  _interfacesWithInsecureMethods = null;
 }
#endregion
AnalyzeSymbol is registered as a nested symbol action to analyze all types and methods within the compilation. For every type declaration in the compilation, we check whether it implements the secure interface, and if so, add it to our set of secure types. For every method declaration in the compilation, we check whether its containing type is an interface and the method has the insecure method attribute, and if so, add the containing interface type to our set of interface types with insecure methods.
  #region Intermediate actions
  public void AnalyzeSymbol(SymbolAnalysisContext context)
  {
    switch (context.Symbol.Kind)
    {
      case SymbolKind.NamedType:
      // Check if the symbol implements "_secureTypeInterfaceType".
      var namedType = (INamedTypeSymbol)context.Symbol;
      if (namedType.AllInterfaces.Contains(_secureTypeInterfaceType))
      {
        _secureTypes = _secureTypes ?? new List<INamedTypeSymbol>();
        _secureTypes.Add(namedType);
      }

      break;

      case SymbolKind.Method:
      // Check if this is an interface method with "_insecureMethodAttributeType" attribute.
      var method = (IMethodSymbol)context.Symbol;
      if (method.ContainingType.TypeKind == TypeKind.Interface && method.GetAttributes().Any(a => a.AttributeClass.Equals(_insecureMethodAttributeType)))
      {
        _interfacesWithInsecureMethods = _interfacesWithInsecureMethods ?? new HashSet<INamedTypeSymbol>();
        _interfacesWithInsecureMethods.Add(method.ContainingType);
      }

      break;
    }
  }
  #endregion
Finally, the registered the compilation end action uses the final state at the end of compilation analysis to report diagnostics. Analysis in this action starts by bailing out early if we either have no secure types or no interfaces with insecure methods. Then, we walk through all secure types and all interfaces with insecure methods, and for every pair. check whether the secure type or any of its base types implements the insecure interface. If so, we report a diagnostic on the secure type.
   #region End action
   public void CompilationEndAction(CompilationAnalysisContext context)
   {
     if (_interfacesWithInsecureMethods == null || _secureTypes == null)
     {
       // No violating types.
       return;
     }

     // Report diagnostic for violating named types.
     foreach (var secureType in _secureTypes)
     {
       foreach (var insecureInterface in _interfacesWithInsecureMethods)
       {
         if (secureType.AllInterfaces.Contains(insecureInterface))
         {
           var diagnostic = Diagnostic.Create(Rule, secureType.Locations[0], secureType.Name, "MyNamespace.ISecureType", insecureInterface.Name);
       context.ReportDiagnostic(diagnostic);

           break;
         }
       }
     }
   }
#endregionIn this section, we will show you how to write and execute unit tests for an analyzer project.
You will need to have created and opened an analyzer project, say CSharpAnalyzers in Visual Studio 2017. Refer to the first recipe in this chapter to create this project.
- Open UnitTests.cs in the
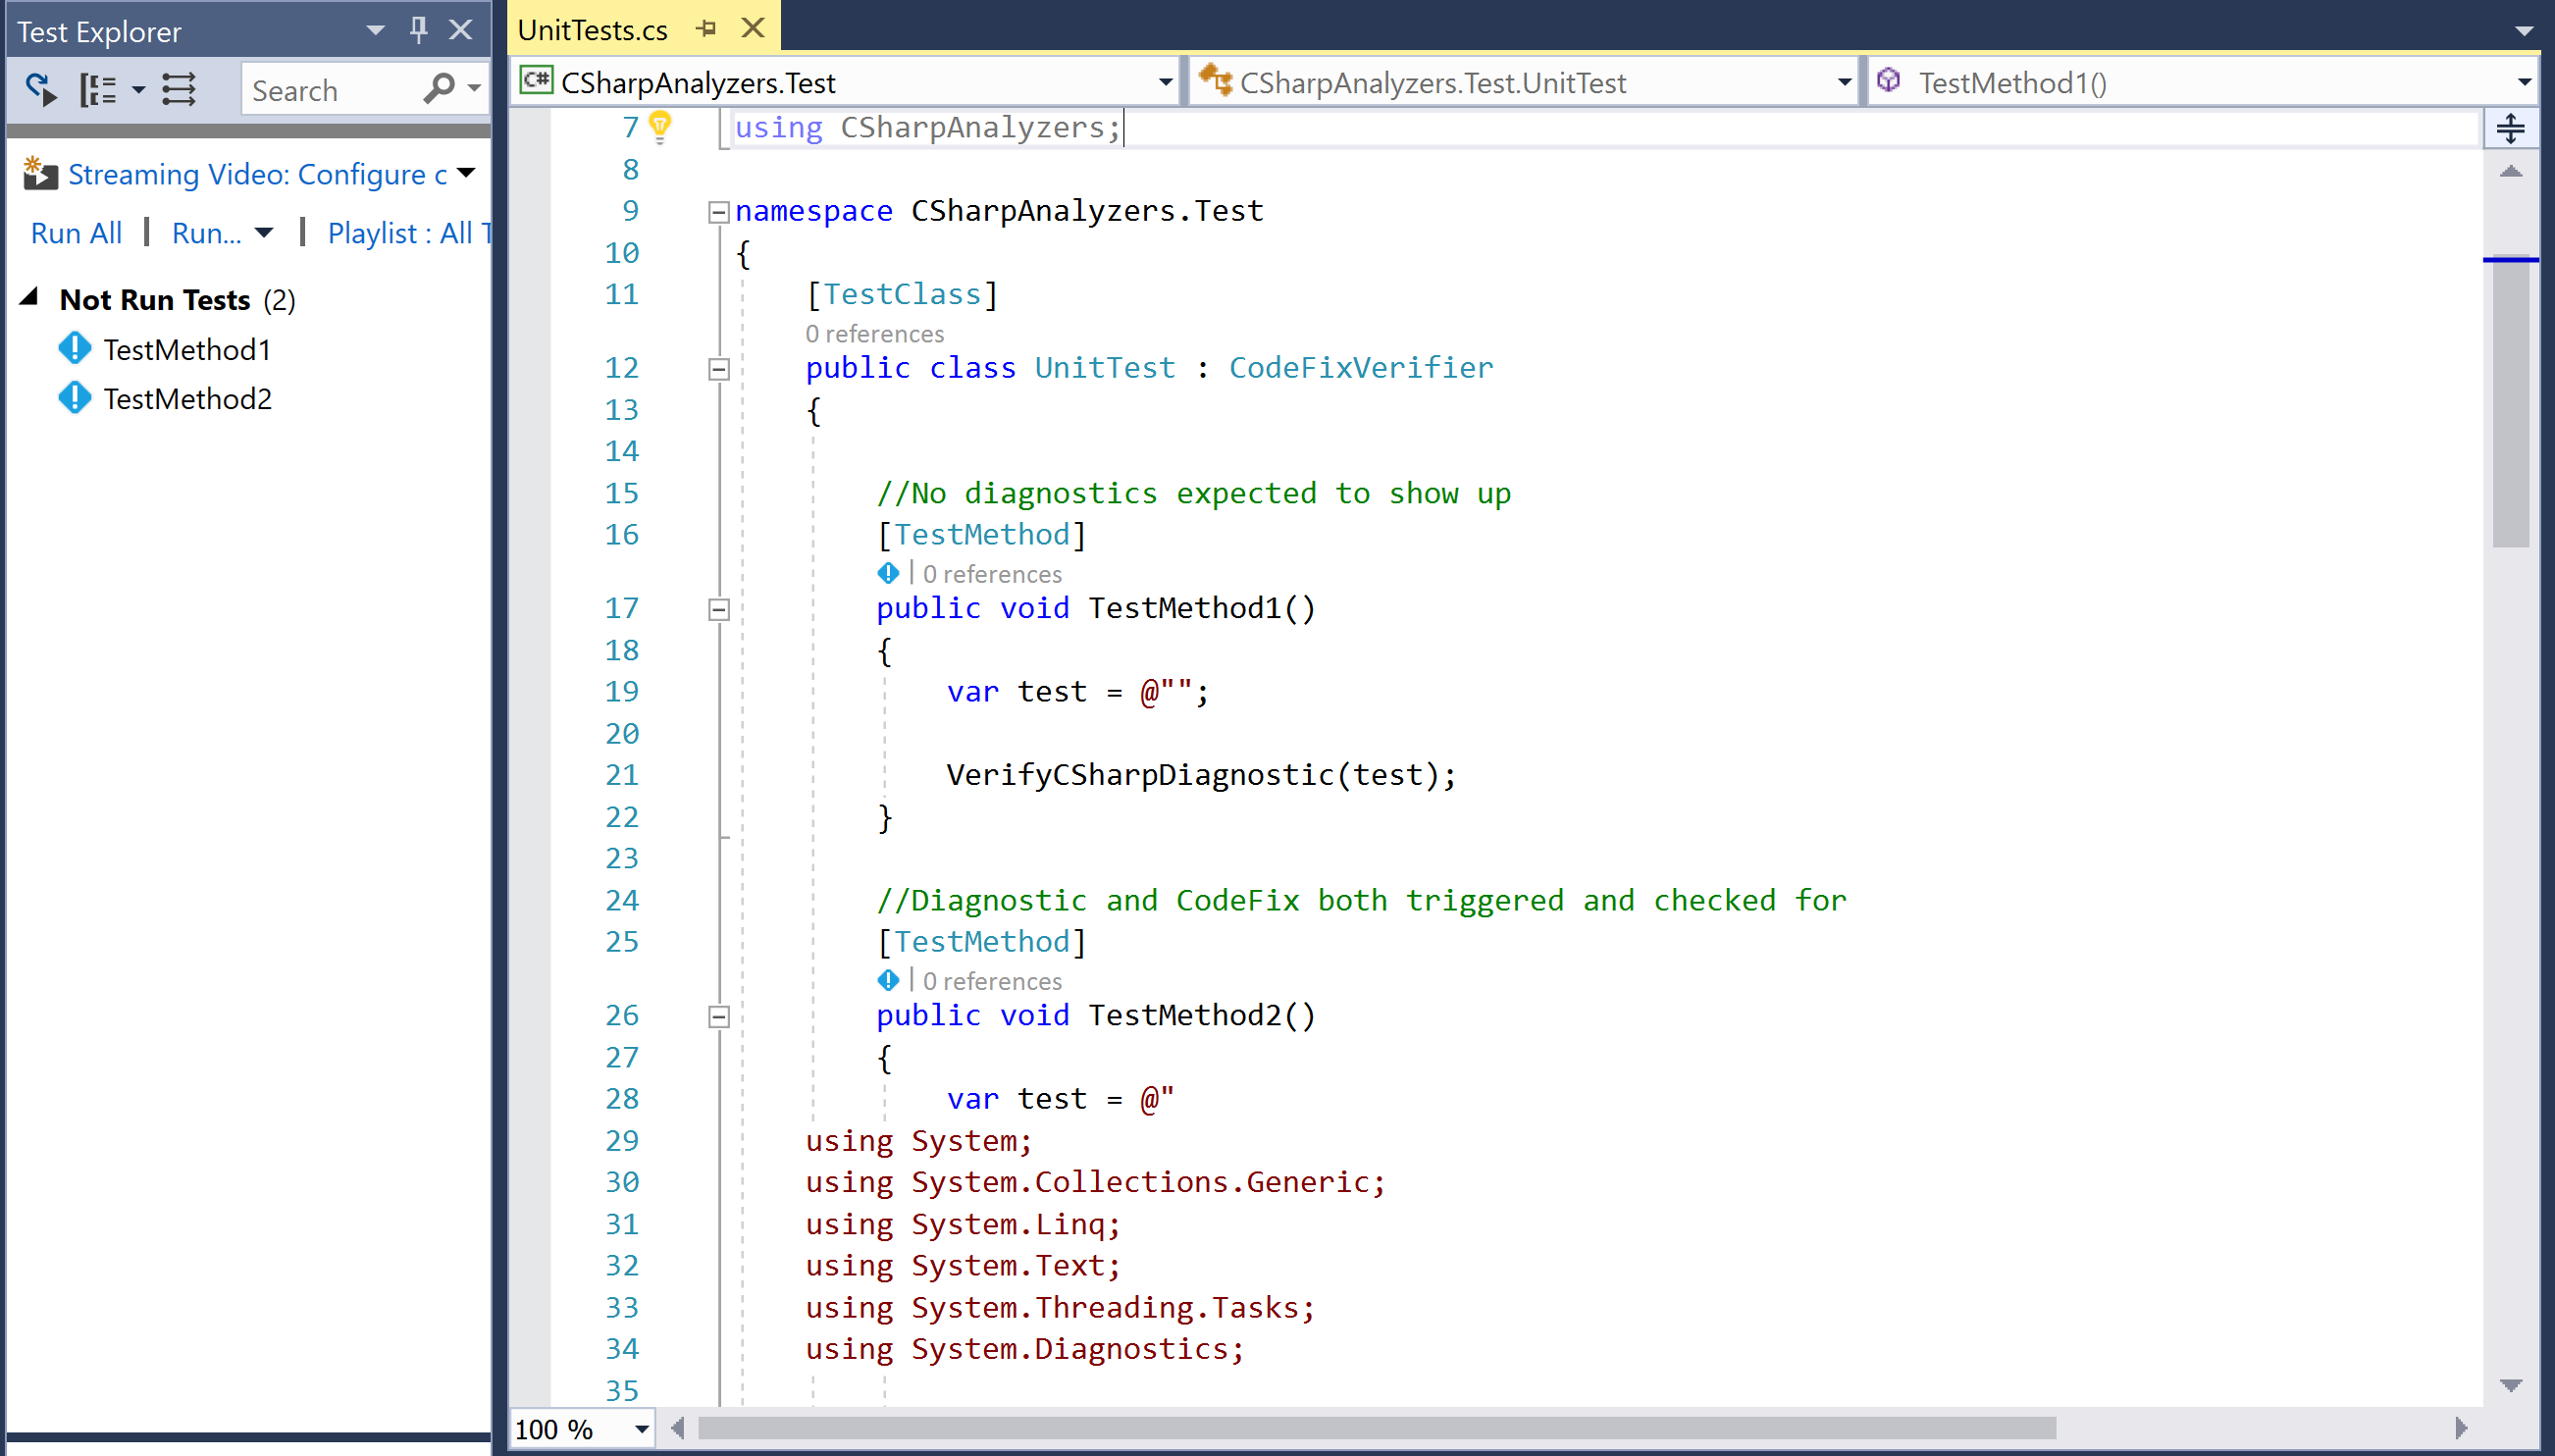
CSharpAnalyzers.Testproject in theSolution Explorersolution to view the default unit tests created for the default symbol analyzer (type names should not contain lowercase letters) for the template analyzer project.
- Navigate to
Test|Windows|Test Windowto open theTest Explorerwindow to view the unit tests in the project. Default analyzer project has two unit tests:TestMethod1: This tests the scenario where analyzer diagnostic does not fire on the test code andTestMethod2: This tests the scenario where analyzer diagnostic does fire on the test code.
Note
Note that the unit test project contains unit tests for both the DiagnosticAnalyzer and CodeFixProvider. This chapter deals with analyzer testing only. We will expand on the unit tests for the CodeFixProvider later in this book.
- Run all the unit tests for the project by right-clicking
Not Run testsnode in theTest Explorer, executing theRun selected testscontext menu command, and verify that the tests pass.
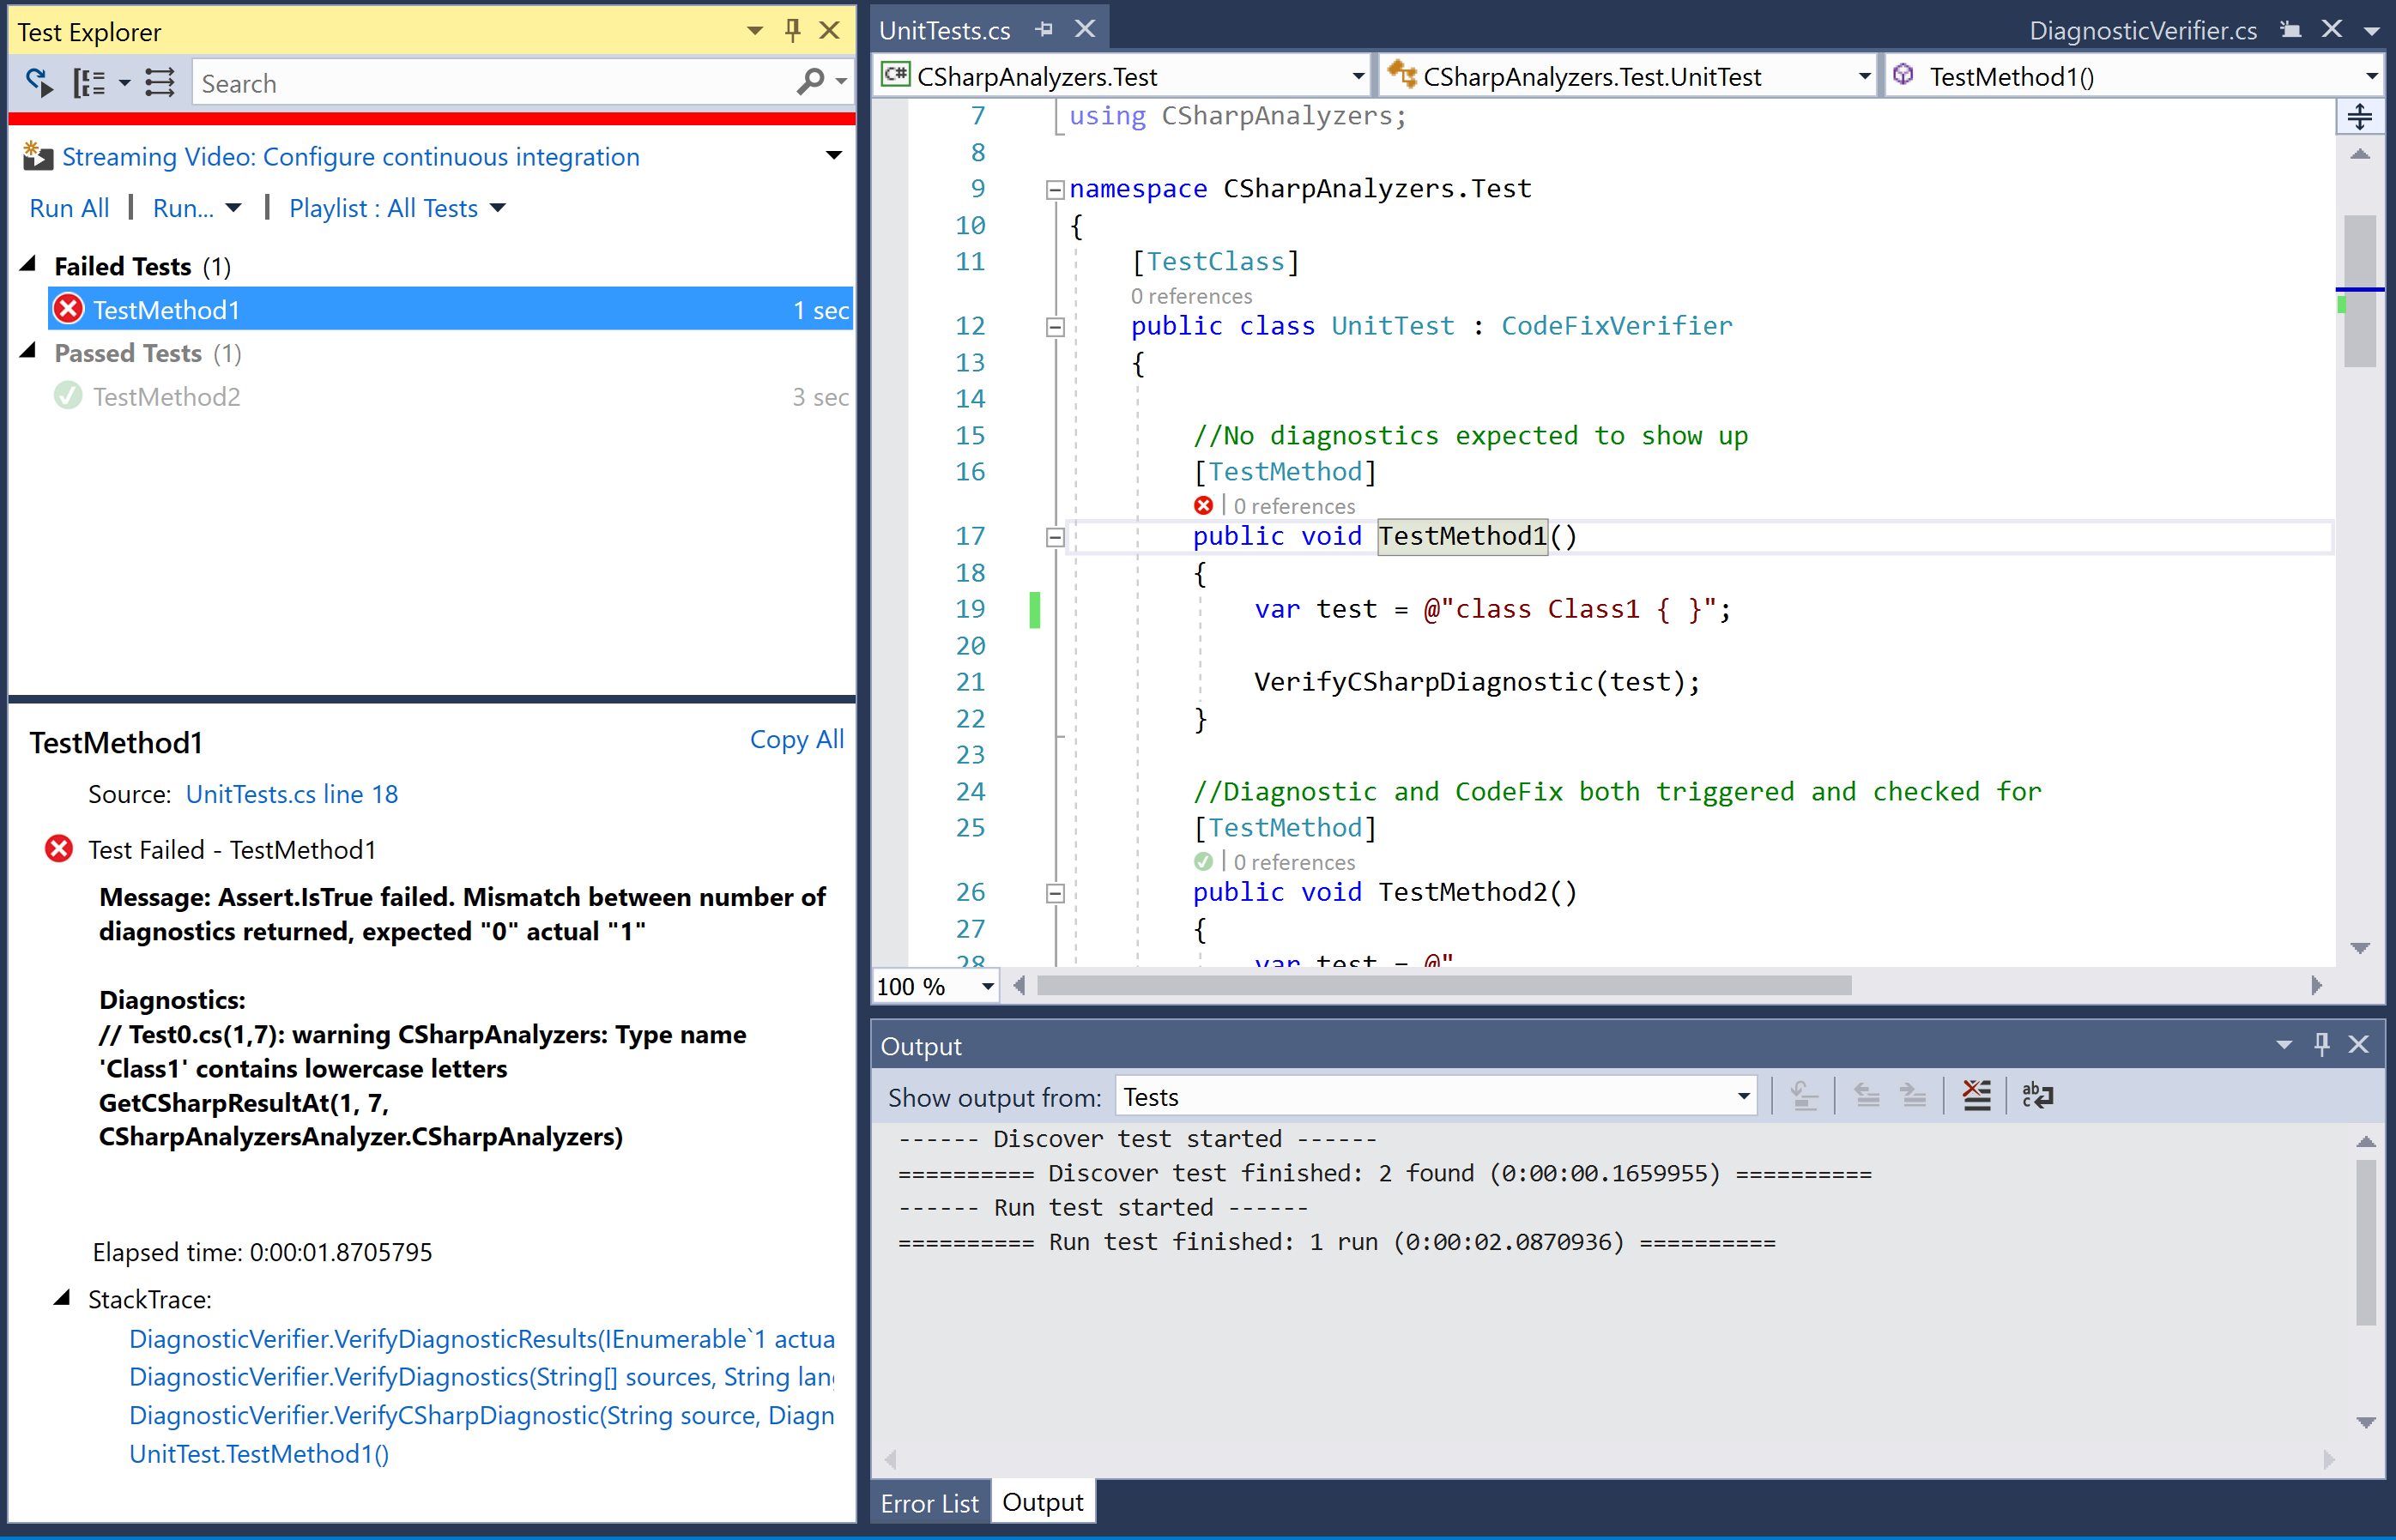
- Edit
TestMethod1so that the test code now has a type with lower-case letters:
[TestMethod]
public void TestMethod1()
{
  var test = @"class Class1 { }";

  VerifyCSharpDiagnostic(test);
}- Right-click on
TestMethod1in the editor, execute theRun testscontext menu command, and verify that the test now fails with the diagnostic mismatch assert -expected "0" actual "1":
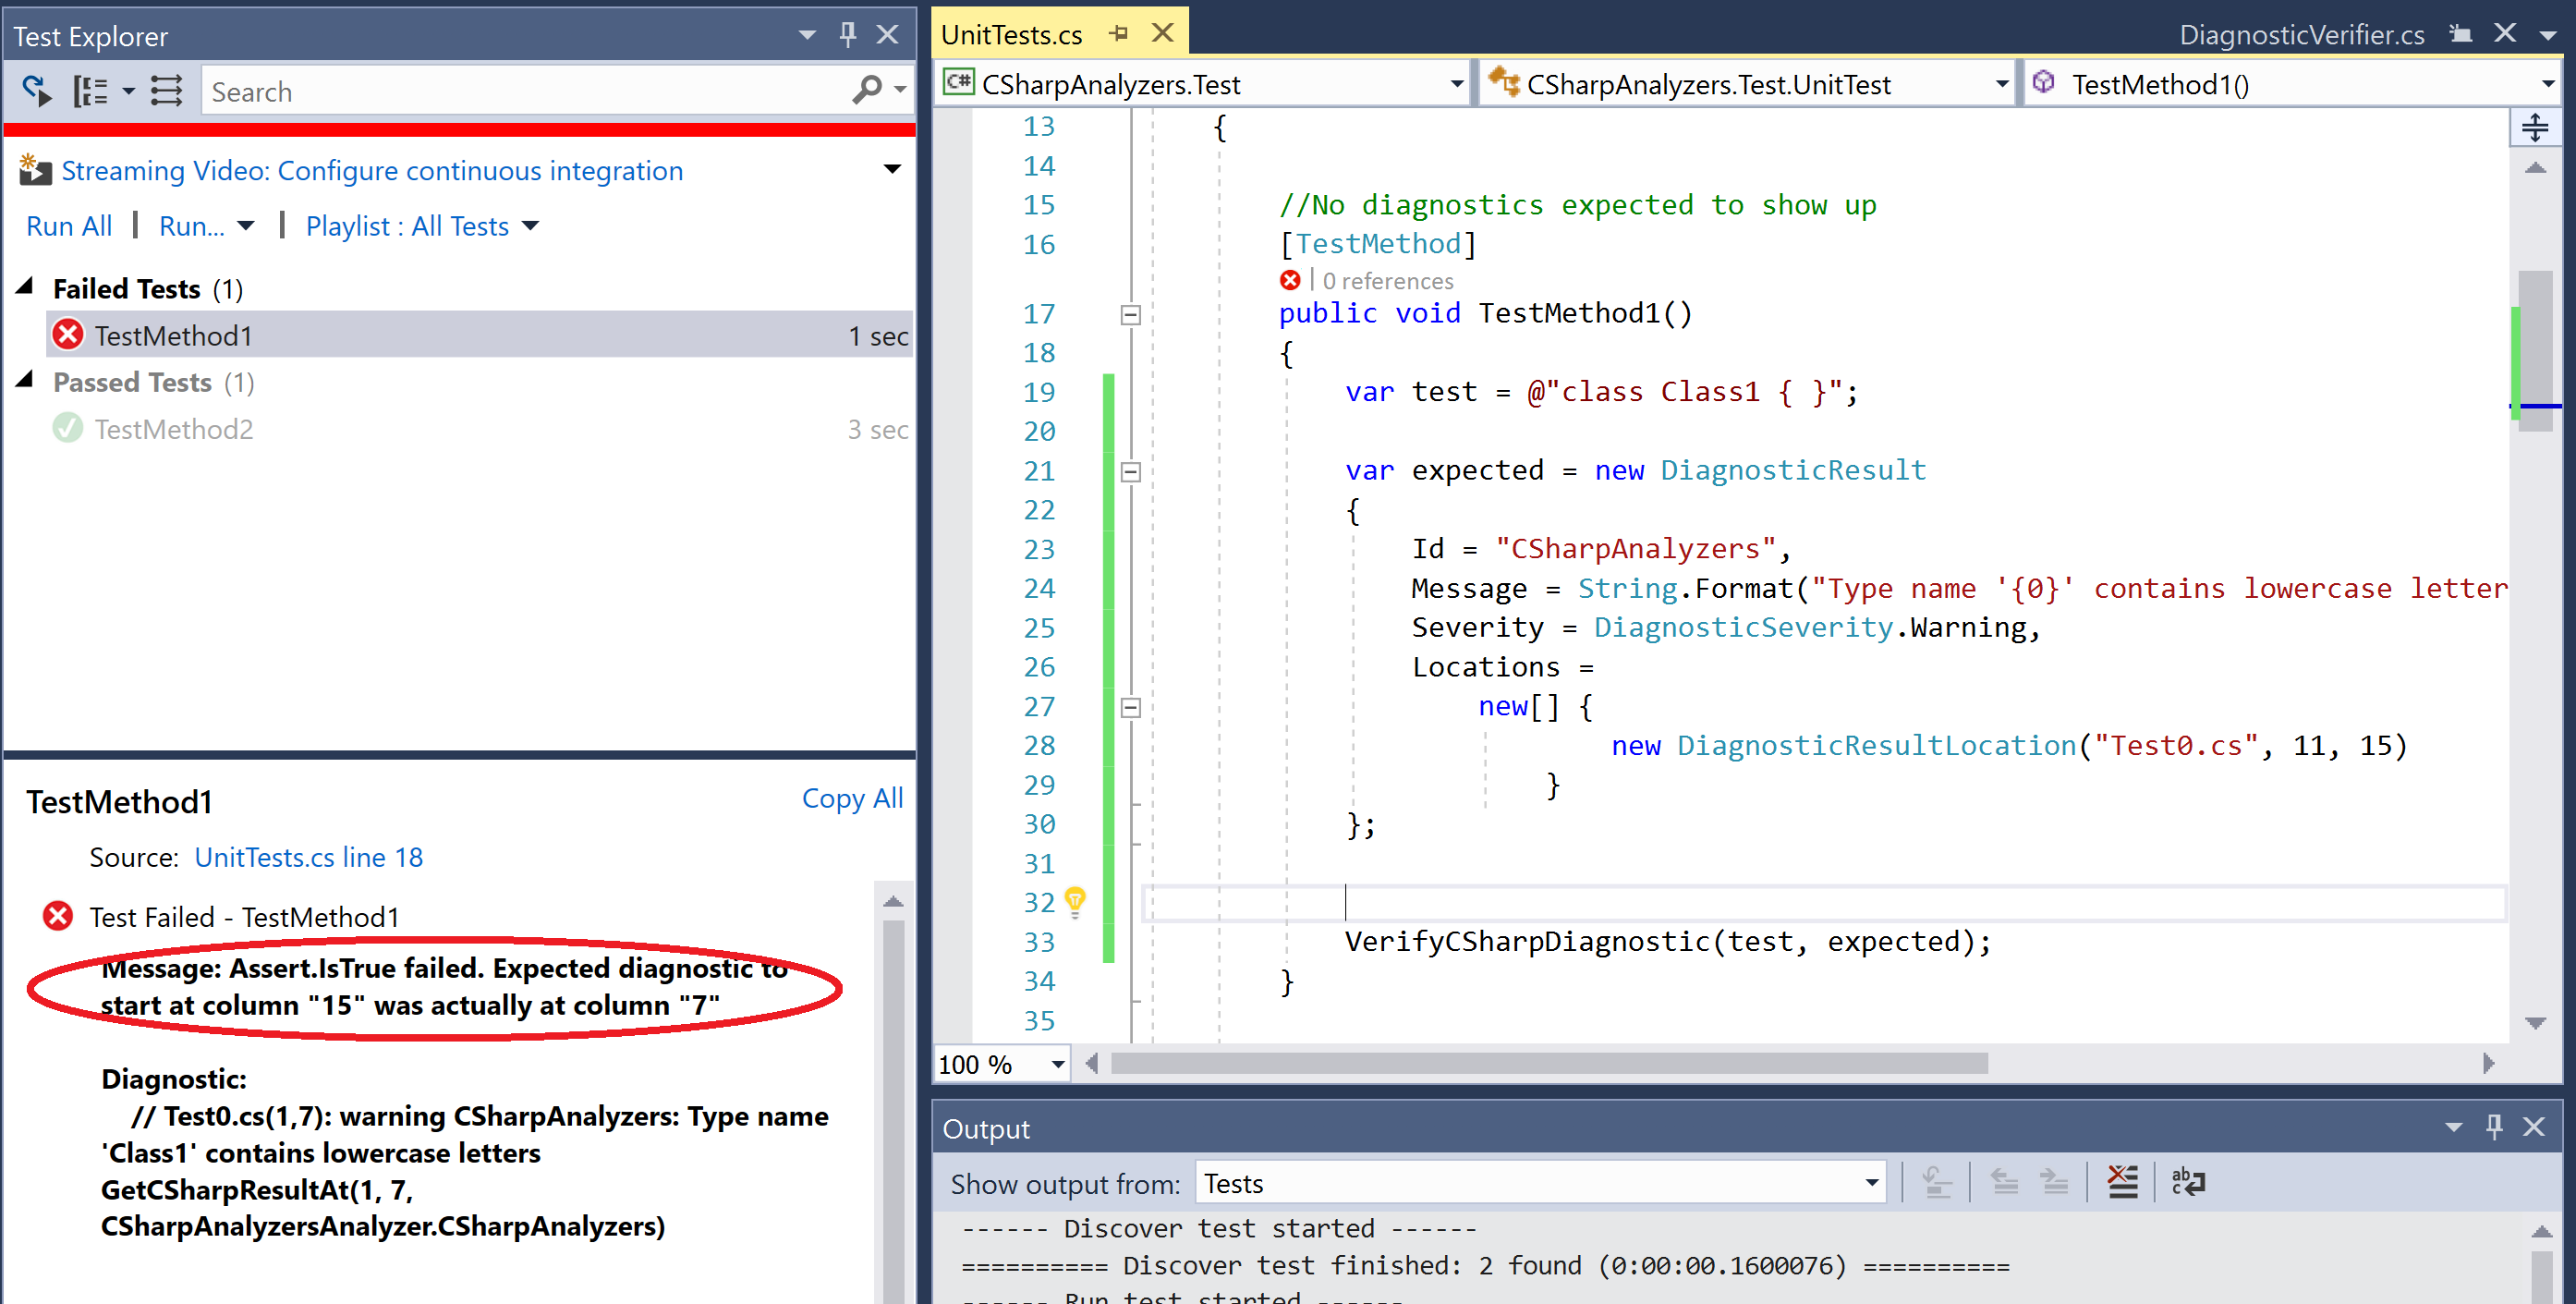
- Edit
TestMethod1to now add an excepted diagnostic for the new test code:
var expected = new DiagnosticResult
{
  Id = "CSharpAnalyzers",
  Message = String.Format("Type name '{0}' contains lowercase letters", "Class1"),
  Severity = DiagnosticSeverity.Warning,
  Locations = new[] {
    new DiagnosticResultLocation("Test0.cs", 11, 15)
  }
};

VerifyCSharpDiagnostic(test, expected);- Run the unit test again and note that the test still fails, but now it fails due to a difference in the location (column number) at which the diagnostic was reported.
- Edit the diagnostic location to use the correct expected column number and rerun the test - verify that the test passes now.
new DiagnosticResultLocation("Test0.cs", 11, 7)- Edit
TestMethod1and change the test code to renameClass1toCLASS1:
var test = @"class CLASS1 { }";- Run the unit test again and verify that the test fails now due to a diagnostic mismatch assert -
expected "1" actual "0".
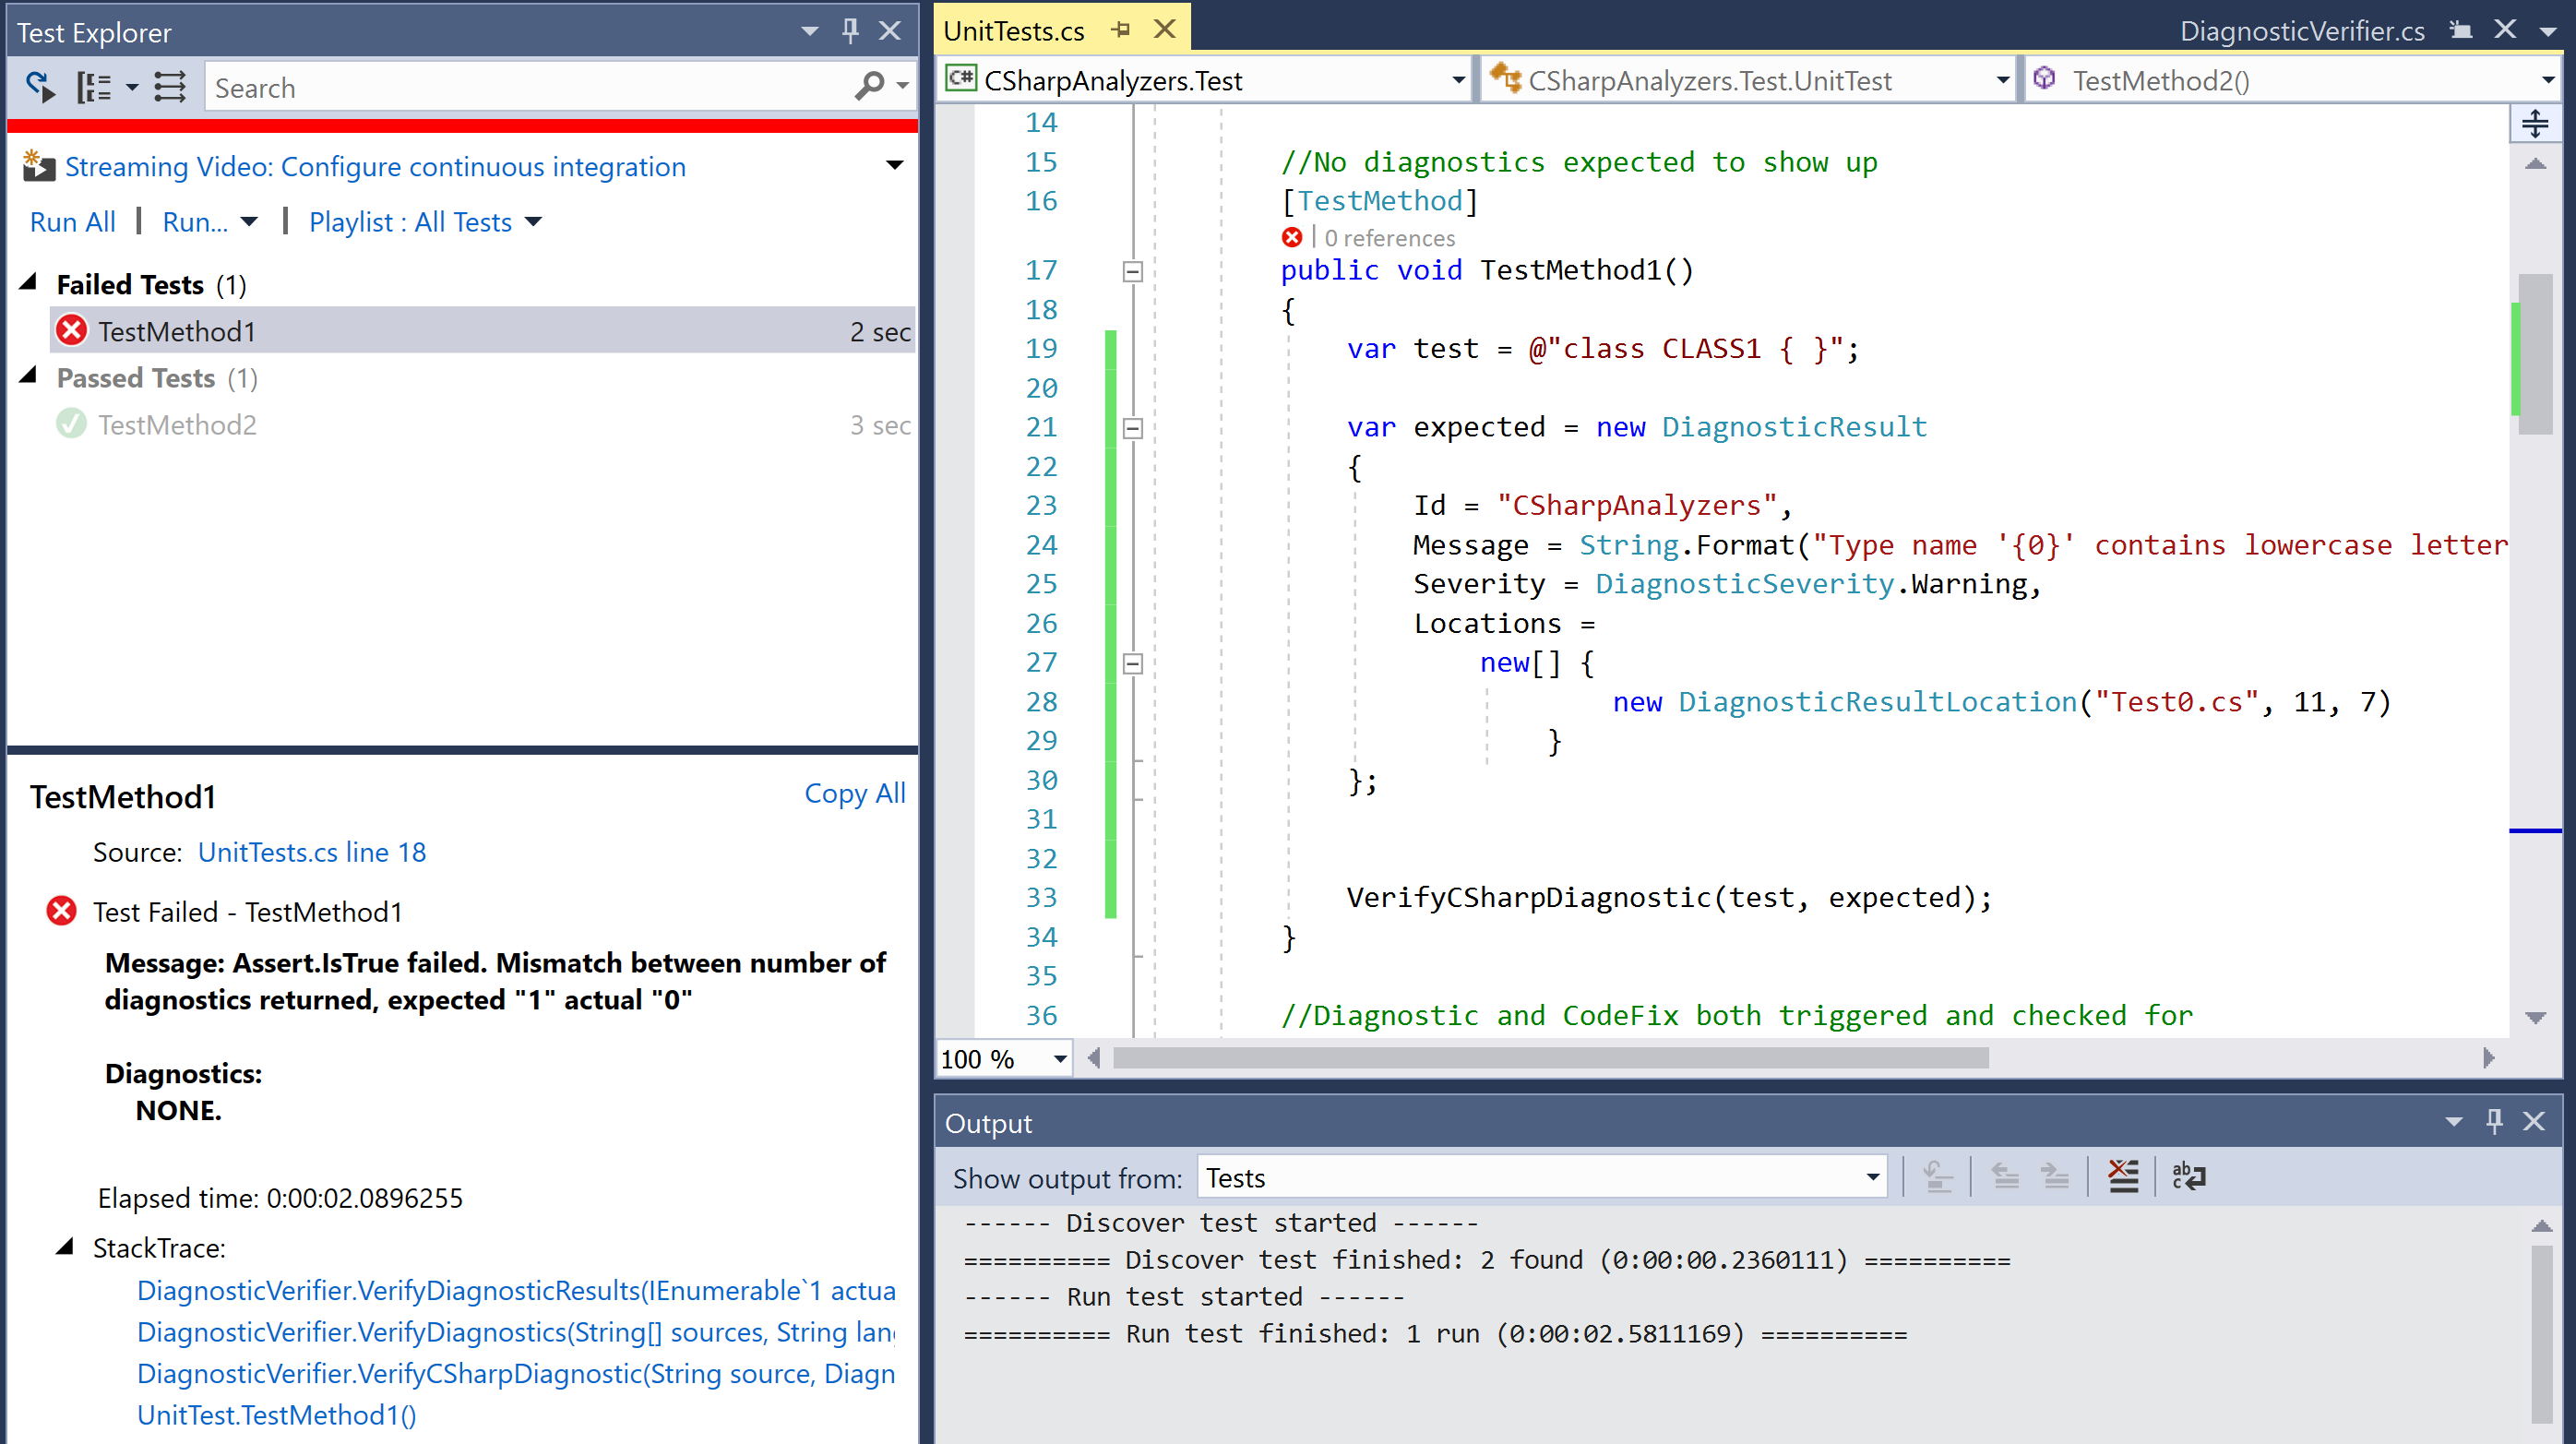
- Edit
TestMethod1to remove the expected diagnostic and verify the test passes:
 var test = @"class CLASS1 { }";

VerifyCSharpDiagnostic(test);The analyzer unit test project allows us to write unit tests for the execution of our analyzer on different code samples. Each unit test is marked with a TestMethod attribute and defines sample test code, expected diagnostic(s) reported by the analyzer on that code (if any), and invocation of test helper method(s), here VerifyCSharpDiagnostic, to verify diagnostics.
//No diagnostics expected to show up
[TestMethod]
public void TestMethod1()
{
  var test = @"";

  VerifyCSharpDiagnostic(test);
}
Unit tests can define expected diagnostics using the DiagnosticResult type, which must specify the diagnostic Id, Message, Severity and Locations for the diagnostic:
var expected = new DiagnosticResult
{
  Id = "CSharpAnalyzers",
  Message = String.Format("Type name '{0}' contains lowercase letters", "Class1"),
  Severity = DiagnosticSeverity.Warning,
  Locations = new[] { new DiagnosticResultLocation("Test0.cs", 11, 15) }
};

VerifyCSharpDiagnostic(test, expected);
Note
Computing the correct line number and column number for an expected diagnostic, for example (11, 15), can be a bit tricky. The approach that normally works is to start with a default location of (0, 0), execute the test once, and look at the failure text in the Test Explorer window to get the expected and actual line number. Then, replace the expected line number in the test code with the actual line number. Re-execute the test and repeat the process to get the correct column number.
UnitTest type containing all the unit tests also overrides the following methods to return the DiagnosticAnalyzer (and optionally a CodeFixProvider) to be tested:
 protected override CodeFixProvider GetCSharpCodeFixProvider()
 {
   return new CSharpAnalyzersCodeFixProvider();
 }

protected override DiagnosticAnalyzer GetCSharpDiagnosticAnalyzer()
 {
   return new CSharpAnalyzersAnalyzer();
 }
Now, let us expand a bit more on the test framework helpers for the unit tests. The analyzer unit test project contains two primary helper abstract types to write unit tests for analyzers and code fixes:
DiagnosticVerifier: Contains helper methods to runDiagnosticAnalyzerunit tests that verify the analyzer diagnostics for a given set of test sources.CodeFixVerifier: Contains helper methods to runDiagnosticAnalyzerandCodeFixProviderunit tests that verify the analyzer diagnostics for a given set of test sources before and after applying a code fix. This type derives fromDiagnosticVerifier.
In the default analyzer project, UnitTest type derives from CodeFixVerifier, but could also be changed to derive from DiagnosticVerifier, if you are only interested in writing analyzer unit tests. We will just focus on the DiagnosticVerifier here; CodeFixVerifier is covered later in chapter.
DiagnosticVerifier type is split into 2 source files DiagnosticVerifier.cs and DiagnosticVerifier.Helper.cs.
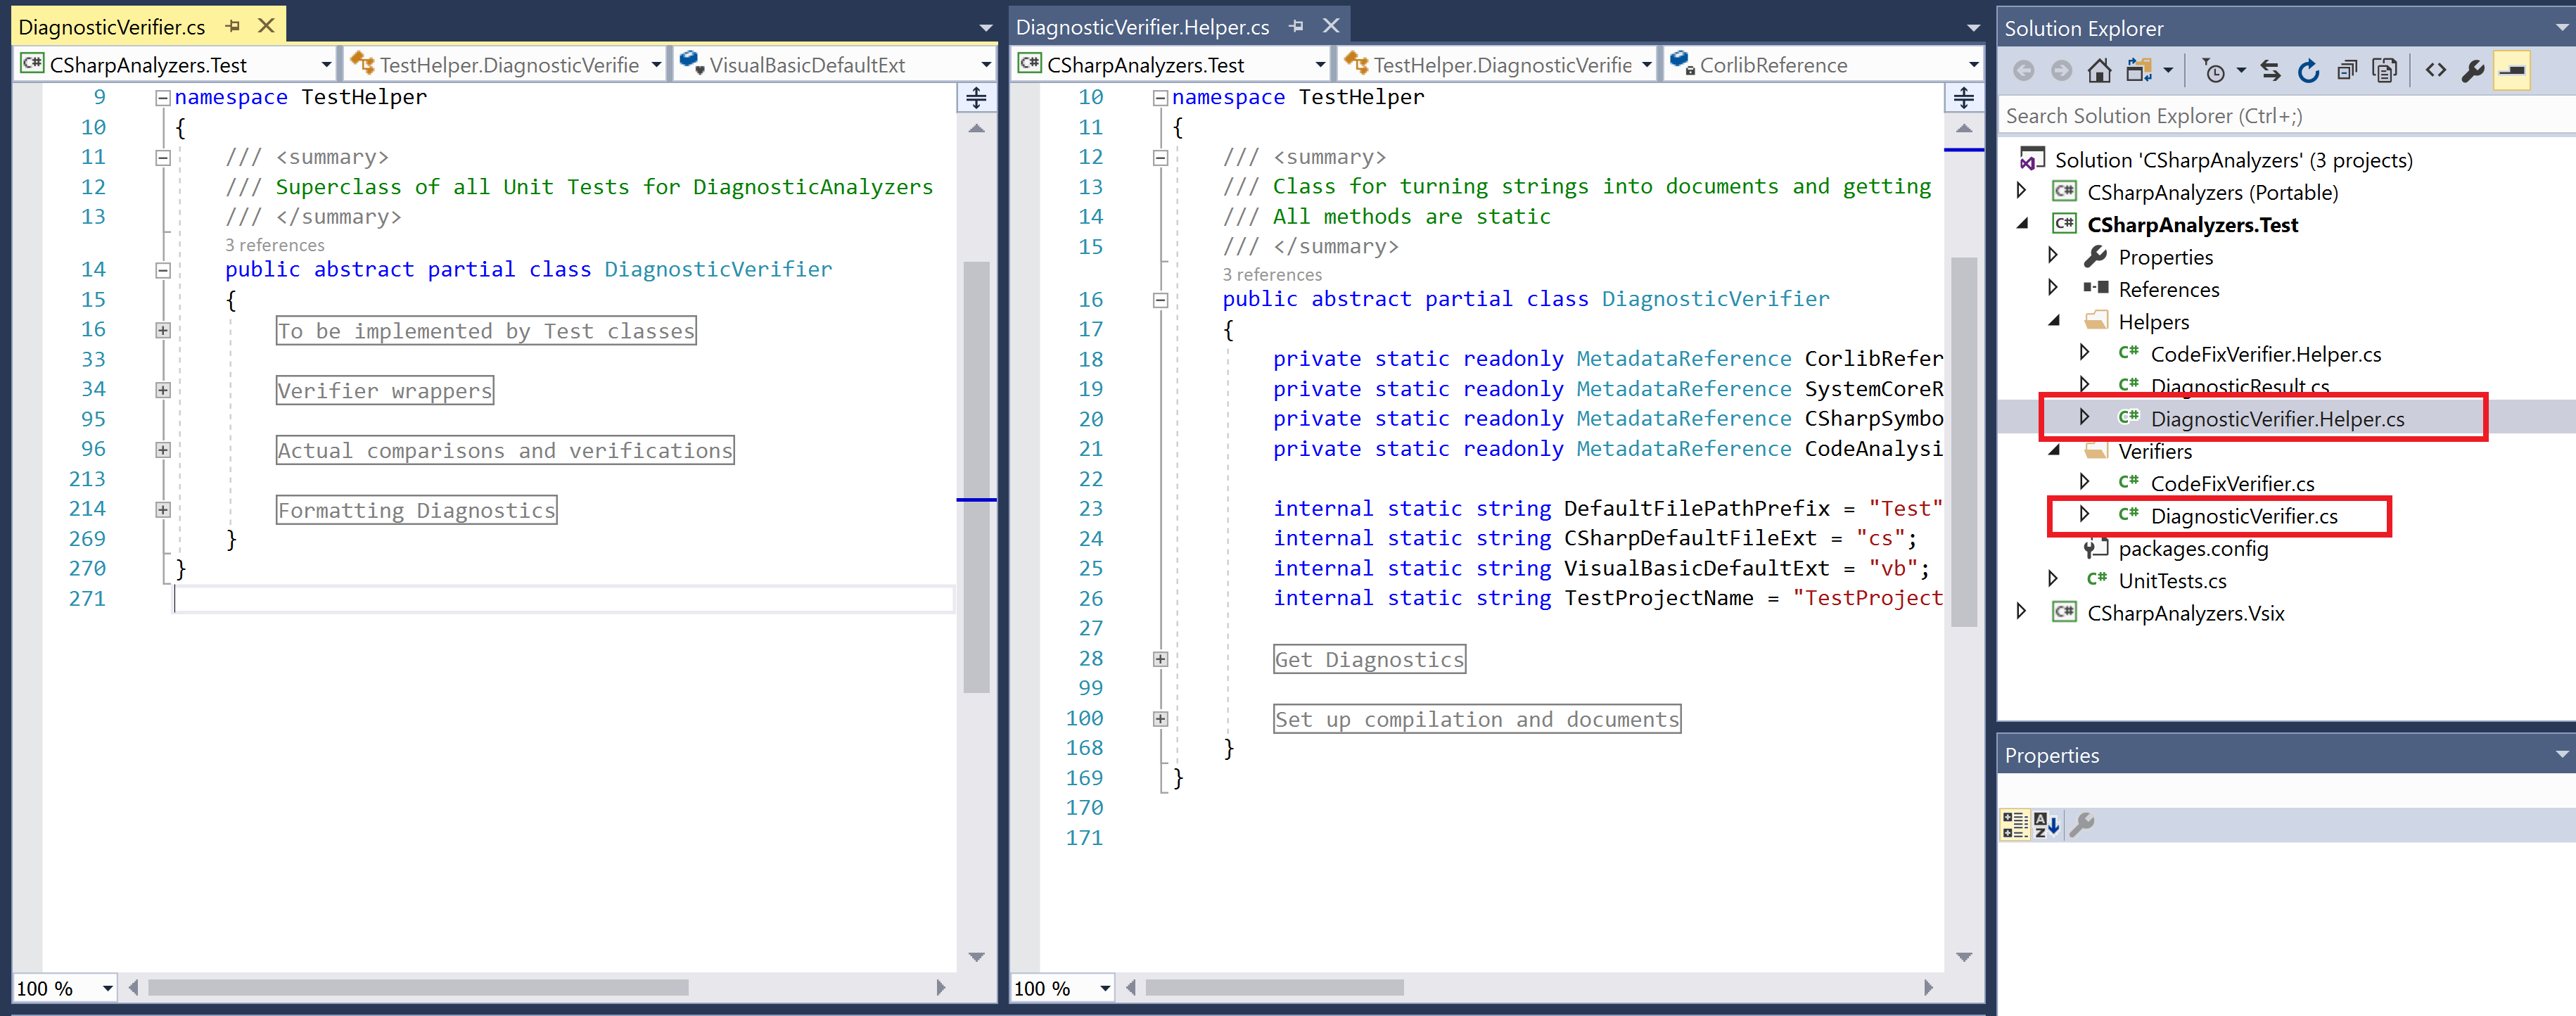
DiagnosticVerifier.Helper.cscontains the following core functionality:- Helper methods to create a compilation with source files based on given C# or VisualBasic source code (
Set up compilation and documentsregion in the preceding screenshot). - Helper methods to invoke the preceding functionality to create a compilation with the given C# or VisualBasic source code, and execute the given
DiagnosticAnalyzeron the compilation to produce analyzer diagnostics and return sorted diagnostics for verification (Get Diagnosticsregion in the preceding screenshot).
- Helper methods to create a compilation with source files based on given C# or VisualBasic source code (
DiagnosticVerifier.cscontains the following core functionality:- Method(s) to get the
DiagnosticAnalyzertype to be tested (To be implemented by Test classesregion in the preceding screenshot). - Private helpers to perform actual diagnostic comparison and verification and formatting of diagnostics to get a string representation of actual/expected diagnostics when a unit test fails (
Actual comparisons and verificationsregion andFormatting Diagnosticsregion in the preceding screenshot). - Diagnostic verification methods
VerifyCSharpDiagnosticandVerifyBasicDiagnosticthat can be invoked by the unit tests to verify analyzer diagnostics generated on the given C# or Visual Basic source code (Verifier wrapperssection in the preceding screenshot). These methods invoke theGet Diagnosticshelpers to create a compilation and get sorted analyzer diagnostics and then invoke the preceding private helpers to compare and verify diagnostics.
- Method(s) to get the
Live Unit testing is a new feature in Visual Studio 2017 Enterprise Edition, which automatically runs the impacted unit tests in the background as you edit code, and visualizes the results and code coverage live, in the editor, in real-time. Refer to Chapter 6, Live Unit Testing in Visual Studio Enterprise, to enable live unit testing for the project and visualize unit tests automatically executing after you edit the code in the steps in this recipe.
We will show you how to configure, build, and publish a NuGet package and a VSIX package for an analyzer project created in Visual Studio 2017 using the .NET Compiler platform SDK.
Before we start digging into these topics, let's understand the difference between NuGet-based analyzer packages and VSIX-based analyzer packages. NuGet and VSIX are basically two different packaging schemes for the Microsoft development platform to package files such as assemblies, resources, build targets, tools, and so on, into a single installable package.
- NuGet is a more generic packaging scheme. NuGet packages (
.nupkgfiles) can be directly referenced in .NET projects and installed to a specific project or solution using the NuGet package manager in Visual Studio. Analyzer NuGet packages based on the analyzer template project get installed as AnalyzerReferences in the project file, and then get passed onto the compiler command line to be executed during build. Additionally, AnalyzerReferences are resolved at design time by the Visual Studio IDE and executed while code editing to generate live diagnostics. - A VSIX package is a
.vsixfile that contains one or more Visual Studio extensions, together with the metadata Visual Studio uses to classify and install the extensions. An analyzer VSIX package can be installed machine-wide or to a specific extension hive, and is enabled for all projects/solutions opened from the Visual Studio hive. Unlike aNuGetpackage, it cannot be installed specifically to a project/solution and does not travel along with the project sources.
Note
As of Visual Studio 2017, analyzers installed as AnalyzerReferences via NuGet packages execute during both: command line builds and live code editing in Visual Studio. Analyzers installed via Analyzer VSIX packages execute only during live code editing in Visual Studio and not during project build. Hence, only analyzer NuGet packages can be configured to execute in continuous integration (CI) build systems and break the build.
You will need to have created and opened an analyzer project, say CSharpAnalyzers in Visual Studio 2017. Refer to the first recipe in this chapter to create this project.
- Build
CSharpAnalyzerssolution in Visual Studio by executing theBuild|Build Solutioncommand. - Open the binary output folder for the
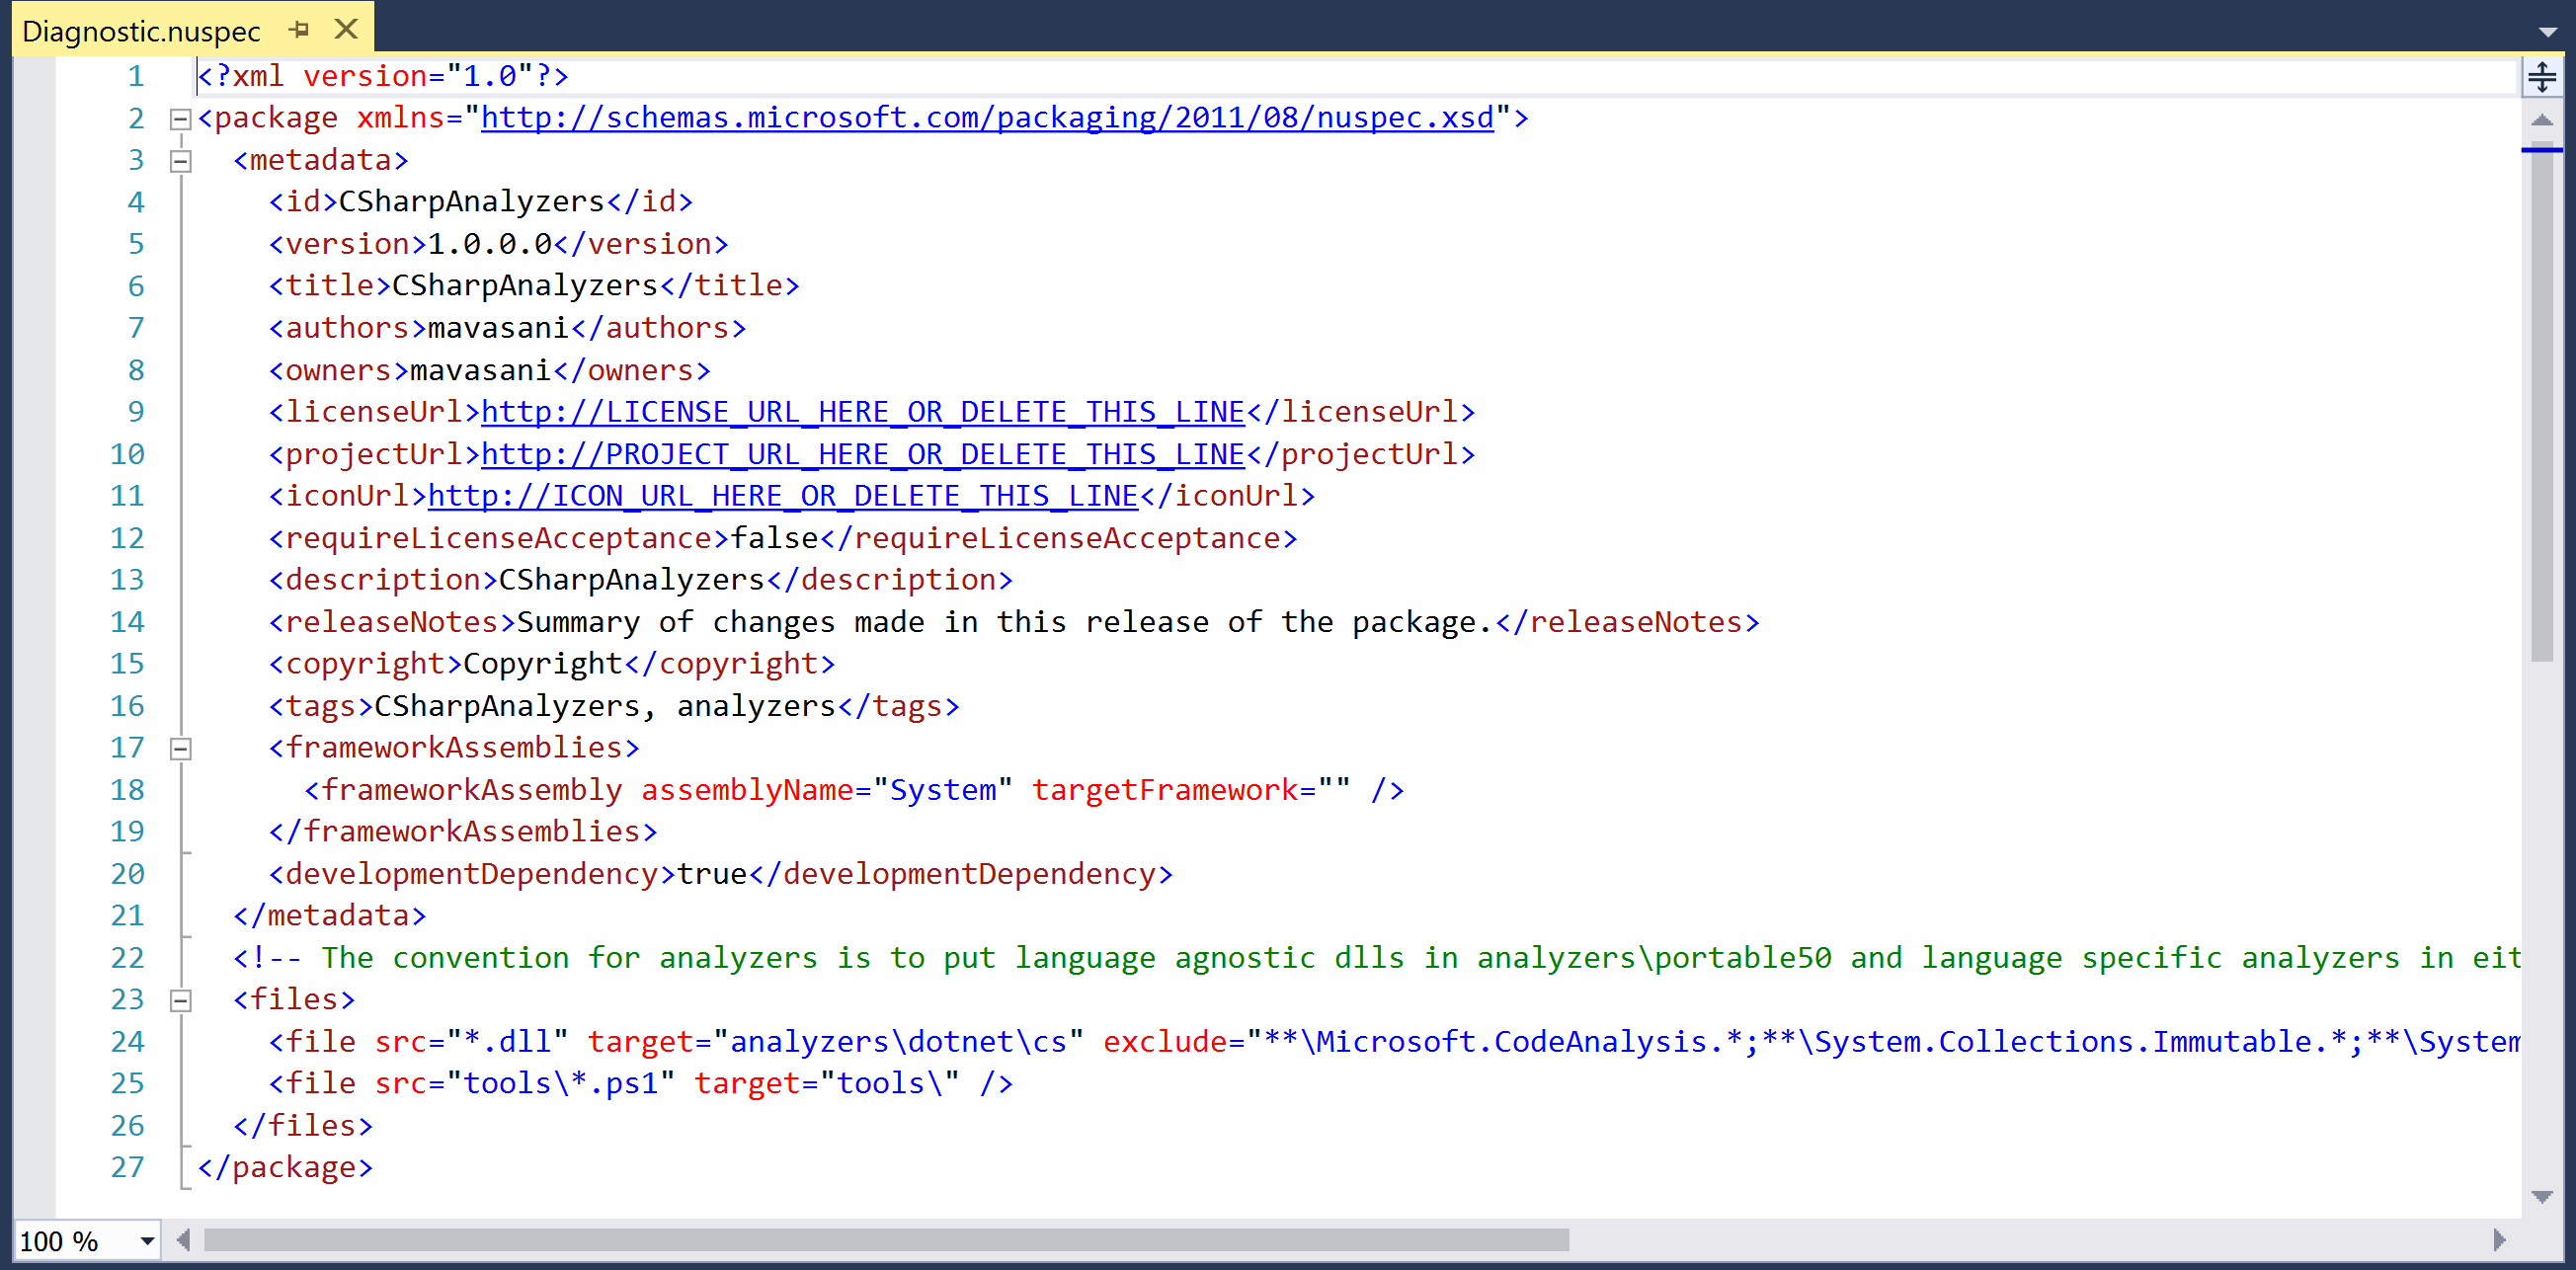
CSharpAnalyzersproject (<%SolutionFolder%>\CSharpAnalyzers\bin\debug) in Windows Explorer and verify that the NuGet package for the analyzer named,CSharpAnalyzers.1.0.X.Y.nupkg, is generated in the folder. - Double-click on the
Diagnostic.nuspecfile in theCSharpAnalyzersproject inSolution Explorerto view and configure the properties of the nupkg.
- Rebuild the project to regenerate the nupkg with new properties.
- Publish the nupkg as a public or private package by following the steps listed here: https://docs.microsoft.com/en-us/nuget/create-packages/publish-a-package.
- Open the binary output folder for the
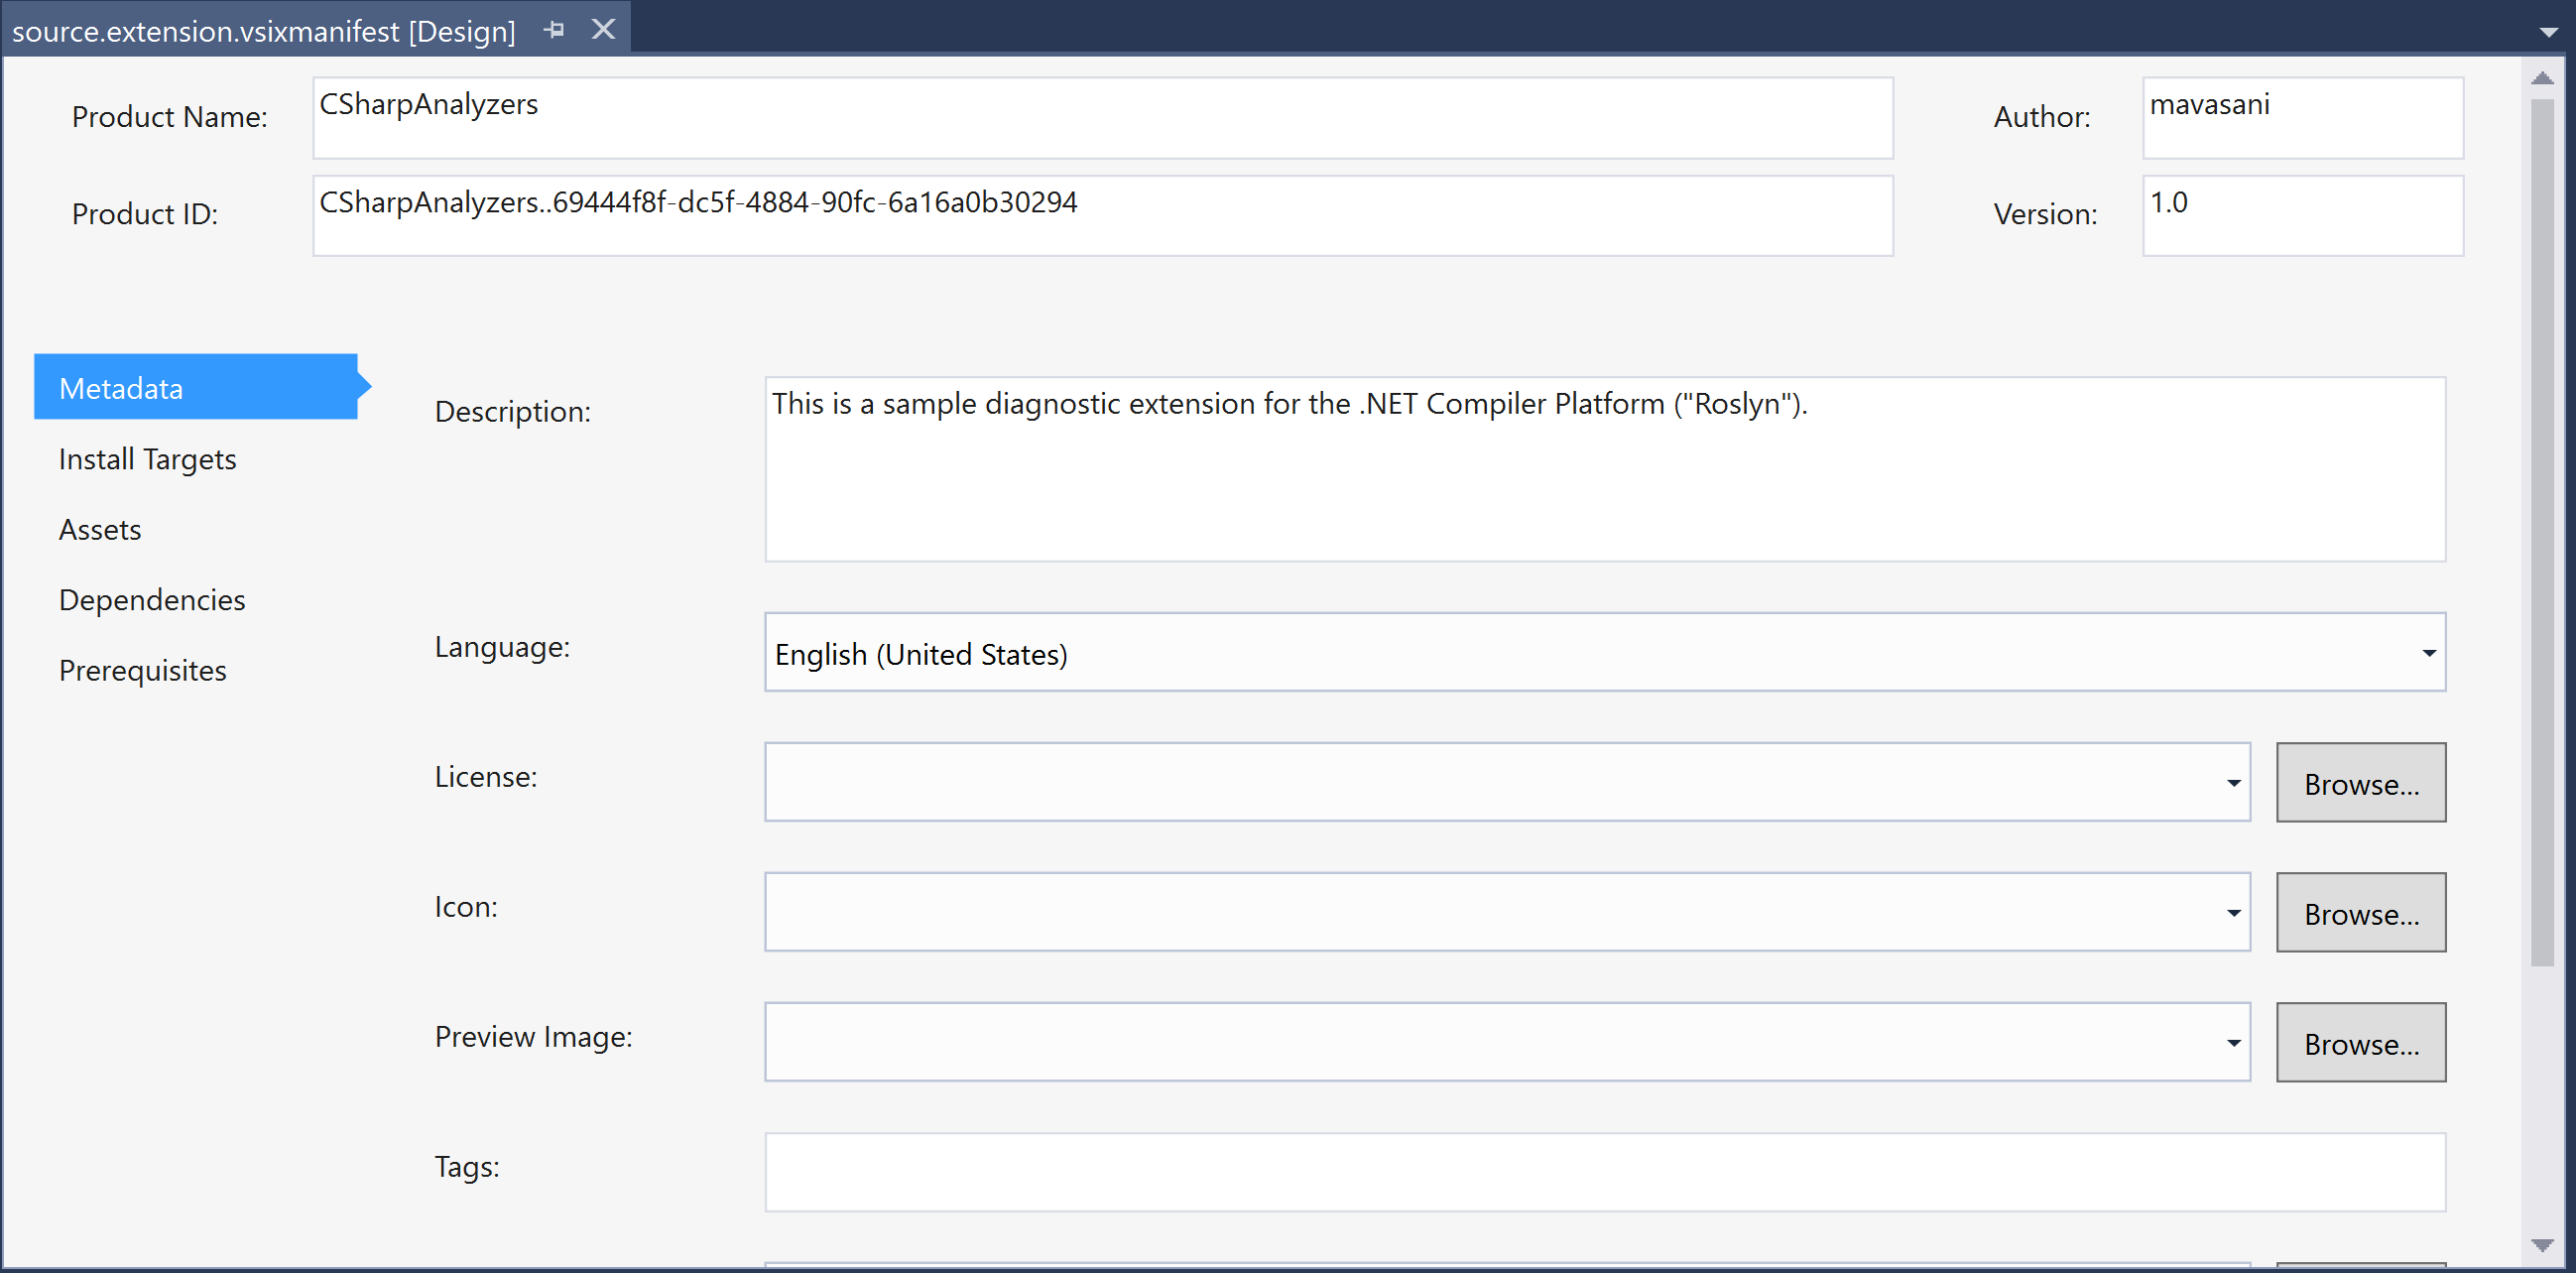
CSharpAnalyzers.Vsixproject (<%SolutionFolder%\CSharpAnalyzers.Vsix\bin\debug) in Windows Explorer and verify that VSIX for the analyzer named,CSharpAnalyzers.Vsix.vsix, is present in the folder. - Double-click on the
source.extension.vsixmanifestfile in theCSharpAnalyzers.Vsixproject in theSolution Explorer to view and configure the properties of the VSIX package.
- Rebuild the VSIX project to regerate the VSIX.
- Publish it to the Visual Studio Extension Gallery by following the steps listed here: https://msdn.microsoft.com/en-us/library/ff728613.aspx.