


 Download code from GitHub
Our society is more technologically advanced than ever. Artificial Intelligence (AI) technology is already spreading throughout the world, replicating humankind. The intention of creating machines that could emulate aspects of human intelligence such as reasoning, learning, and problem solving gave birth to the development of AI technology. AI truly rivals human nature. In other words, AI makes a machine think and behave like a human. An example that can best demonstrate the power of this technology would be the tag suggestions or face-recognition feature of Facebook. Looking at the tremendous impact of this technology on today's world, AI will definitely become one of the greatest technologies out there in the coming years.
We are going to be experimenting with a project based on AI technology, exploring classification using machine learning algorithms along with the Python programming language. We will also explore a few examples for a better understanding.
In this chapter, we are going to explore the following interesting topics:
- An overview of the classification technique
- The Python scikit library
AI provides us with various classification techniques, but machine learning classification would be the best to start with as it is the most common and easiest classification to understand for the beginner. In our daily life, our eyes captures millions of pictures: be they in a book, on a particular screen, or maybe something that you caught in your surroundings. These images captured by our eyes help us to recognize and classify objects. Our application is based on the same logic.
Here, we are creating an application that will identify images using machine learning algorithms. Imagine that we have images of both apples and oranges, looking at which our application would help identify whether the image is of an apple or an orange. This type of classification can be termed as binary classification, which means classifying the objects of a given set into two groups, but techniques do exist for multiclass classification as well. We would require a large number of images of apples and oranges, and a machine learning algorithm that would be set in such a way that the application would be able to classify both image types. In other words, we make these algorithms learn the difference between the two objects to help classify all the examples correctly. This is known as supervised learning.
Now let's compare supervised learning with unsupervised learning. Let's assume that we are not aware of the actual data labels (which means we do not know whether the images are examples of apples or oranges). In such cases, classification won't be of much help. The clustering method can always ease such scenarios. The result would be a model that can be deployed in an application, and it would function as seen in the following diagram. The application would memorize facts about the distinction between apples and oranges and recognize actual images using a machine learning algorithm. If we took a new input, the model would tell us about its decision as to whether the input is an apple or orange. In this example, the application that we created is able to identify an image of an apple with a 75% degree of confidence:
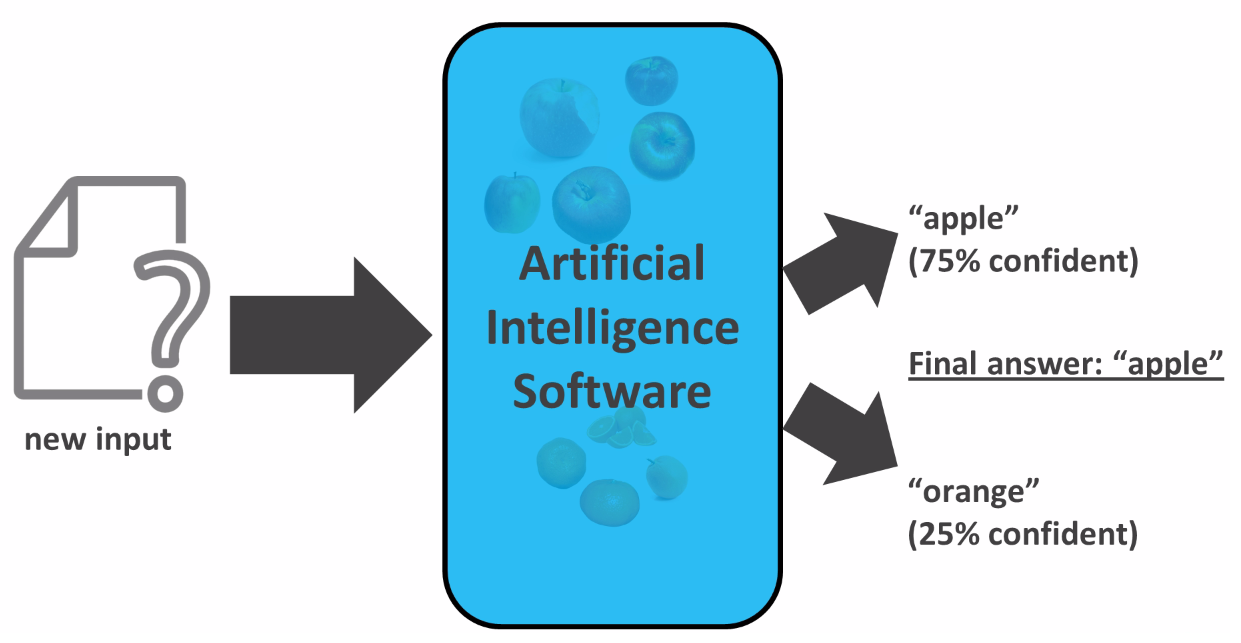
Sometimes, we want to know the level of confidence, and other times we just want the final answer, that is, the choice in which the model has the most confidence.
We can evaluate how well the model is working by measuring its accuracy. Accuracy would be defined as the percentage of cases that are classified correctly. We can analyze the mistakes made by the model, or its level of confusion, using a confusion matrix. The confusion matrix refers to the confusion in the model, but these confusion matrices can become a little difficult to understand when they become very large. Let's take a look at the following binary classification example, which shows the number of times that the model has made the correct predictions of the object:
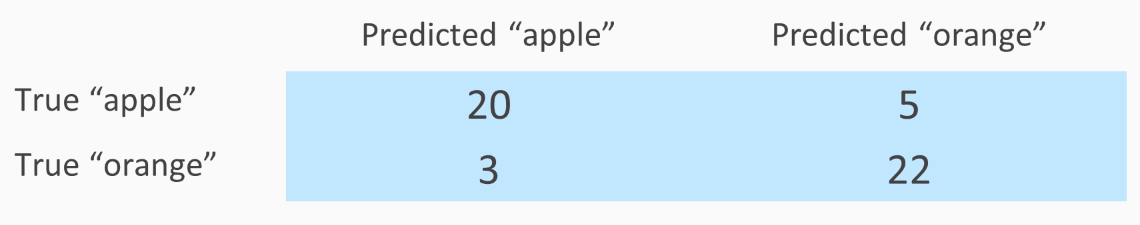
In the preceding table, the rows of True apple and True orange refers to cases where the object was actually an apple or actually an orange. The columns refer to the prediction made by the model. We see that in our example, there are 20 apples that were predicted correctly, while there were 5 apples that were wrongly identified as oranges.
Ideally, a confusion matrix should have all zeros, except for the diagonal. Here we can calculate the accuracy by adding the figures diagonally, so that these are all the correctly classified examples, and dividing that sum by the sum of all the numbers in the matrix:

Here we got the accuracy as 84%. To know more about confusion matrices, let's go through another example, which involves three classes, as seen in the following diagram:
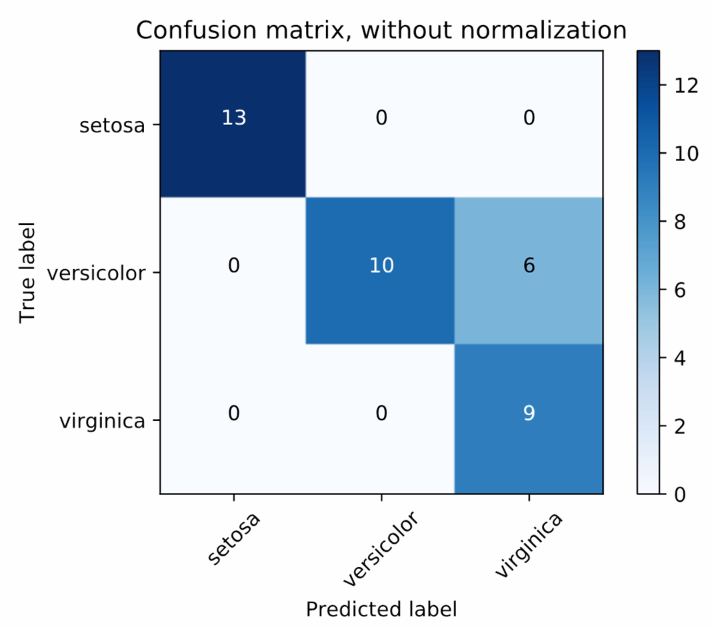
Source: scikit-learn docs
There are three different species of iris flowers. The matrix gives raw accounts of correct and incorrect predictions. So, setosa was correctly predicted 13 times out of all the examples of setosa images from the dataset. On the other hand, versicolor was predicted correctly on 10 occasions, and there were 6 occasions where versicolor was predicted as virginica. Now let's normalize our confusion matrix and show the percentage of the cases that predicted image corrected or incorrectly. In our example we saw that the setosa species was predicted correctly throughout:
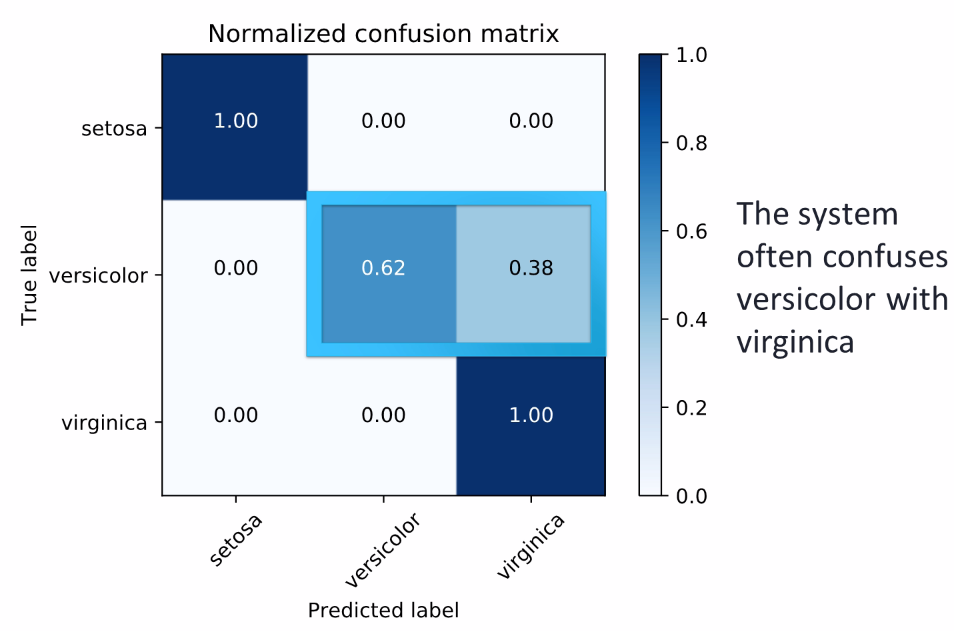
Source: scikit-learn docs
During evaluation of the confusion matrix, we also saw that the system got confused between two species: versicolor and virginica. This also gives us the conclusion that the system is not able to identify species of virginica all the time.
For further instances, we need to be more aware that we cannot have really high accuracy since the system will be trained and tested on the same data. This will lead to memorizing the training set and overfitting of the model. Therefore, we should try to split the data into training and testing sets, first in either 90/10% or 80/20%. Then we should use the training set for developing the model and the test set for performing and calculating the accuracy of the confusion matrix.
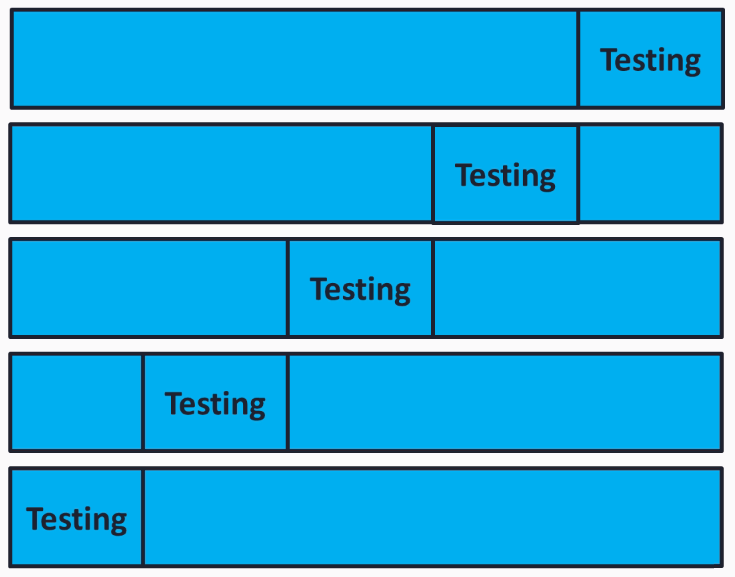
We need to be careful not to choose a really good testing set or a really bad testing set to get the accuracy. Hence to be sure we use a validation known as K-fold cross validation. To understand it a bit better, imagine 5-fold cross validation, where we move the testing set by 20 since there are 5 rows. Then we move the remaining set with the dataset and find the average of all the folds:
Quite confusing, right? But scikit-learn has built-in support for cross validation. This feature will be a good way to make sure that we are not overfitting our model and we are not running our model on a bad testing set.
In this section, we will be using decision trees and student performance data to predict whether a child will do well in school. We will use the previous techniques with some scikit-learn code. Before starting with the prediction, let's just learn a bit about what decision trees are.
Decision trees are one of the simplest techniques for classification. They can be compared with a game of 20 questions, where each node in the tree is either a leaf node or a question node. Consider the case of Titanic survivability, which was built from a dataset that includes data on the survival outcome of each passenger of the Titanic.
Consider our first node as a question: Is the passenger a male? If not, then the passenger most likely survived. Otherwise, we would have another question to ask about the male passengers: Was the male over the age of 9.5? (where 9.5 was chosen by the decision tree learning procedure as an ideal split of the data). If the answer is Yes, then the passenger most likely did not survive. If the answer is No, then it will raise another question: Is the passenger a sibling? The following diagram will give you a brief explanation:
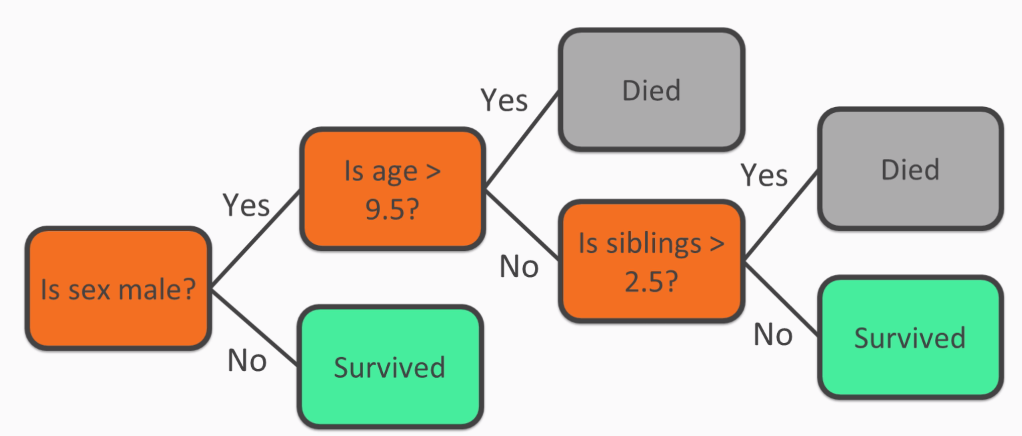
Understanding the decision trees does not require you to be an expert in the decision tree learning process. As seen in the previous diagram, the process makes understanding data very simple. Not all machine learning models are as easy to understand as decision trees.
Let us now dive deep into decision tree by knowing more about decision tree learning process. Considering the same titanic dataset we used earlier, we will find the best attribute to split on according to information gain, which is also known as entropy:
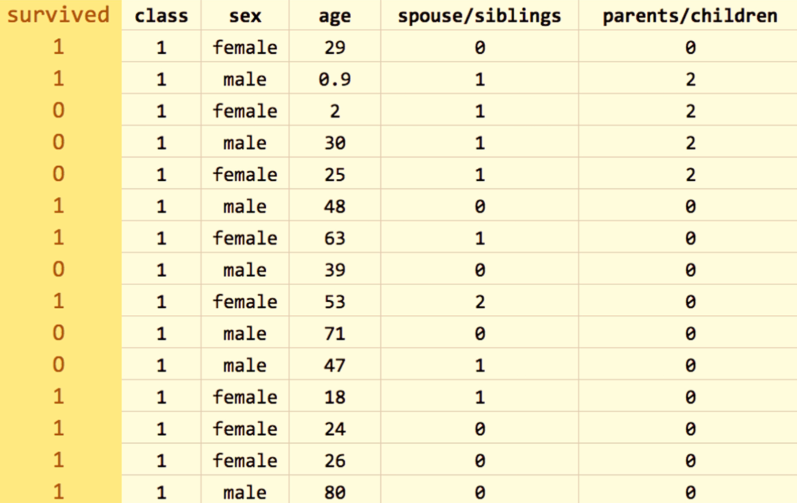
Information gain is highest only when the outcome is more predictable after knowing the value in a certain column. In other words, if we know whether the passenger is male or female, we will know whether he or she survived, hence the information gain is highest for the sex column. We do not consider age column best for our first split since we do not know much about the passengers ages, and is not the best first split because we will know less about the outcome if all we know is a passenger's age.
After splitting on the sex column according to the information gain, what we have now is female and male subsets, as seen in the following screenshot:
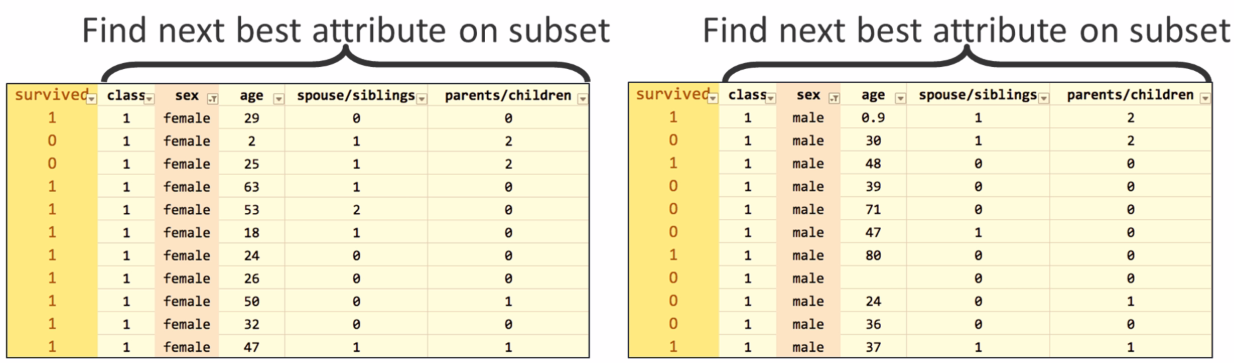
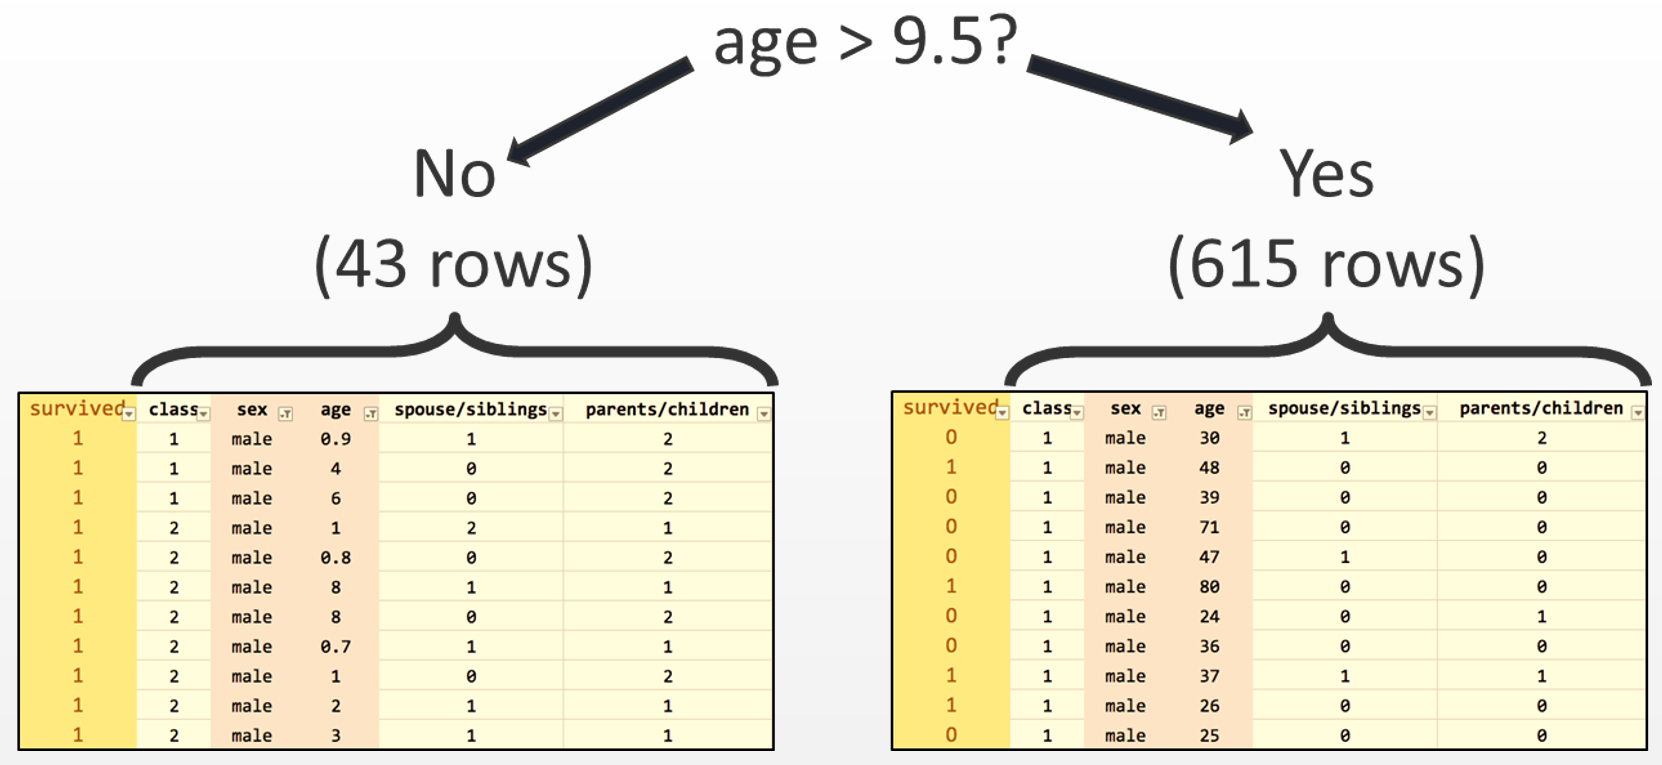
After the split, we have one internode and one question node, as seen in the previous screenshot, and two paths that can be taken depending on the answer to the question. Now we need to find the best attribute again in both of the subsets. The left subset, in which all passengers are female, does not have a good attribute to split on because many passengers survived. Hence, the left subset just turns into a leaf node that predicts survival. On the right-hand side, the age attribute is chosen as the best split, considering the value 9.5 years of age as the split. We gain two more subsets: age greater than 9.5 and age lower than 9.5:
Repeat the process of splitting the data into two new subsets until there are no good splits, or no remaining attributes, and leaf nodes are formed instead of question nodes. Before we start with our prediction model, let us know a little more about the scikit-learn package.
In this section, we will be learn how to create code using the scikit-learn package to build and test decision trees. Scikit-learn contains many simple sets of functions. In fact, except for the second line of code that you can see in the following screenshot, which is specifically about decision trees, we will use the same functions for other classifiers as well, such as random forests:
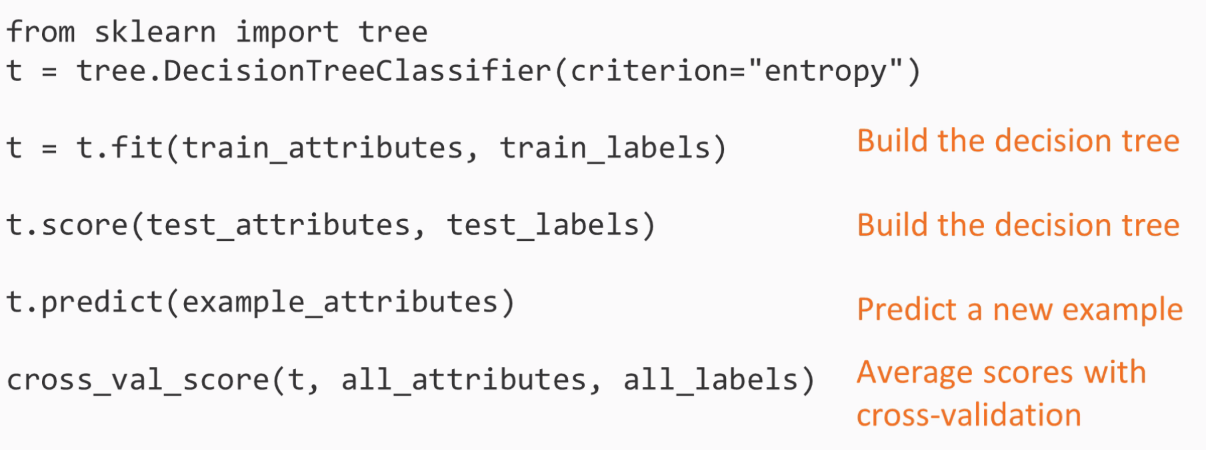
Before we jump further into technical part, let's try to understand what the lines of code mean. The first two lines of code are used to set a decision tree, but we can consider this as not yet built as we have not pointed the tree to any trained set. The third line builds the tree using the fit function. Next, we score a list of examples and obtain an accuracy number. These two lines of code will be used to build the decision tree. After which, we predict function with a single example, which means we will take a row of data to train the model and predict the output with the survived column. Finally, we runs cross-validation, splitting the data and building an entry for each training split and evaluating the tree for each testing split. On running these code the result we have are the scores and the we average the scores.
Here you will have a question: When should we use decision trees? The answer to this can be quite simple as decision trees are simple and easy to interpret and require little data preparation, though you cannot consider them as the most accurate techniques. You can show the result of a decision tree to any subject matter expert, such as a Titanic historian (for our example). Even experts who know very little about machine learning would presumably be able to follow the tree's questions and gauge whether the tree is accurate.
Decision trees can perform better when the data has few attributes, but may perform poorly when the data has many attributes. This is because the tree may grow too large to be understandable and could easily overfit the training data by introducing branches that are too specific to the training data and don't really bear any relation to the test data created, this can reduce the chance of getting an accurate result. As, by now, you are aware of the basics of the decision tree, we are now ready to achieve our goal of creating a prediction model using student performance data.
In this section, we're going to use decision trees to predict student performance using the students, past performance data. We'll use the student performance dataset, which is available on the UC Irvine machine learning repository at https://archive.ics.uci.edu/ml/datasets/student+performance. Our final goal is to predict whether the student has passed or failed. The dataset contains the data of about 649 students, with and 30 attributes for each student. The attributes formed are mixed categorically – word and phrase, and numeric attributes. These mixed attributes cause a small problem that needs to be fixed. We will need to convert those word and phrase attributes into numbers.
The following screenshot shows the first half of the attributes from the data:
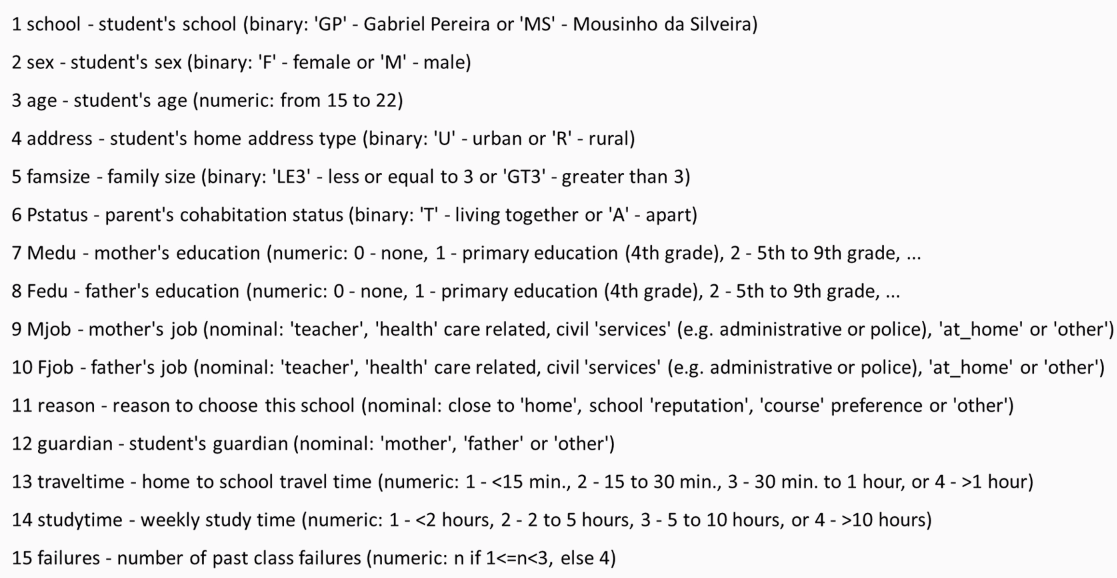
You must have noticed how some of the attributes are categorical, such as the name of the school; sex; Mjob, which is the mother's occupation; Fjob, which is the father's occupation; reason; and guardian. Others, such as age and traveltime, are numeric. The following screenshot shows the second half of the attributes from the data:
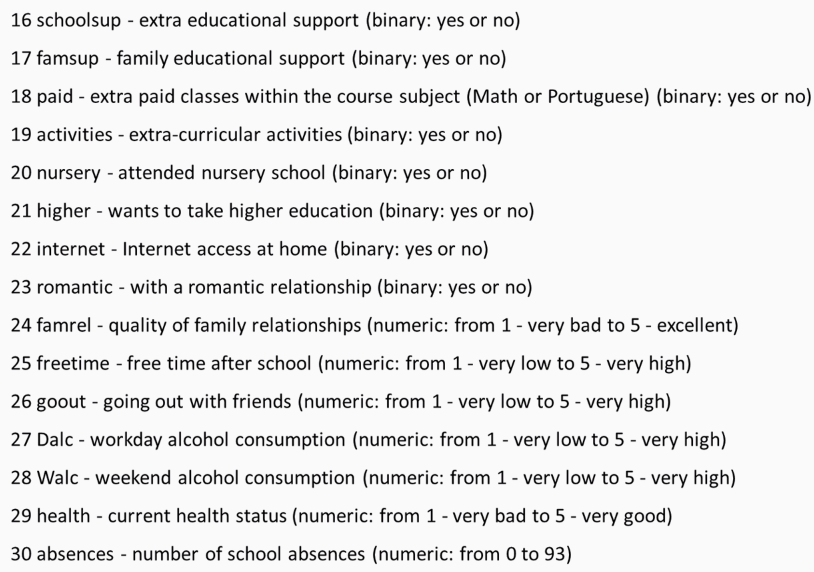
It is clear that some of the attributes are better predictors, such as absences and the number of past failures, while others attributes are probably less predictive, such as whether or not the student is in a romantic relationship or whether the student's guardian is the mother, father, or someone else. The decision tree will attempt to identify the most important or predictive attributes using this information gain provided. We'll be able to look at the resulting tree and identify the most predictive attributes because the most predictive attributes will be the earliest questions.
The original dataset had three test scores: G1, G2, and G3. Where G1 would be first grade, G2 being the second grade, and G3 being the final grade. We will simplify the problem by just providing pass or fail. This can be done by adding these three scores and checking whether the sum is sufficiently large enough which is 35. That brings us to about a 50% split of students passing and failing, giving us a balanced dataset. Now let's look at the code:
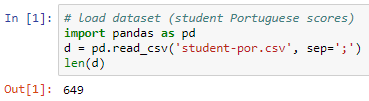
We import the dataset (student-por.csv), which comes with semicolons instead of commas; hence, we mention the separators as semicolons. To cross verify, we will find the number of rows in the dataset. Using the length variable, we can see that there are 649 rows.
Next we add columns for pass and fail. The data in these columns would contain 1 or 0, where 1 means pass and 0 means fail. We are going to do that by computing with every row what the sum of the test scores would be. This will be calculated as if the sum of three score is greater than or equal to 35, 1 is given to the student and failing to that rule 0 is given to the student.
We need to apply this rule on every row of the dataset, and this will be done using the apply function, which is a feature of Pandas. Here axis=1 means use apply per row and axis=0 would mean apply per column. The next line means that a variable needs to be dropped: either G1, G2, G3. The following screenshot of the code will provide you with an idea of what we just learned:

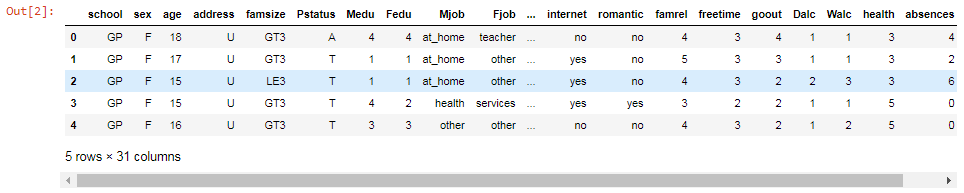
The following screenshot shows the first 5 rows of the dataset and 31 columns. There are 31 columns because we have all the attributes plus our pass and fail columns:
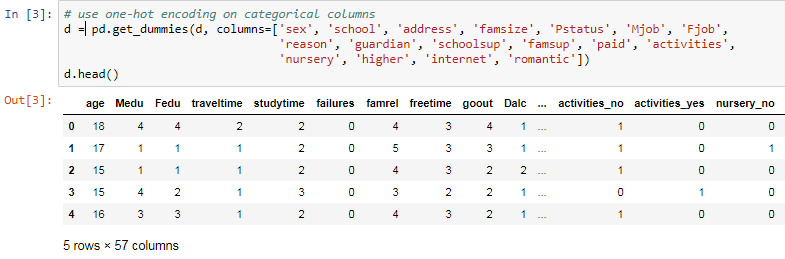
As mentioned before, some of these columns are words or phrases, such as Mjob, Fjob, internet, and romantic. These columns need to be converted into numbers, which can be done using the get_dummies function, which is a Pandas feature, and we need to mention which columns are the ones that we want to turn into numeric form.
In the case of Mjob, for example, the function it is going to look at all the different possible answers or the values in that column and it's going to give each value a column name. These columns will receive names such as rename the columns to Mjobat_home, Mjobhealth, or Mjob. These new columns, for example, the Mjob at_home column will have value 1 and the rest will have 0. This means only one of the new columns generated will have one.
This is know as one-hot encoding. The reason this name was given is for example, imagine some wires going into a circuit. Suppose in the circuit there are five wires, and you want use one-hot encoding method, you need to activate only one of these wires while keeping the rest of wires off.
On performing get_dummies function on our dataset, You can notice for example activities_no and activities_yes columns. The originally associated columns that said no had 1 as value under activies_no column followed by 0. The same as for activities_yes had yes it would have a value 0 followed by 1 for others. This led to creation of many more new columns around 57 in total but this made our dataset full of numeric data. The following screenshot shows the columns activities_yes and activities_no columns:
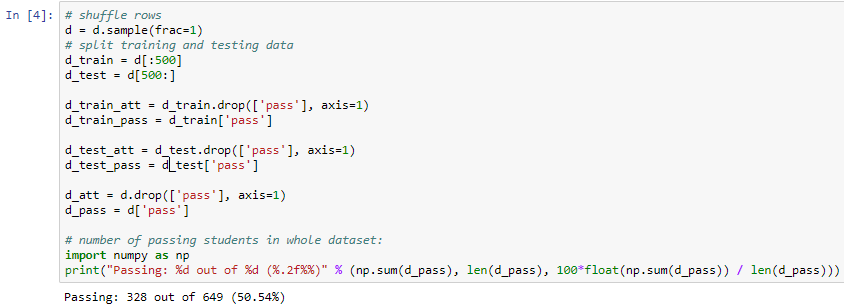
Here we need to shuffle the rows and produce a training set with first 500 rows and rest 149 rows for test set and then we just need to get attributes form the training set which means we will get rid of the pass column and save the pass column separately. The same is repeated for the testing set. We will apply the attributes to the entire dataset and save the pass column separately for the entire dataset.
Now we will find how many passed and failed from the entire dataset. This can be done by computing the percentage number of passed and failed which will give us a result of 328 out of 649. This being the pass percentage which is roughly around 50% of the dataset. This constitutes a well-balanced dataset:
Next, we start building the decision tree using the DecisionTreeClassifier function from the scikit-learn package, which is a class capable of performing multi-class classification on a dataset. Here we will use the entropy or information gain metric to decide when to split. We will split at a depth of five questions, by using max_depth=5 as an initial tree depth to get a feel for how the tree is fitting the data:
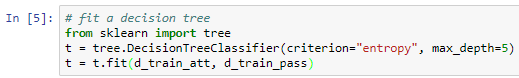
To get an overview of our dataset, we need to create a visual representation of the tree. This can be achieved by using one more function of the scikit-learn package: expoert_graphviz. The following screenshot shows the representation of the tree in a Jupyter Notebook:
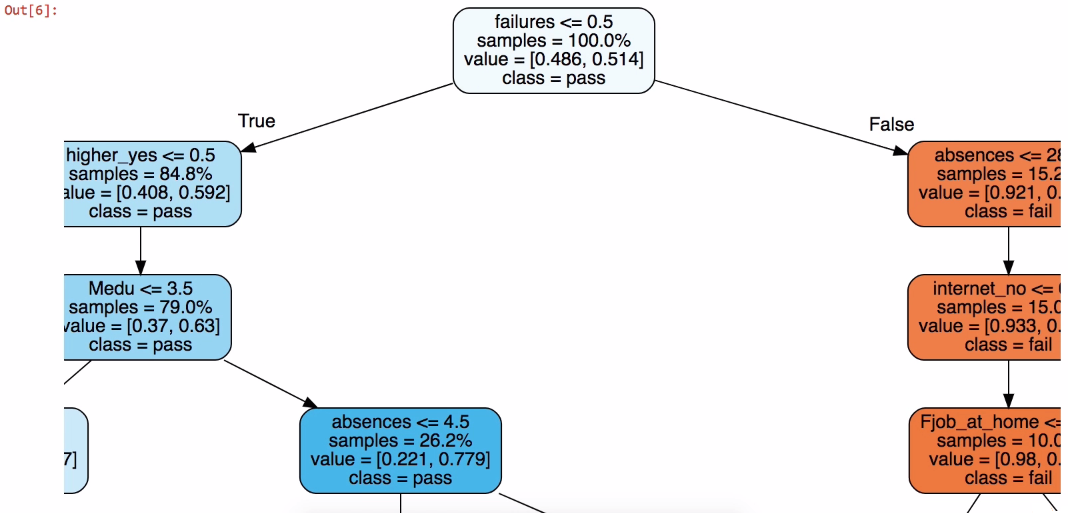
This is for representation, more can be seen on scrolling in Jupyter output
It is pretty much easy to understand the previous representation that the dataset is divided into two parts. Let's try to interpret the tree from the top. In this case if failure is greater than or equal to 0.5, that means it is true and it placed on left-hand side of the tree. Consider tree is always true on left side and false on right side, which means there are no prior failures. In the representation we can see left side of the tree is mostly in blue which means it is predicting a pass even though there are few questions as compared to the failure maximum of 5 questions. The tree is o n right side if failure is less than 0.5, this makes the student fail, which means the first question is false. Prediction is failure if in orange color but as it proceeds further to more questions since we have used max_depth = 5.
The following code block shows a method to export the visual representation which by clicking on Export and save to PDF or any format if you want to visualize later:

Next we check the score of the tree using the testing set that we created earlier:
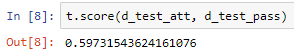
The result we had was approximately 60%. Now let's cross verify the result to be assured that the dataset is trained perfectly:
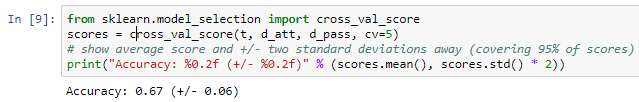
Performing cross-validation on the entire dataset which will split the data on a of 20/80 basis, where 20% is the on testing set and 80% is on the training set. The average result is 67%. This shows that we have a well-balanced dataset. Here we have various choices to make regarding max_depth:
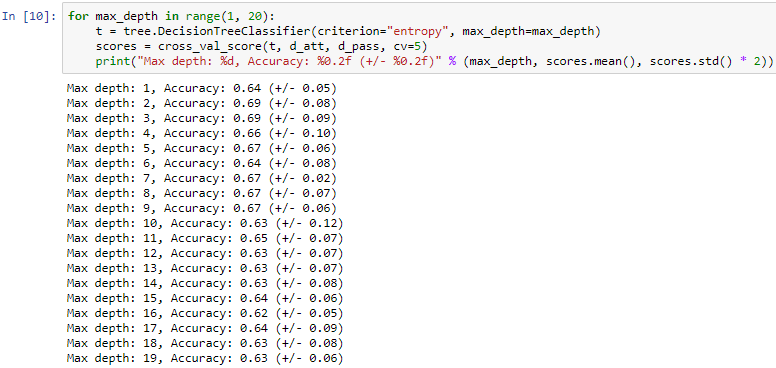
We use various max_depth values from 1 to 20, Considering we make a tree with one question or with 20 questions having depth value of 20 which will give us questions more than 20 which is you will have to go 20 steps down to reach a leaf node. Here we again perform cross- validation and save and print our answer. This will give different accuracy and calculations. On analyzing it was found that on have depth of 2 and 3 the accuracy is the best which was compared accuracy from the average we found earlier.
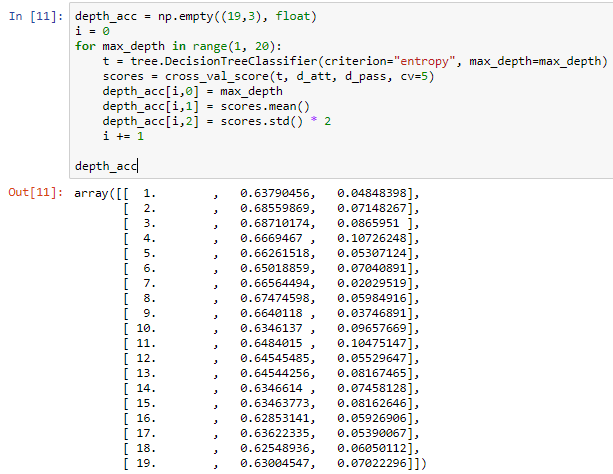
The following screenshot shows the data that we will be using to the create graph:
The error bars shown in the following screenshot are the standard deviations in the score, which concludes that a depth of 2 or 3 is ideal for this dataset, and that our assumption of 5 was incorrect:
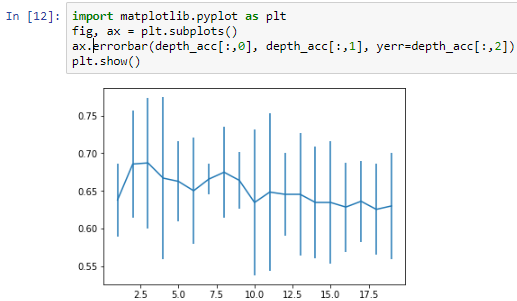
More depth doesn't give any more power, and just having one question, which would be did you fail previously?, isn't going to provide you with the same amount of information as two or three questions would.
Our model shows that having more depth does not necessarily help, nor does having a single question of did you fail previously? provide us with the same amount of information as two or three questions would give us.
In this chapter we learned about classification and techniques for evaluation, and learned in depth about decision trees. We also created a model to predict student performance.
In the next chapter, we will learn more about random forests and use machine learning and random forests to predict bird species.