


Analytics, predictive analytics, and data visualization are trendy topics today. The reasons are:
Today a lot of internal and external data is available
Technology to use this data has evolved a lot
It is commonly accepted that there is a lot of value that can be extracted from data
As in many trendy topics, there is a lot of confusion around it. In this chapter, we will cover the following concepts:
Introducing the key concepts of the book and tools we're going to use
Defining analytics, predictive analytics, and data visualization
Explaining the purpose of this book and the methodology we'll follow
Covering the installation of the environment we'll use to create examples of applications in each chapter
After this chapter, we'll learn how to use our data to make predictions that will add value to our organizations. Before starting a data project, you always need to understand how your project will add value to the organization. In an analytics project, the two main sources of value are cost reduction and revenue increase. When you're working on a fraud detection project, your objective is to reduce fraud; this will lead into a cost reduction that will improve the margin of the organization. Finally, to understand the value of your data solution, you need to evaluate the cost of your solution. The real value added to an organization is the difference between the provided value and the total cost.
Working with data to create predictive solutions sounds very glamorous, but before that we'll learn how to use Rattle to load data, to avoid some problems related to the quality of the data, and to explore it. Rattle is a tool for statisticians, and, sometimes, we need a tool that provides us with a business approach to data exploration. We'll learn how to use Qlik Sense Desktop to do this.
After learning how to explore and understand data, we'll now learn how to create predictive systems. We'll divide these systems into unsupervised learning methods and supervised learning methods. We'll explain the difference later in this book.
To achieve a better understanding, in this book we'll create three different solutions using the most common predictive techniques: Clustering, Decision Trees, and Linear Regression.
To present data to the user, we need to create an application that helps the user to understand the data and take decisions; for this reason we'll look at the basics of data visualization. Data Visualization, Predictive Analytics and most of the topics of this book are huge knowledge areas. In this book we'll introduce you to these topics and at the end of each chapter you will find a section called Further learning where you will find references to continue learning.
In January 2006, Thomas H. Davenport, a well-known American academic author, published an article in Harvard Business Review called Competing on Analytics. In this article, the author explains the need for analytics in this way:
"Organizations are competing on analytics not just because they can—business today is awash in data and data crunchers—but also because they should. At a time when firms in many industries offer similar products and use comparable technologies, business processes are among the last remaining points of differentiation. And analytics competitors wring every last drop of value from those processes."
After this article, companies in different industries started to learn how to use traditional and new data sources to gain competitive advantages; but what is analytics?
Today, the term analytics is used to describe different techniques and methods that extract new knowledge from data and communicate it. The term comprises statistics, data mining, machine learning, operations research, data visualization, and many other areas.
An important point is that analytics will not provide any new value or advantage by itself; it will help people to take better decisions. Analytics is about replacing decisions based on feelings and intuition with decisions based on data and evidence.
Predictive analytics is a subset of analytics whose objective is to extract knowledge from data and use it to predict something. Eric Siegel in his book Predictive Analytics describes the term as:
"Technology that learns from experience (data) to predict the future behavior of individuals in order to drive better decisions."
Generally, in real life, an accurate prediction is not possible, but we can extract a lot of value from predictions with low accuracy. Think of an insurance company, they have a lot of claims to review, but have just a few people to do it. They know that some claims are fraudulent, but they don't have enough people and time to review all claims. They can randomly choose some claims or they can develop a system that selects the claims with a higher probability of fraud. If their system predictions are better than just guessing, they will improve their fraud detecting efforts and they will save a lot of money in fraudulent claims.
As we've seen, everything is about helping people to take better decisions; for this reason we've got to communicate the insights we've discovered from data in an easy to understand and intuitive way, especially when we deal with complex problems. Data visualization can help us to communicate our discoveries to our users. The term, data visualization, is used in many disciplines with many different meanings. We use this term to describe the visual representation of data; our main goal is to communicate information clearly and efficiently to business users.
In this introduction, we've used the term value many times and it's important to have an intuitive definition. We develop software solutions to obtain a business benefit; generally, we want to increase income or reduce cost. This business benefit has an economic value; the difference between this economic value and the cost of developing the solution is the value you will obtain.
Usually, a predictive analytics project follows some common steps that we call the predictive analytics process:
Problem definition: Before we start, we need to understand the business problem and the goals.
Extract and load data: An analytics application starts with raw data that is stored in a database, files, or other systems. We need to extract data from its original location and load it into our analytics tools.
Prepare data: Sometimes, the data needs transformation because of its format or because of poor quality.
Create a model: In this step, we will develop the predictive model.
Performance evaluation: After creating the model, we'll evaluate its performance.
Deploy the model and create a visual application: In the last step, we will deploy the predictive model and create the application for the business user.
The steps in this process don't have strict borders; sometimes, we go back and forth in the process.
This is not a technical guide about R and Qlik Sense integration, or a Rattle guide for software developers. This book is an introduction to the basic techniques of predictive analytics and data visualization. We've written this book for business analysts, and people with an IT background, but without analytics experience.
"Tell me and I forget, teach me and I may remember, involve me and I learn." | ||
| --Benjamin Franklin | ||
We believe that the best way to learn is by practicing, and for this reason this book is organized around examples, which you can do with a simple Windows computer. Don't be afraid, we will use two software tools, Rattle and Qlik Sense Desktop, in order to avoid complex code. To create the predictive analysis, we'll use Rattle and for data visualization, we'll use Qlik Sense Desktop.
There are two ways of using Rattle, or R, and Qlik Sense Desktop together. These are listed as follows:
In the first approach, it is possible to integrate Qlik Sense Desktop and R. The business users select some data. Qlik Sense Desktop sends this selected data to an R server, the server processes the data and performs a prediction. The R server returns the data to Qlik Sense Desktop, and this shows the data to the user. This model has a great advantage—the interactivity, but it also has a disadvantage; it requires additional software to integrate the two different environments.
The second approach is based on two steps. In the first step, the R environment loads the data, performs the prediction, and stores the original data with the prediction. In the second step, Qlik Sense Desktop loads the data and the prediction, and shows it to the business user. This second approach has a great advantage which is simplicity, but also has a disadvantage which is the lack of interactivity.
In this book, we'll use the second approach because in predictive analytics choosing the appropriate model is the key. For this reason we want to focus on introducing you to different models, avoiding the technical stuff of integration. We'll use Rattle and Qlik Sense Desktop in a two-step process. We'll load data in Rattle to enrich it with a predictive model and then load it in Qlik Sense Desktop to share it by creating data visualizations. This process is illustrated in the following diagram:

In this section, we will introduce the tools we'll use in this book: R, Rattle, and Qlik Sense Desktop.
R is a free programming language for statistics and graphics available under the terms of the Free Software Foundation's General Public License (GNU). The R language is widely accepted for statistical analysis and data mining. There is a big community of developers that develop new packages for R, such as Rattle.
R is a very powerful and flexible programming language, but to create predictive models with R you need to be a skilled programmer. For this reason, we will use Rattle.
Rattle is a Graphical User Interface (GUI) for data mining developed by Graham Williamson using R. Similar to R, Rattle is also licensed under the GNU. R and Rattle are the predictive analysis environments that we will be using in this book.
Using Rattle, we'll be able to load and prepare data, create a predictive model, and evaluate its performance without writing R code; Rattle will write the code for us.
In order to create a visual and intuitive application for the business user, we'll use Qlik Sense Desktop, the personal and free version of Qlik Sense. Qlik Sense is a self-service data visualization tool developed by Qlik.
We'll use Qlik Sense Desktop instead of Qlik Sense Enterprise because we want to build a free learning environment to develop the examples of this book. For the propose of this book, Qlik Sense Desktop and Qlik Sense are very similar. When you deploy your applications in Qlik Sense Enterprise, the platform provides you:
Data governance.
Security
Scalability
High availability
Qlik has two different tools for data analysis and data visualization: QlikView and Qlik Sense. Each tool is designed to solve a different problem:
With QlikView, developers have a powerful tool to create guided analytic applications
With Qlik Sense, business users can create their own analysis and visualizations with drag and drop simplicity
We will use Qlik Sense Desktop instead of QlikView because the book is written for business users and analysts, and Qlik Sense is designed to provide business users with the ability to create visualizations on their data.
Qlik Sense has two different editions:
Qlik Sense Enterprise, a sever based edition for use in organizations.
Qlik Sense Desktop, a desktop edition for personal use.
In this book we’ll use Qlik Sense Desktop to complete the examples. This edition is free for personal utilization.
R and Rattle can be installed on Windows, Mac OS, and Linux, but Qlik Sense Desktop can only be installed on a Windows machine. For this reason, we will use a Windows-based computer for this book. Qlik Sense Desktop and R load all data into memory; we suggest that you use a 64-bit computer instead of a 32-bit computer.
In order to install R, Rattle, and Qlik Sense Desktop, you'll need administration rights, and an Internet connection to download the software.
In the examples, we'll use Rattle and Qlik Sense Desktop, but, as we've explained, Rattle is an R package and we need to install R too. We will follow these steps:
Download and install R.
Download and install Rattle.
Download and install Qlik Sense Desktop.
These steps must be followed for installing R:
Go to the homepage of R Project for Statistical Computing at www.r-project.org.
In the navigation bar, click on Comprehensive R Archive Network (CRAN) and you will be redirected to a list of CRAN mirrors. Choose a download mirror that is the closest to your geographic location, as shown here:

You will reach a different page; choose Download R for Windows, and in the following page click on install R for the first time.
Finally, you will reach the download page. As of writing this book, the latest version for Windows was 3.1.2. Click on Download R 3.1.2 for Windows to download the installation program, as shown in this screenshot:

Run the installation program,
R-3.1.2-win.exe, to start the process. Depending on the level of security of your system, it will ask you for permission to execute the program and to make modifications on your system. You have to allow this to start the process.In the next step, you have to choose a language; choose English. For the rest of the installation process, leave the default options.
When the installation process finishes, you will have two new icons on your desktop—R i386 3.1.2 and R x64 3.1.2; use the first one if you are using a 32-bit computer and the second one if you are using a 64-bit computer:

The R Console is a window used to interact with R language; you can type commands and functions here, and you will see the results in the same window. We will not focus on R, so we'll only learn the commands needed to work with Rattle.
The following steps are needed to start and close R Console:
Double-click the R icon to start the R Console.
To exit the R Console, type
q()and press Enter, as shown here:
Rattle is an R package, which is a collection of functions and data someone else has developed, and we can use it in our programs. If you already have some hands-on experience with R, then this task should be a much lighter task.
Before starting with the installation, remember that you need an active Internet connection. The following are the steps to install Rattle:
We will install Rattle from R Console; to open it double-click on the R x64 3.1.1 desktop icon.
In R Console, type
install.packages("rattle")and press Enter. The R Console will show you a list of CRAN mirrors; choose a download mirror that is the closest to your geographic location and R will download the Rattle package, as shown here: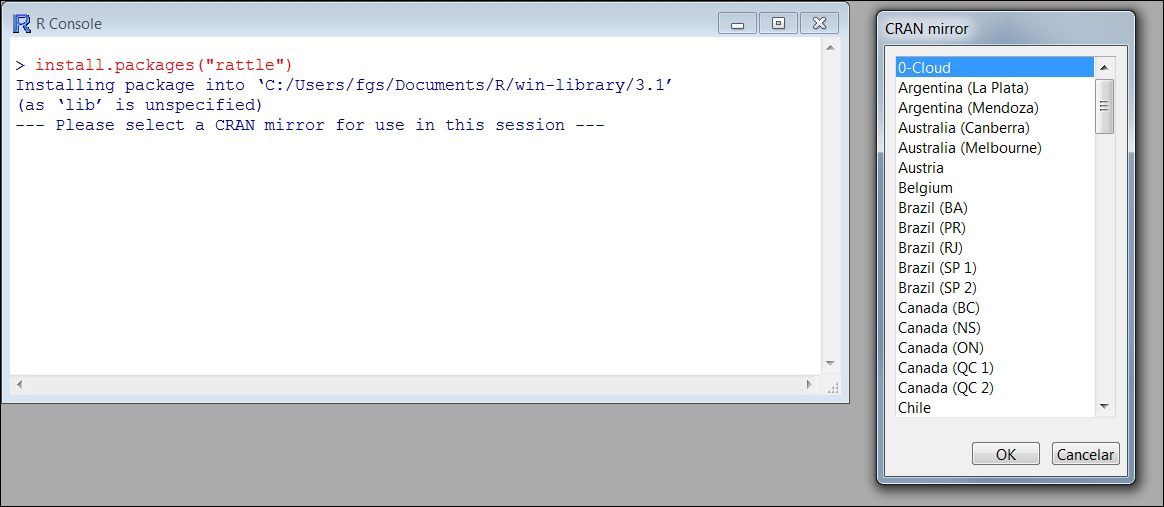
After you have downloaded it, type
library(rattle)and R will load the Rattle package into memory, and you will be able to use it. Use therattle()command to start Rattle:
To exit, click on the Quit icon from Rattle GUI and type
q()in the R Console:
Tip
If you are from a non-English speaking country, you've probably installed everything in English, but Rattle's texts appear in your own language. Rattle will work fine in your language, but this book is written in English and it will refer to Rattle's functions and menus using English names. If you prefer to execute Rattle in English, quit Rattle and type
Sys.setenv(LANGUAGE="en")in your R Console and start Rattle again.
In order to install Qlik Sense Desktop, you need a 64-bit computer with the following specifications:
Windows 7 or Windows 8.x
Administrator privileges
.NET Framework 4.0
4 GB of RAM memory
500 MB of disk space
Intel Core 2 Duo processor or higher
Probably, you are not sure if you have .NET Framework on your computer; don't worry if you don't have it, the installer will offer to install it.
The following steps are used to install Qlik Sense Desktop:
Go to the Qlik home page, http://www.qlik.com. Click on the Free Downloads link in the upper-right corner. The following page will open:

Click on the Get Qlik Sense Desktop button to download Qlik Sense Desktop.
When the download finishes, execute the installation program by double-clicking the file you've downloaded:

The installation process is very easy; you just need to click on INSTALL when Qlik Sense Desktop installer starts and accept the license agreement:

When the installer finishes, click on Finish to exit the installation program. You'll find a new Qlik Sense Desktop icon on your desktop.
In this section, we will get a first taste of Qlik Sense Desktop. We will open it and do a quick exploration. After installing it, Qlik Sense Desktop has three example applications Executive Dashboard, Helpdesk Management, and Sales Discovery. We will explore the Executive Dashboard application.
Follow these steps to explore Qlik Sense Desktop:
Open Qlik Sense Desktop by double-clicking the Qlik Sense Desktop icon on the desktop:

When Qlik Sense Desktop opens, click on the cross (highlighted in the following screenshot) in the central window to close the startup dialog:

Now, you are in the Qlik Sense Desktop hub, the main screen of Qlik Sense Desktop. From this screen, the user can open, access, and manage his applications. We've highlighted four different areas in the hub's screen:
In area 1, you can find the help section.
Area 2 is the main section of this screen. In this section, the users have their applications. As you already know, Qlik Sense Desktop comes with three demo applications.
In area 3, there is a button to create a new application and two buttons to manage the layout.
In area 4, you have a button to access QlikCloud and a search button, as shown here:

We'll explore an application. Click on the Executive Dashboard button to open it.
A Qlik Sense application is organized in different sheets, such as a spreadsheet. This application contains three sheets, and you can always create a new sheet by clicking in the Create new sheet button, which is visible in the following screenshot:

Click on the KPI Dashboard icon to open this sheet. This sheet shows three Key Performance Indicators (KPI)—Expenses, Revenue vs Last year, and Account Receivables. For each KPI, we see the current level, a distribution, and temporal evolution. At the left-hand side, there are three filters—Product, Segment, and Customer:

Using the button located in the top-right corner, you can toggle between the sheets. Go to the Sales Analysis sheet:

The Sales Analysis sheet has four filters in the top area: Segment, Region, Sales Rep Name, and Product Group:

Click on the Region filter and select Europe; the dashboard will react to show only the data related to Europe. Confirm your selection by clicking the highlighted tick icon:

Qlik Sense keeps your selection in the top-left side of the screen. You can delete these filters by clicking on the cross (highlighted in the following screenshot):

We'll come back to Qlik Sense in Chapter 4, Creating Your First Qlik Sense Application; now close the window to exit Qlik Sense Desktop.
In August 2006, after his famous article, Thomas H. Davenport and Jeanne G. Harris published a book about the same idea:
Competing on Analytics: The New Science of Winning, by Thomas H. Davenport and Jeanne G. Harris, Harvard Business School Press.
A good place to understand all the power of predictive analytics is the book by Eric Siegel. This book contains 147 examples of predictive analytics in its central pages:
Predictive Analytics: the power to predict who will click, buy, lie or die, Eric Siegel, John Wiley & Sons, Inc.
We will not cover R Language in this book. If you want to learn how to program in R, I recommend that you read the following book:
Statistical Analysis with R, John M. Quick, Packt Publishing.
We'll come back to Qlik Sense Desktop in Chapter 4, Creating Your First Qlik Sense Application. If you want to be more familiar with Qlik Sense, you can start here www.qlik.com/en-US/sense/gettingstarted.
In this chapter, we've introduced analytics as a process that starts with raw data and creates new knowledge to help people to take better decisions.
We also defined predictive analytics as a process that learns to create predictions from the data. Finally, we've defined data visualization as a technology that will help us to communicate data-based knowledge more efficiently.
After introducing the key concepts of the book, we've also described R, Rattle, and Qlik Sense, the tools we'll use to build the examples. And finally, we've installed the environment.
In Chapter 2, Handling Docker Containers, we'll explain how to load data into Rattle and how we can use Rattle to transform it.