


 Download code from GitHub
This is the third edition of this book! Splunk has continued to grow in popularity since our original publication and each new release of the product proves to be enthusiastically consumed by the industry. The content of each chapter within this edition has been reviewed and updated for Splunk version 7.0, with new sections added to cover several new features now available in version 7.0. In addition, we have two new chapters, one covering Splunk's latest machine learning toolkit (MLT) and another discussing practical proven-practice recommendations. So, even if you have an earlier edition of this book (thank you!), it's worthwhile picking up this edition.
Let's begin!
This chapter will walk you through the most common elements in the Splunk interface, and will touch upon concepts that are covered in greater detail in later chapters. You may want to dive right into them, but an overview of the user interface elements might save you some frustration later. We will cover the following topics in this chapter:
- Logging in and app selection
- A detailed explanation of the search interface widgets
- A quick overview of the admin interface
The Splunk GUI (Splunk is also accessible through its command-line interface (CLI) and REST API) is web-based, which means that no client needs to be installed. Newer browsers with fast JavaScript engines, such as Chrome, Firefox, and Safari, work better with the interface. As of Splunk Version 6.2.0 (and version 7.0 is no different), no browser extensions are required.
The default port (which can be changed) for a Splunk installation is still 8000. The address will look like http://mysplunkserver:8000 or http://mysplunkserver.mycompany.com:8000:

The Splunk interface
If you have installed Splunk on your local machine, the address can be some variant of http://localhost:8000, http://127.0.0.1:8000, http://machinename:8000, or http://machinename.local:8000.
Once you determine the address, the first page you will see is the login screen. The default username is admin with the password changeme. The first time you log in, you will be prompted to change the password for the admin user. It is a good idea to change this password to prevent unwanted changes to your deployment.
By default, accounts are configured and stored within Splunk. Authentication can be configured to use another system, for instance, Lightweight Directory Access Protocol (LDAP). By default, Splunk authenticates locally. If LDAP is set up, the order is as follows: LDAP / Local.
After logging in, the default app is the Launcher app (some refer to it as Home). This app is a launching pad for apps and tutorials.
Note
Note that with your first login, Splunk will present a popup displaying Help us improve Splunk software that will ask you permission (Splunk) to collect information about your Splunk usage. It is up to you how to respond.

In earlier versions of Splunk, the Welcome tab provided two important shortcuts, Add data and Launch search app. In version 6.2.0, the Home app was divided into distinct areas or panes that provided easy access to Explore Splunk Enterprise (Add Data, Splunk Apps, Splunk Docs, and Splunk Answers) as well as Apps (the app management page), Search & Reporting (the link to the Search app), and an area where you can set your default dashboard (choose a home dashboard).
In version 7.0, the main page has not been changed very much, although you may notice some difference in the graphics. But the general layout remains the same, with the same panes and access to the same functionalities.
We'll cover apps and dashboards in later chapters of this book:

The Explore Splunk Enterprise pane shows the following links:

Note
Note: for first-timers, when you first click on any of the following links, Splunk will ask whether you'd like to pause and view a tour based on the link you chose. Of course, you always have the opportunity to go back at any time to the Product Tours link to review a tour.
Add Data: This linksAdd Datato the Splunk page. This interface is a great start for getting local data flowing into Splunk (making it available to Splunk users). ThePreview datainterface takes an enormous amount of complexity out of configuring dates and line breaking. We won't go through those interfaces here, but we will go through the configuration files that these wizards produce in Chapter 11, Configuring Splunk.Splunk Apps: This allows you to find and install more apps from the Splunk Apps Marketplace (https://splunkbase.splunk.com). This marketplace is a useful resource where Splunk users and employees post Splunk apps, mostly free but some premium ones as well. Note that you will need to have a splunk.com user ID.Splunk Docs: This is one of your links to the wide amount of Splunk documentation available, specifically https://answers.splunk.com, to come on board with the Splunk community on Splunkbase (https://splunkbase.splunk.com/) and get the best out of your Splunk deployment. In addition, this is where you can access http://docs.splunk.com/Documentation/Splunk for the very latest updates to documentation on (almost) any version of Splunk.

The Apps section shows the apps that have GUI elements on your instance of Splunk. App is an overloaded term in Splunk. An app doesn't necessarily have a GUI; it is simply a collection of configurations wrapped into a directory structure that means something to Splunk. We will discuss apps in a more detailed manner in Chapter 8, Working with Apps.

Search & Reporting is the link to the Splunk Search & Reporting app:

Beneath the Search & Reporting link, Splunk provides an outline that, when you hover over it, displays a Find More Apps balloon tip. Clicking on the link opens the (same) Browse more apps page as the Splunk Apps link mentioned earlier:

Choose a home dashboard provides an intuitive way to select an existing (simple XML) dashboard and set it as part of your Splunk Welcome or Home page. This sets you at a familiar starting point each time you enter Splunk. The following screenshot displays the Choose Default Dashboard dialog:

Once you select (from the drop-down list) an existing dashboard, it will be a part of your welcome screen every time you log in to Splunk—until you change it. There are no dashboards installed by default after installing Splunk, except the Search & Reporting app. Once you have created additional dashboards, they can be selected as the default.
The bar across the top of the window contains information about where you are as well as quick links to preferences, other apps, and administration.
The current app is specified in the upper-left corner. The following screenshot shows the upper-left Splunk bar when using the Search & Reporting app:

Clicking on the text takes you to the default page for that app. In most apps, the text next to the logo is simply changed, but the whole block can be customized with logos and alternate text by modifying the app's CSS. We will cover this in Chapter 8, Working with Apps:

The upper-right corner of the window, as seen in the previous screenshot, contains action links that are almost always available:
The name of the user who is currently logged in appears first. In this case, the user is
Administrator. Previously, clicking on the username allowed you to selectEdit Account(which would take you to theYour accountpage) orLogout(of Splunk). In version 7.0, it's a bit different. The first option is now listed asAccount Settings, which opens a settings page similar to prior versions (below is the 7.0 page).Logoutis the other option, and, like prior versions, it ends the session and forces the user to log in again.
The following screenshot shows what the your account page looks like:
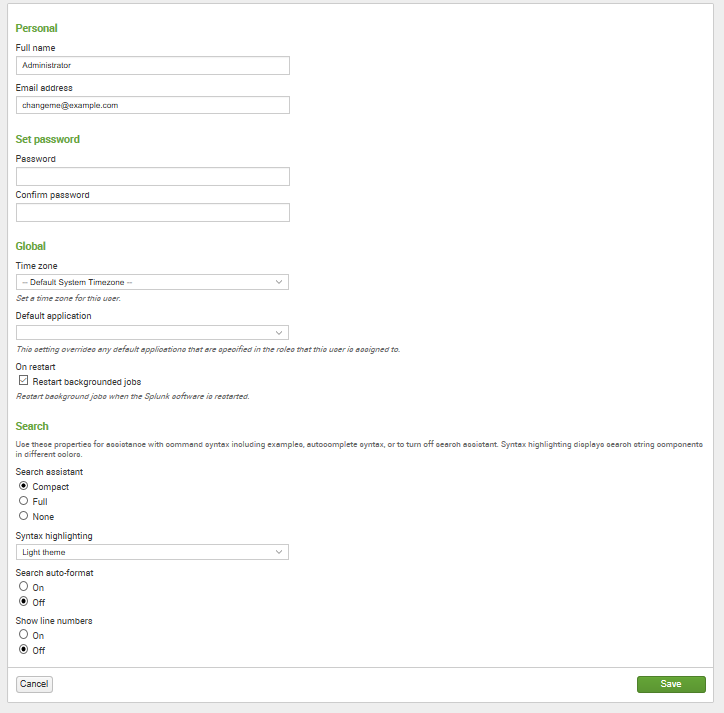
This form presents the global preferences that a user is allowed to change. Other settings that affect users are configured through permissions on objects and settings on roles. (Note that preferences can also be configured using the command-line interface or by modifying specific Splunk configuration files.) Preferences include the following:
Full nameandEmail addressare stored for the administrator's convenience.Set passwordallows you to change your password. This is relevant only if Splunk is configured to use internal authentication. For instance, if the system is configured to use Windows Active Directory via LDAP (a very common configuration), users must change their password in Windows.Global/Time zonecan be changed for the logged-in user.
Note
Setting the time zone only affects the time zone used to display the data. It is very important that the date is parsed properly when events are indexed. We will discuss this in detail in >Chapter 2, Understanding Search.
Default applicationcontrols where you first land after login. Most users will want to change this to search.Restart backgrounded jobscontrols whether unfinished queries should run again if Splunk is restarted.Search/Search assistant/Syntax highlighting/auto-format and Show line numbers: these properties are used for assistance with command syntax, including examples, autocomplete syntax, or to turn off search assistance. Syntax highlighting displays search string components in different colors.Messagesallows you to view any system-level error messages you may have pending. When there is a new message for you to review, a notification displays as a count next to theMessagesmenu. You can click on theXto remove a message.- The
Settingslink presents the user with the configuration pages for all SplunkKnowledgeobjects,Distributed environment,SystemandLicensing,Data, andUsers and Authenticationsettings. For any option that you are unable to see, you do not have the permissions to view or edit it:
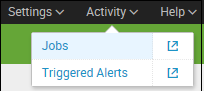
- The
Activitymenu lists shortcuts to SplunkJobs,Triggered Alerts, and (in previous versionsSystem Activity)views. - You can click on
Jobs(to open the search jobs manager window, where you can view and manage currently running searches) orTriggered Alerts(to view scheduled alerts that are triggered).
Note
Note: In version 7.0, System Activity (to see dashboards about user activity and status of the system) has been removed from under Activity. You can actually access all of this detailed information in Search!

Findcan be used to search for objects within your Splunk Enterprise instance. These saved objects includeReports,Dashboards,Alerts, and so on. Errors can be searched with theSearch & Reportingapp by clicking onOpen errorin search.
The Search & Reporting app (or just the search app) is where most actions in Splunk start. This app is a dashboard where you will begin your searching.
If you want to follow the examples that appear in the next few chapters, install the ImplementingSplunkDataGenerator demo app by following these steps:
- Download
ImplementingSplunkDataGenerator.tar.gzfrom the code bundle available at http://www.packtpub.com/support - Choose
Manage apps...from theAppsmenu - Click on the button labeled
Install appfrom the file - Click on
Choose File, select the file, and then click onUpload
This data generator app will produce about 16 megabytes of output per day. The app can be disabled so that it stops producing data by using Manage apps... under the App menu.
Within the Search & Reporting app, the user is presented with the Summary view, which contains information about the data that the user searches by default. This is an important distinction; in a mature Splunk installation, not all users will always search all data by default. But if this is your first trip into Search & Reporting, you'll see the following:

From the screen depicted in the previous screenshot, you can access the Splunk documentation related to What to Search and How to Search. Once you have at least some data indexed (a topic we'll discuss later), Splunk will provide some statistics on the available data under What to Search.
Note
Remember that this reflects only the indexes that this particular user searches by default; there are other events that are indexed by Splunk, including events that Splunk indexes about itself. We will discuss indexes in Chapter 9, Building Advanced Dashboards.
What to Search is shown in the following screenshot:

In previous versions of Splunk, panels such as the All indexed data panel provided statistics for a user's indexed data. Other panels gave a breakdown of data using three important pieces of metadata—Source, Sourcetype, and Hosts. In the current version, 7.0.0, you access this information by clicking on the button labeled Data Summary, which presents the following to the user:

This dialog splits the information into three tabs—Hosts, Sources and Sourcetypes:
- A host is a captured hostname for an event. The majority of cases, the host field is set to the name of the machine where the data originated. There are cases where this is not known, so the host can also be configured arbitrarily.
- A source in Splunk is a unique path or name. In a large installation, there may be thousands of machines submitting data, but all data on the same path across these machines counts as one source. When the data source is not a file, the value of the source can be arbitrary. For instance, the name of a script or network port.
- A source type is an arbitrary categorization of events. There may be many sources across many hosts in the same source type. For instance, given the sources
/var/log/access.2012-03-01.logand/var/log/access.2012-03-02.logon the hostsfredandwilma, you could reference all these logs with source type access or any other name that you like.
Let's move on now and discuss each of the Splunk widgets (just below the app name). The first widget is the navigation bar:

As a general rule, within Splunk, items with downward triangles are menus. Items without a downward triangle are links.
We will cover customizing the navigation bar in Chapter 8, Working with Apps.
Next, we find the Search bar. This is where the magic starts. We'll go into great detail shortly:

Okay, we've finally made it to search. This is where the real power of Splunk lies.
For our first search, we will search for the word (not case-specific) error. Click in the search bar, type the word error, and then either press Enter or click on the magnifying glass to the right of the bar:

Upon initiating the search, we are taken to the search results page (which hasn't really changed in version 7.0):

Note
Note that the search we just executed was across All time (by default); to change the search time, you can utilize the Splunk time picker.
However, since the data is randomly generated, not all queries will work as expected and you may have to modify them accordingly.
You can find the steps to upload the datasets in the previous Data generator section.
Refer to the Using the time picker section for details on changing the time frame of your search.
Let's inspect the elements on this page. Below the Search bar, we have the event count, action icons, and menus:

Starting from the left, we have the following:
- The number of events matched by the base search. Technically, this may not be the number of results pulled from disk, depending on your search. Also, if your query uses commands, this number may not match what is shown in the event listing.
- Job: It opens the
Search job inspectorwindow, which provides very detailed information about the query that was run. - Pause: It causes the current search to stop locating events but keeps the job open. This is useful if you want to inspect the current results to determine whether you want to continue a long-running search.
- Stop: This stops the execution of the current search but keeps the results generated so far. This is useful when you have found enough and want to inspect or share the results found so far.
- Share: It shares the search job. This option extends the job's lifetime to seven days and sets the read permissions to everyone.
- Print: This formats the page for printing and instructs the browser to print.
- Export: It exports the results. Select this option to output to CSV, raw events, XML, or JavaScript Object Notation (JSON) and specify the number of results to export.
- Smart mode: This controls the search experience. You can set it to speed up searches by cutting down on the event data it returns and additionally by reducing the number of fields that Splunk will extract by default from the data (Fast mode). You can otherwise set it to return as much event information as possible (Verbose mode). In Smart mode (the default setting), it toggles search behavior based on the type of search you're running.
Now we'll skip to the timeline below the action icons:

Along with providing a quick overview of the event distribution over a period of time, the timeline is also a very useful tool for selecting sections of time. Placing the pointer over the timeline displays a popup for the number of events in that slice of time. Clicking on the timeline selects the events for a particular slice of time.
Clicking and dragging selects a range of time:

Once you have selected a period of time, clicking on Zoom to selection changes the time frame and reruns the search for that specific slice of time. Repeating this process is an effective way to drill down to specific events.
Deselect shows all events for the time range selected in the time picker.
Zoom out changes the window of time to a larger period around the events in the current time frame.
To the left of the search results, we find the field picker. This is a great tool for discovering patterns and filtering search results:

The field list contains two lists.
Selected Fields, which have their values displayed under the search event in the search resultsInteresting Fields, which are other fields that Splunk has picked out for you
Above the field list are two links, Hide Fields and All Fields:
Hide Fields: Hides the field list area from the viewAll Fields: Takes you to theSelected Fieldswindow:

We are almost through with all the widgets on the page. We still have a number of items to cover in the search results section, though, just to be thorough:

As you can see in the previous screenshot, at the top of this section, we have the number of events displayed. When viewing all results in their raw form, this number will match the number above the timeline. This value can be changed either by making a selection on the timeline or by using other search commands.
Next, we have the action icons (described earlier) that affect these particular results.
Under the action icons, we have four results tabs:
Eventslist, which will show the raw events. This is the default view when running a simple search, as we have done so far.Patternsstreamlines event pattern detection. A list of the most common patterns among the set of events is returned by your search. A number of events that share a similar structure are represented by these patterns.Statisticspopulates when you run a search with transforming commands such as stats, top, chart, and so on. The previous keyword search for error does not display any results in this tab because it does not have any transforming commands.Visualizationtransforms searches and also populates theVisualizationtab. The results area of theVisualizationtab includes a chart and the statistics table used to generate the chart. Not all searches are eligible for visualization—a concept which will be covered later in this book.
Under the previously described tabs, is the timeline that we will cover in more detail later in this chapter.
Beneath the timeline (starting from the left) is a row of option links, including:
Show Fields: Shows theSelected FieldsscreenList: Allows you to select an output option (Raw,List,orTable) for displaying the search resultFormat: Provides the ability to setResult display options, such asShow row numbers,Wrap results, theMax lines(to display) andDrilldownas on or offNN Per Page: This is where you can indicate the number of results to show per page (10,20,or50)
To the right are options that you can use to choose a page of results, and to change the number of events per page.
Finally, we make it to the actual events. Let's examine a single event:

Starting from the left, we have:
Event Details: Clicking here (indicated by the right facing arrow) opens the selected event, provides specific information about the event by type, field, and value, and allows you the ability to perform specific actions on a particular event field. In addition, Splunk offers a button labeledEvent Actionsto access workflow actions, a few of which are always available.Build Event Type: Event types are a way to name events that match a certain query. We will dive into event types in Chapter 7, Extending Search.Extract Fields: This launches an interface for creating custom field extractions. We will cover field extraction in Chapter 3, Tables, Charts, and Fields.Show Source: This pops up a window with a simulated view of the original source.The event number: Raw search results are always returned in the order most recent first.- Next appear any workflow actions that have been configured. Workflow actions let you create new searches or links to other sites, using data from an event. We will discuss workflow actions in Chapter 7, Extending Search.
- Next comes the parsed date from this event, displayed in the time zone selected by the user. This is an important and often confusing distinction. In most installations, everything is in one time zone—the servers, the user, and the events. When one of these three things is not in the same time zone as the others, things can get confusing. We will discuss time in great detail in Chapter 2, Understanding Search.
- Next, we see the raw event itself. This is what Splunk saw as an event. With no help, Splunk can do a good job finding the date and breaking lines appropriately; but as we will see later, with a little help, event parsing can be more reliable and more efficient.
- Below the event are the fields that were selected in the field picker. Clicking on the value adds the field value to the search.
Now that we've looked through all the widgets, let's use them to modify our search. First, we will change our time. The default setting of All time is fine when there are few events, but when Splunk has been gathering events over a period of time (perhaps for weeks or months), this is less than optimal. Let's change our search time to one hour:

The search will run again, and now we see results for the last hour only. Let's try a custom time. Date Range is an option:

If you know specifically when an event happened, you can drill down to whatever time range you want here. We will examine the other options in Chapter 2, Understanding Search.
The field picker is very useful for investigating and navigating data. Clicking on any field in the field picker pops open a panel with a wealth of information about that field in the results of your search:

Looking through the information, we observe the following:
- Number (of) values, appears in X% of results tells you how many events contain a value for this field.
Selectedindicates if the field is a selected field.Top valuesandTop values by time(allows referring to theTop 10 Valuesreturned in the search) present graphs about the data in this search. This is a great way to dive into reporting and graphing. We will use this as a launching point later.Rare valuesdisplays the least common values of a field.Events with this fieldwill modify the query to show only those events that have this field defined.- The links are actually a quick representation of the top values overall. Clicking on a link adds that value to the query. Let's click on
c:\\Test Data\\tm1server.log:

This will rerun the search, now looking for errors that affect only the source value c:\\Test Data\\tm1server.log.
The Settings section, in a nutshell, is an interface for managing configuration files. The number of files and options in these configuration files is truly daunting, so the web interface concentrates on the most commonly used options across the different configuration types.
Splunk is controlled exclusively by plain text configuration files. Feel free to take a look at the configuration files that are being modified as you make changes in the admin interface. You will find them by hitting the following locations:
$SPLUNK_HOME/etc/system/local/$SPLUNK_HOME/etc/apps/
$SPLUNK_HOME/etc/users/<user>/<app>/local
You may notice configuration files with the same name at different locations. We will cover in detail the different configuration files, their purposes, and how these configurations merge together in Chapter 11, Configuring Splunk. Don't start modifying the configurations directly until you understand what they do and how they merge.
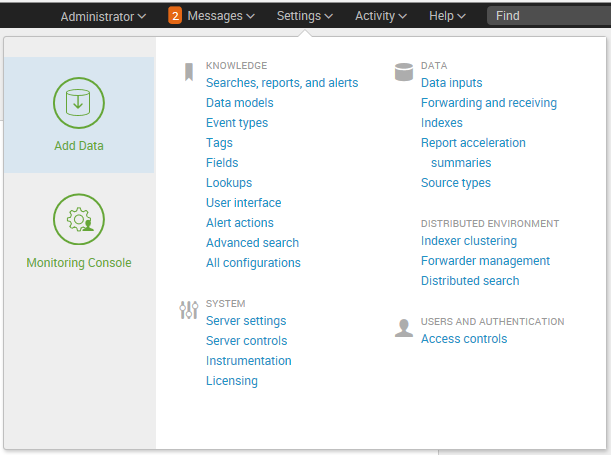
Clicking on Settings on the top bar takes you to the Settings page:

The reader will note that the layout of the setting page has changed a bit in version 7.0, but it is generally the same as prior versions. We'll point out the differences here. First, there have been some name changes (Distributed Management Console is now Monitoring Console) and a few extra links added (under SYSTEM we see Instrumentation, and DATA has added Source Types).
The options are organized into logical groupings, as follows:

System: The options under this section control system-wide settings:System settingscovers network settings, the default location to store indexes, outbound email server settings, and how much data Splunk logs about itselfServer controlscontains a single page that lets you restart Splunk from the web interfaceLicensinglets you add license files or configure Splunk as a slave to a Splunk license serverInstrumentation(new to version 7.0) lets you configure automated reporting settings, view collected data, export data to a file, or send data to Splunk
Data: This section is where you manage the data flow:Data Inputs: Splunk can receive data by reading files (either in batch mode or in real time), listening to network ports, or running scripts.Forwarding and receiving: Splunk instances don't typically stand alone. Most installations consist of at least one Splunk indexer and many Splunk forwarders. Using this interface, you can configure each side of this relationship and more complicated setups (we will discuss this in more detail in Chapter 12, Advanced Deployments).Indexes: An index is essentially a data store. Under the covers, it is simply a set of directories, created and managed by Splunk. For small installations, a single index is usually acceptable. For larger installations, using multiple indexes allows flexibility in security, retention, and performance tuning, as well as better use of hardware. We will discuss this further in Chapter 11, Configuring Splunk.Report acceleration summaries: Accesses automatically-created summaries to speed up completion times for certain kinds of reports.Source Types: Allows access to the source types page. Source types are used to assign configurations like timestamp recognition, event breaking, and field extractions to data indexed by Splunk.
Distributed environment: The three options here relate to distributed deployments (we will cover these options in detail in Chapter 12, Advanced Deployments):Indexer clustering: Access to enabling and configuring SplunkIndexer clustering, which we will discuss later in this book.Forwarder management: Access to the forwarder management UI distributes deployment apps to Splunk clients.Distributed search: Any Splunk instance running searches can utilize itself and other Splunk instances to retrieve results. This interface allows you to configure access to other Splunk instances.
Users and authentication: This section provides authentication controls and an account link:Access controls: This section is for controlling how Splunk authenticates users and what users are allowed to see and do. We will discuss this further in Chapter 11, Configuring Splunk.
In addition to the links, the Settings page also presents a panel on the left-hand side of the page. This panel includes two icons, Add Data and (previously) Distributed Management Console, now Monitoring Console:
Add Datalinks to theAdd Datapage. This page presents you with three options for getting data into your Splunk Enterprise instance:Upload,Monitor, andForward.Monitoring Consoleis where you can view detailed performance information about your Splunk Enterprise deployment.
An exciting new option for Splunk is Splunk Cloud. This option offers almost all of Splunk's features and functionalities along with the convenience of being on a real cloud platform:
- Readily available online, Splunk lists the following statement as per http://docs.splunk.com/Documentation/SplunkCloud/6.6.3/User/WelcometoSplunkCloud:
"Splunk Cloud provides a layer of security and operational control that causes it to differ from Splunk Enterprise".
In my experience, moving any software or service to the cloud typically will have some implications. With Splunk Cloud, you can expect the following differences (from Splunk Enterprise):
- There is no CLI (Splunk's command-line interface) support. This means that some (administrative) tasks can be achieved through the web browser but most will require Splunk support.
- Only apps that have been assessed (on security and stability) and accepted by Splunk support are allowed to be installed and run in Splunk Cloud.
- If you selected a managed Splunk Cloud, Splunk support must install and configure all apps (self-service Splunk Cloud still allows you to install apps yourself).
- Direct monitoring of TCP, UDP, file, and syslog inputs. Unlike Splunk Enterprise, these data types cannot be sent straight to Splunk Cloud (an on-premises forwarder must be used).
- Scripted Alerts are supported only in approved apps.
- License pooling is not available in Splunk Cloud. The license manager is not internet-accessible to the Splunk Cloud customers.
- Again, for managed Splunk Cloud deployments, the HTTP event collector (HEC) must be set up for you by Splunk.
- Access to the Splunk API is initially turned off (for Splunk Clusters) but can be turned on by Splunk support. To enable API access to Splunk Cloud sandbox(es) and trials, and single instance deployments, you must file a Support ticket (not recommended due to the short duration of trials).
It's worth giving Splunk Cloud a try (even if you are not seriously considering its usage in the near future). If you have a valid Splunk ID, you can test-drive Splunk Cloud for free (for 15 days):

To use your Splunk ID to test drive Splunk Cloud, all you need to do is register and agree to the conditions and terms. This is the Terms of Service acceptance page:

Once you check the box (and then click on the button labeled Ok), you will be sent an instructional email, and you are ready to go!

Let's start with accessing your instance. Once you've received the acknowledgement that your Splunk Cloud (trial) instance is ready, you can point your browser to the provided URL. You will notice that the web address for Splunk Cloud is prefixed with a unique identifier that qualifies your particular instance (this is actually the server name where your instance resides):

And the Log In page is a bit different in appearance (from Splunk Enterprise):

Once you are authenticated, we see the Splunk Cloud main page:

First things first. Looking across the task bar (at the top of the page), if you click on Support & Services and then About, you will notice that the Splunk Cloud version is 6.6.3.2, which is NOT the latest on-premise or locally installed version:

The top bar in Splunk Cloud is relatively the same but shifts the locally installed Splunk right-located links (Messages, Settings, Activity, and Find) to the left:

While on the right, there is My Splunk:

The My Splunk link sends you to the Instances page, where you can view and edit information about the Splunk instances you have access to. You can also use this page as a portal to access all of your instances by clicking on the button labeled Access Instance next to the instance you which to log in to. This is the Instances page:

On the app list (left of the home app page) in Splunk Cloud, you will notice three apps preloaded for you: Splunk Reference App-PAS, Universal Forwarder, and eventgen (as follows):

Splunk's Pluggable Auditing System (PAS) (originally available as version 1.0 back in January 2015) is a Splunk App designed to describe how to develop Splunk apps. It is intended to present recommended practices in addition to the Splunk developer platform.
PAS also:
- Enables you to monitor countless document repositories to track who has viewed, modified, deleted, or downloaded documents or other artifacts from numerous sources
- Detects suspicious activities
- Analyzes trends
The Splunk universal forwarder is a no-license-required app that is not unique to Splunk Cloud or even new to Splunk 7.0; in fact, it has been available and in use for quite some time and several releases.
Since it's a cloud-specific app, we'll not spend much time on it here. But, as a reminder, UF is a dedicated, lightweight form of Splunk Enterprise containing only the vital components required to forward data and is intended to run on production servers, requiring minimal CPU and memory. It has the slightest effect possible on other software, making it ideal for Splunk Cloud.
As mentioned at the beginning of this section, when you sign up for Splunk Cloud, an email will be sent to your registered email ID to let you log in to your Splunk Cloud account. You will also receive an app unique to you to help you configure your forwarded to send data to your Cloud as shown in the Cloud documentation:
http://docs.splunk.com/Documentation/SplunkCloud/latest/User/GetstartedwithSplunkCloud
Note
Note: https://splunkbase.splunk.com/apps/#/product/cloud is a great place to see what apps are Cloud-compatible or what apps are available specifically for Splunk Cloud.
As you have seen in this chapter, the Splunk GUI provides a rich interface for working with search results. We really scratched just the surface and will cover more elements as we use them in later chapters.
Something new in this edition was the discussion of Splunk Cloud. With Splunk Cloud, we can avail the features of Splunk Enterprise. It also provides access to numerous apps on Splunkbase and enables to you build customized apps.
In the next chapter, we will dive into the nuts and bolts of how searching works so that you can make efficient searches to populate the cool reports that we will make in Chapter 3, Tables, Charts, and Fields, and beyond.