


 Download code from GitHub
Chapter 1: A General Introduction to Debugging Software
Hello there! Welcome on this journey of learning how to go about debugging a really sophisticated, large, and complex piece of software that's proven absolutely critical to big businesses as well as tiny embedded systems and everything in between – the Linux kernel.
Let's begin this very first chapter, and our journey of kernel debugging, by first understanding a little more about what a bug really is, and the origins and myths of the term debugging. Next, a glimpse at some actual real-world software bugs will (hopefully) provide the required inspiration and motivation (to firstly avoid bugs and then to find and fix bugs, of course). You will be guided on how to set up an appropriate workspace to work on a custom kernel and debug issues, including setting up a full-fledged debug kernel. We'll wrap up with some useful tips on debugging.
In this chapter, we're going to cover the following main topics:
- Software debugging – what it is, origins, and myths
- Software bugs – a few actual cases
- Setting up the workspace
- Debugging – a few quick tips
Technical requirements
You will require a modern and powerful desktop or laptop. We tend to use Ubuntu 20.04 LTS running on an x86_64 Oracle VirtualBox Virtual Machine (VM) as the primary platform for this book. Ubuntu Desktop specifies the recommended minimum system requirements (https://help.ubuntu.com/community/Installation/SystemRequirements) for the installation and usage of the distribution; do refer to those specifications to verify that your system (even a guest) is up to it. The Running Linux as a guest OS section covers the details.
Cloning this book's code repository
The complete source code for this book is freely available on GitHub at https://github.com/PacktPublishing/Linux-Kernel-Debugging. You can work on it by cloning the Git tree using the following command:
git clone https://github.com/PacktPublishing/Linux-Kernel-Debugging
The source code is organized chapter-wise. Each chapter is represented as a directory in the repository – for example, ch1/ has the source code for this chapter. A detailed description of installing a viable system is covered in the Setting up the workspace section.
Software debugging – what it is, origins, and myths
In the context of a software practitioner, a bug is a defect or an error within code. A key, and often large, part of our job as software developers is to hunt them down and fix them, so that, as far as is humanely possible, the software is defect-free and runs precisely as designed.
Of course, to fix a bug, you first have to find it. Indeed, with non-trivial bugs, it's often the case that you aren't even aware there is a bug (or several) until some event occurs to expose it! Shouldn't we have a disciplined approach to finding bugs before shipping a product or project? Of course we should (and do) – it's the Quality Assurance (QA) process, more commonly known as testing. Though glossed over at times, testing remains one of the – if not the – most important facets of the software life cycle. (Would you voluntarily fly in a new aircraft that's never been tested? Well, unless you're the lucky test pilot...)
Okay, back to bugs; once identified (and filed), your job as a software developer is to then identify what exactly is causing them – what the actual underlying root cause is. A large portion of this book is devoted to tools, techniques, and just thinking about how to do this exactly. Once the root cause is identified, and you have clearly understood the underlying issue, you will, in all probability, be able to fix it. Yay!
This process of identifying a bug – using tools, techniques, and some hard thinking to figure out its root cause – and then fixing it is subsumed into the word debugging. Without bothering to go into details, there's a popular story regarding the origin of the word debugging: on a Tuesday at Harvard University (on September 9, 1947), Admiral Grace Hopper's staff discovered a moth caught in a relay panel of a Mark II computer. As the system malfunctioned because of it, they removed the moth, thus de-bugging the system! Well, as it turns out: one, Admiral Hopper has herself stated that she didn't coin the term, debugging; two, its origins seem to be rooted in aeronautics. Nevertheless, the term debugging has stuck.
The following figure shows the picture at the heart of this story – the unfortunate but posthumously famous moth that inadvertently caught itself in the system that had to be debugged!
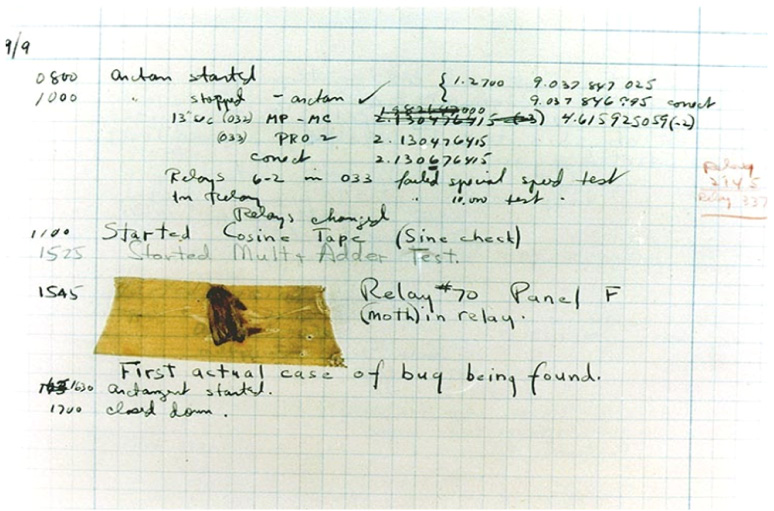
Figure 1.1 – The famous moth (by courtesy of the Naval Surface Warfare Center, Dahlgren, VA., 1988. - U.S. Naval Historical Center Online Library Photograph NH 96566-KN. Public Domain, https://commons.wikimedia.org/w/index.php?curid=165211)
Having understood what a bug and debugging basically are, let's move on to something both interesting and important – we'll briefly examine a few real-world cases where a software bug (or bugs) has been the cause of some unfortunate and tragic accidents.
Software bugs – a few actual cases
Using software to control electro-mechanical systems is not only common, it's pretty much all-pervasive in today's world. The unfortunate reality though, is that software engineering is a relatively young field and that we humans are naturally prone to making mistakes. These factors can combine to create unfortunate accidents when software doesn't execute conforming to its design (which, of course, leads to it being called buggy).
Several real-world examples of this occurring exist; we highlight a few of them in the following sub-sections. The brief synopsis given here is really just that – (too) brief: to truly understand the complex issues behind failures like this, you do need to take the trouble to study the technical crash (or failure) investigation reports in detail (do see the links in the Further reading section of this chapter). Here, I briefly mention and summarize these cases to, one, underline the fact that software failures, even in large, heavily tested systems, can and do occur, and two, to motivate all of us involved in any part of the software life cycle to pay closer attention, to stop making assumptions, and to do a better job of designing, implementing, and testing the software we work on.
Patriot missile failure
During the Gulf War, the US deployed a Patriot missile battery in Dharan, Saudi Arabia. Its job was to track, intercept, and destroy incoming Iraqi Scud missiles. But, on February 25, 1991, a Patriot system failed to do so, causing the death of 28 soldiers and injury to about 100 others. An investigation revealed that the problem's root was at the heart of the software tracking system. Briefly, the system uptime was tracked as a monotonically increasing integer value. It was converted to a real – floating-point – value by multiplying the integer by 1/10 (which is a recurring binary expression evaluating to 0.00011001100110011001100110011001100...; a quick online calculator's available here: http://www.easysurf.cc/fracton2.htm). The trouble is, the computer used a 24-bit (integer) register for this conversion, resulting in the computation being truncated at 24 bits. This caused a loss of precision, which only became significant when the time quantity was sufficiently large.
This was exactly the case that day. The Patriot system had been up for about 100 hours, thus, the loss of precision during the conversion translated to an error of approximately 0.34 seconds. Doesn't sound like much, except that a Scud missile's velocity is about 1,676 meters per second, thus resulting in a tracking error of about 570 meters. This was large enough for the Scud to be outside the Patriot tracking system's range gate and it was thus not detected. Again, a case of loss of precision during conversion from an integer value to a real (floating-point) number value.
The ESA's unmanned Ariane 5 rocket
On the morning of June 4, 1996, the European Space Agency's (ESA's) Ariane 5 unmanned rocket launcher took off from the Guiana Space Centre, off the South American coast of French Guiana. A mere 40 seconds into its flight, the rocket lost control and exploded. The final investigation report revealed that the primary cause ultimately came down to a software overflow error.
It's more complex than that; a brief summary of the chain of events leading to the loss of the rocket follows. (In most cases like this, it's not one single event that causes an accident; rather, it's a chain of several events.) The overflow error occurred during the execution of code converting a 64-bit floating-point value to a 16-bit signed integer; an unprotected conversion gave rise to an exception (Operand Error; the programming language was Ada). This, in turn, occurred due to a much higher than expected internal variable value (BH – Horizontal Bias). The exception caused the shutdown of the Inertial Reference Systems (SRIs). This caused the primary onboard computer (OBC) to send erroneous commands to the nozzle deflectors resulting in full nozzle deflection of the boosters and the main Vulcain engine, which caused the rocket to veer dramatically off its flight path.
The irony is that the SRIs were, by default, not even supposed to function after launch; but due to a delay in the launch window, the design specified that they remain active for 50 seconds after launch! An interesting analysis of why this software exception wasn't caught during development and testing (https://archive.eiffel.com/doc/manuals/technology/contract/ariane/) boils down to concluding that the fault lay in a reuse error:
"The SRI horizontal bias module was reused from a 10-year-old software, the software from Ariane 4."
Mars Pathfinder reset issue
On July 4, 1997, NASA's Pathfinder lander touched down on the surface of Mars and proceeded to deploy its smaller robot cousin – the Sojourner rover, the very first wheeled device to embark upon another planet! The lander suffered from periodic reboots; the problem was ultimately diagnosed as being a classic case of priority inversion – a situation where a high-priority task is made to wait for lower-priority tasks. As such, this by itself may not cause an issue; the trouble is that the high-priority task was left off the CPU long enough for the watchdog timer to expire, causing the system to reboot.
An irony here was that there exists a well-known solution – enabling the priority inheritance feature of the semaphore object (allowing the task taking the semaphore lock to have its priority raised to the highest on the system for the duration for which it holds the lock, thus enabling it to complete its critical section and release the lock quickly, preventing starvation of higher-priority tasks). The VxWorks RTOS employed here defaulted to having the priority inheritance attribute turned off and the Jet Propulsion Laboratory (JPL) team left it that way. As they (very deliberately) allowed the robot to continuously stream telemetry debug data to Earth, they were able to correctly determine the root cause and thus fix it – by enabling the semaphore priority inheritance feature. An important lesson here is this one, as the team lead Glenn Reeves put it:
"We test what we fly and we fly what we test."
I'd venture that these articles (see the Further reading section) are a must-read for any system software developer!
The Boeing 737 MAX aircraft – the MCAS and lack of training of the flight crew
Two unfortunate accidents, taking 346 lives in all, put the Boeing 737 MAX under the spotlight: the crash of Lion Air Flight 610 from Jakarta into the Java Sea (October 29, 2018) and the crash of Ethiopian Airlines Flight 302 from Nairobi into the desert (March 10, 2019). These incidents occurred just 13 and 6 minutes after take-off, respectively.
Of course, the situation is complex. At one level, this is what likely caused these accidents: once Boeing determined that the aerodynamic characteristics of the 737 MAX left something to be desired, they worked on fixing it via a hardware approach. When that did not suffice, engineers came up with (what seemed) an elegant and relatively simple software fix, christened the maneuvering characteristics augmentation system (MCAS). Two sensors on the aircraft's nose continually measure the aircraft's angle of attack (AoA). When the AoA is determined to be too high, this typically entails a pending stall (dangerous!). The MCAS kicks in, (aggressively) moving control surfaces on the tail elevator, causing the nose to go down, and stabilizing the aircraft. But, for whatever reasons, the MCAS was designed to use only one of the sensors! If the sensor failed, the MCAS could automatically activate, causing the nose to go down and the aircraft to rapidly lose altitude; this is what seems to have actually occurred in both crashes.
Further, many pilot crews weren't explicitly trained in managing the MCAS (some claimed they weren't even aware of it!). The luckless flights' pilots apparently did not manage to override the MCAS, even when no actual stall occurred.
Other cases
A few other examples of such cases are as follows:
- June 2002, Fort Drum: a US Army report maintained that a software issue contributed to the death of two soldiers. This incident occurred when they were training to fire artillery shells. Apparently, unless the target altitude is explicitly entered into the system, the software assumes a default of zero. Fort Drum is apparently 679 feet above sea level.
- In November 2001, a British engineer, John Locker, noticed that he could easily intercept American military satellite feeds – live imagery of US spy planes over the Balkans. The almost unbelievable reason was the stream was being transmitted unencrypted, enabling pretty much anyone in Europe with a regular satellite TV receiver to see it! In today's context, many IoT devices have similar issues...
- Jack Ganssle, a veteran and widely known embedded systems developer and author, brings out the excellent TEM – The Embedded Muse – newsletter bi-monthly. Every issue has a section entitled Failure of the Week, typically highlighting a hardware and/or software failure. Do check it out!
- Read the web page on Software Horror Stories here (http://www.cs.tau.ac.il/~nachumd/horror.html); though old, it provides many examples of software gone wrong with, at times, tragic consequences.
- A quick Google search on Linux kernel bug stories yields interesting results: https://www.google.com/search?q=linux+kernel+bug+story.
Again, if interested in digging deeper, I urge you to read the detailed official reports on these accidents and faults; the Further reading section has several relevant links.
By now, you should be itching to begin debugging on Linux! Let's do just that – begin – by first setting up the workspace.
Setting up the workspace
Firstly, you'll have to decide whether to run your test Linux system as a native system (on the bare metal) or as a guest OS. We'll cover the factors that will help you decide. Next, we (briefly) cover the installation of some software (the guest additions) for a case where you use a guest Linux OS, followed by the required software packages to install.
Running Linux as a native or guest OS
Ideally, you should run a recent Linux distribution (Ubuntu, Fedora, and so on) on native hardware. We tend to use Ubuntu 20.04 LTS in this book as the primary system to experiment upon. The more powerful your system – in terms of RAM, processing power, and disk space – the better! Of course, as we shall be debugging at the level of the kernel, crashes and even data loss (the chances of the latter are small, but nevertheless...) can occur; hence, the system should be a test one with no valuable data on it.
If running Linux on native hardware – on the bare metal, as it were – isn't feasible for you, then a practical and convenient alternative is to install and use the Linux distribution as a guest OS, a VM. It's important to install a recent Linux distribution.
Running a Linux guest as a VM is certainly feasible but (there's always a but isn't there?!), it will almost certainly feel a lot slower than running Linux natively. Still, if you must run a Linux guest, it certainly works. It goes without saying that the more powerful your host system, the better the experience. There's also an arguable advantage to running your test system as a guest OS: even if it does crash (please do expect that to happen, especially with the deliberate (de)bugging we'll do in this book!), you don't even need to reboot the hardware; merely reset the hypervisor software running the guest (typically Oracle VirtualBox).
Alternate Hardware – Using Raspberry Pi (and Other) ARM-Based Systems
Though we specified that you can run a recent Linux distro either as a native system or as a guest VM, the assumption was that it's an x86_64 system. While that suffices, to get more out of the experience of this book (and simply to have more fun), I highly recommend you also try out the sample code and run the (buggy) test cases on alternate architectures. With many, if not most, modern embedded Linux systems being ARM-based (on both 32-bit ARM and 64-bit AArch64 processors), the Raspberry Pi hardware is extremely popular, relatively cheap, and has tremendous community support, making it an ideal test bed. I do use it every now and then within this book, in the chapters that follow; I'd recommend you do the same!
All the details – installation, setup, and so on – are amply covered in the well-documented Raspberry Pi documentation pages here: https://www.raspberrypi.org/documentation/.
Ditto for another popular embedded prototyping board - TI's BeagleBone Black (affectionately, the BBB). This site is a good place to get started with the BBB: https://beagleboard.org/black.
Running Linux as a guest OS
If you do decide to run Linux as an x86_64 guest, I'd recommend using Oracle VirtualBox 6.x (or the latest stable version) as a comprehensive and powerful all-in-one GUI hypervisor application appropriate for a desktop PC or laptop. Other virtualization software, such as VMware Workstation or QEMU, should also be fine. All of these are freely available and open source. It's just that the code for this book has been tested on Oracle VirtualBox 6.1. Oracle VirtualBox is considered Open Source Software (OSS) and is licensed under the GPL v2 (the same as the Linux kernel). You can download it from https://www.virtualbox.org/wiki/Downloads. Its documentation can be found here: https://www.virtualbox.org/wiki/End-user_documentation.
The host system should be either MS Windows 10 or later (of course, even Windows 7 will work), a recent Linux distribution (for example, Ubuntu or Fedora), or macOS.
The guest (or native) Linux distribution can be any sufficiently recent one. For the purpose of following along with the material and examples presented in this book, I'd recommend installing Ubuntu 20.04 LTS. This is what I primarily use for the book.
How can you quickly check which Linux distribution is currently installed and running?
On Debian/Ubuntu, the lsb_release –a command should do the trick; for example, on my guest Linux:
$ lsb_release –a 2> /dev/null
Distributor ID: Ubuntu
Description:    Ubuntu 20.04.2 LTS
Release:        20.04
Codename:       focal
$
How can you check if the Linux currently running is on native hardware or is a guest VM (or a container)? There are many ways to do so. The script virt-what is one (we will be installing it). Other commands include hostnamectl(1), dmidecode(8) (on x86), systemd-detect-virt(1) (if systemd is the initialization framework), lshw(1) (x86, IA-64, PPC), raw ways via dmesg(1) (grepping for Hypervisor detected), and via /proc/cpuinfo.
In this book, I shall prefer to focus on setting up what is key from a kernel debug perspective; hence, we won't discuss the in-depth details of installing a guest VM (typically on a Windows host running Oracle VirtualBox) here. If you require some help, please refer to the many links to tutorials on precisely this within the Further reading section of this chapter. (FYI, these installation details, and a lot more, are amply covered in my previous book Linux Kernel Programming, Chapter 1, Kernel Workspace Setup).
Tip – Using Prebuilt VirtualBox Images
The OSBoxes project allows you to freely download and use prebuilt VirtualBox (as well as VMware) images for popular Linux distributions. See their site here: https://www.osboxes.org/virtualbox-images/.
In our case, you can download a prebuilt x86_64 Ubuntu 20.04.3 (as well as others) Linux image here: https://www.osboxes.org/ubuntu/. It comes with the guest additions preinstalled! The default username/password is osboxes/osboxes.org.
(Of course, for more advanced readers, you'll realize it's really up to you. Running an as-light-as-possible custom Linux system on a Qemu (emulated) standard PC is a choice as well.)
Note that if your Linux system is installed natively on the hardware platform, you're using an OSBoxes Linux distro with the VirtualBox guest additions preinstalled, or you're using a Qemu-emulated PC, simply skip the next section.
Installing the Oracle VirtualBox guest additions
The guest additions are essentially software (para-virtualization accelerators) that quite dramatically enhance the performance, as well as the look and feel, of the experience of running a guest OS on the host system; hence, it's important to have it installed. (Besides acceleration, the guest additions provide conveniences such as the ability to nicely scale the GUI window and share facilities such as folders, the clipboard, and to drag and drop between the host and the guest.)
Before doing this though, please ensure you have already installed the guest VM (as mentioned previously). Also, the first time you log in, the system will likely prompt you to update and possibly restart; please do so. Then, follow along:
- Log in to your Linux guest VM (I'm using the login name
letsdebug; guess why!) and first run the following commands within a Terminal window (on a shell):sudo apt update sudo apt upgrade sudo apt install build-essential dkms linux-headers-$(uname –r) ssh -y
(Ensure you run each of the preceding commands on one line.)
- Install the Oracle VirtualBox Guest Additions now. Refer to How to Install VirtualBox Guest Additions in Ubuntu: https://www.tecmint.com/install-virtualbox-guest-additions-in-ubuntu/.
- On Oracle VirtualBox, to ensure that you have access to any shared folders you might have set up, you need to set the guest account to belong to the
vboxsfgroup; you can do so like this (once done, you'll need to log in again, or sometimes even reboot, to have this take effect):sudo usermod -G vboxsf -a ${USER}
The commands (step 1), after updating, have us install the build-essential package along with a couple of others. This ensures that the compiler (gcc), make, and other essential build utility programs are installed so that the Oracle VirtualBox Guest Additions can be properly installed straight after (in step 2).
Installing required software packages
To install the required software packages, perform the following steps (do note that, here, we assume the Linux distribution is our preferred one, Ubuntu 20.04 LTS):
- Within your Linux system (be it a native one or a guest OS), first do the following:
sudo apt update
Now, to install the remaining required packages for the kernel build, run the following command in a single line:
sudo apt install bison flex libncurses5-dev ncurses-dev xz-utils libssl-dev libelf-dev util-linux tar -y
(The -y option switch has apt assume a yes answer to all prompts; careful though, this could be dangerous in other circumstances.)
- To install the packages required for work we'll do in other parts of this book, run the following command in a single line:
sudo apt install bc bpfcc-tools bsdmainutils clang cmake cppcheck cscope curl \
dwarves exuberant-ctags fakeroot flawfinder git gnome-system-monitor gnuplot \
hwloc indent kernelshark libnuma-dev libjson-c-dev linux-tools-$(uname -r) \
net-tools numactl openjdk-16-jre openssh-server perf-tools-unstable psmisc \
python3-distutils rt-tests smem sparse stress sysfsutils tldr-py trace-cmd \
tree tuna virt-what -y
A point to mention: all the packages mentioned above aren't strictly required in order for you to work on this book; some are those we encounter just once or twice.
Tip – A Script to Auto-Install Required Packages
To make the (immediately above-mentioned) package install task simpler, you can make use of a simple bash script that's part of the GitHub repository for this book: pkg_install4ubuntu_lkd.sh. It's been tested on an x86_64 OSBoxes Ubuntu 20.04.3 LTS VM (running on Oracle VirtualBox 6.1).
FYI, to check which packages are taking up the most space, install the wajig package and run this: sudo wajig large.
Great; now that the packages are installed, let's proceed with understanding the next portion of our workspace setup – the need for two kernels!
A tale of two kernels
When working on a project or product, there obviously will be a Linux kernel that will be deployed as part of the overall system.
Requirements for a Working Linux System
A quick aside: a working Linux system minimally requires a bootloader, a kernel, and root filesystem images. Additionally, typical arm/arm64/ppc systems require a Device Tree Blob (DTB) as well.
This system that's deployed to the outside world is, in general, termed the production system and the kernel the production kernel. Here, we'll limit our discussion to the kernel only. The configuration, build, test, debug, and deployment of the production kernel is, no doubt, a key part of the overall project.
Do note though, that in many systems (especially the enterprise-class ones), the production kernel is often simply the default kernel that's supplied by the vendor (Red Hat, SUSE, Canonical, or others). On most embedded Linux projects and products, this is likely not the case: the platform (or Board Support Package (BSP)) team or a vendor will select a base mainline kernel (typically from kernel.org) and customize it. This can include enhancements, careful configuration, and deployment of the custom-built production kernel.
For the purpose of our discussion, let's assume that we need to configure and build a custom kernel.
A production and a debug kernel
However (and especially after having read the earlier Software bugs – a few actual cases section), you will realize that there's always the off-chance that even the kernel – more likely the code you and your team added to it (the kernel modules, drivers, interfacing components) – has hidden faults (bugs). With a view to catching them before the system hits the field, thorough testing/QA is of prime importance!
Now, the issue is this: unless certain deeper checks are enabled within the kernel itself, it's entirely possible that they can escape your test cases. So, why not simply enable them? Well, one, these deeper checks are typically switched off by default in the production kernel's configuration. Two, when turned on, they do result in performance degradation, at times quite significantly.
So, where does that leave us? Simple, really: you should plan on working with at least two, and possibly three, kernels:
- One, a carefully tuned production kernel, geared toward efficiency, security, and performance.
- Two, a carefully configured debug kernel, geared toward catching pretty much all kinds of (kernel) bugs! Performance is not a concern here, catching bugs is.
- Three (optional, case by case): a production kernel with one or more very specific debug options enabled and the rest turned off.
The second one, the so-called debug kernel, is configured in such a way that all required or recommended debug options are turned on, enabling you to (hopefully!) catch those hidden bugs. Of course, performance might suffer as a result, but that's okay; catching – and subsequently fixing – kernel-level bugs is well worth it. Indeed, in general, during development and (unit) testing, performance isn't paramount; catching and fixing deeply hidden bugs is! We do understand that, at times, bugs need to be reproduced and identified on the production kernel itself. The third option mentioned above can be a life-saver here.
The debug kernel is only used during development, testing, and very possibly later when bugs do actually surface. How exactly it's used later is something we shall certainly cover in the course of this book.
Also, this point is key: it usually is the case that the mainline (or vanilla) kernel that your custom kernel is based upon is working fine; the bugs are generally introduced via custom enhancements and kernel modules. As you will know, we typically leverage the kernel's Loadable Kernel Module (LKM) framework to build custom kernel code – the most common being device drivers. It can also be anything else: custom network filters/firewalls, a new filesystem, or I/O scheduler. These are out-of-tree kernel components (typically some .ko files) that become part of the root filesystem (they're usually installed in /lib/modules/$(uname –r)). The debug kernel will certainly help catch bugs in your kernel modules as their test cases are executed, as they run.
The third kernel option – an in-between of the first two – is optional of course. From a practical real-world point of view, it may be exactly what's required on a given setup. With certain kernel debug systems turned on, to catch specific types of bugs that you're hunting (or anticipate) and the rest turned off, it can be a pragmatic way to debug even a production system, keeping performance high enough.
For practical reasons, in this book, we'll configure, build, and make use of the first two kernels – a custom production one and a custom debug one, only; the third option is yours to configure as you gain experience with the kernel debug features and tools as well as your particular product or project.
Which kernel release should you use?
The Linux kernel project is often touted as the most successful open source project ever, with literally hundreds of releases and a release cadence that's truly phenomenal for such an enormous project (it averages a new release every 6 to 8 weeks!). Among all of them, which one should we use (as a starting point, at least)?
It's really important to use the latest stable kernel version, as it will include all the latest performance and security fixes. Not just that, the kernel community has different release types, which determine how long a given kernel release will be maintained (with bug and security fixes being applied, as they become known). For typical projects or products, selecting the latest Long Term Stable (LTS) kernel release thus makes the best sense. Of course, as already mentioned, on many projects – typically, the server-/enterprise-class ones – the vendor (Red Hat, SUSE, and others) might well supply the production kernel to be used; here, for the purpose of our learning, we'll start from scratch and configure and build a custom Linux kernel ourselves (as is often the case on embedded projects).
As of when I wrote this chapter, the latest LTS Linux kernel is 5.10 (particularly, version 5.10.60); I shall use this kernel throughout this book. (You will realize that by the time you're reading this, it's entirely possible – in fact pretty much guaranteed – that the latest LTS kernel has evolved to a newer version).
Important – Security
It's already happened of course. Now, it's March 2022, I'm writing the tenth chapter, the latest 5.10 LTS kernel is 5.10.104, and guess what? A serious and critical vulnerability (vuln) has emerged in recent Linux kernels – including 5.10.60! – christened Dirty Pipe. Details: New Linux bug gives root on all major distros, exploit released, Mar 2022: https://www.bleepingcomputer.com/news/security/new-linux-bug-gives-root-on-all-major-distros-exploit-released/. Here's an explanation by the person who found and reported the vuln (a must read!): The Dirty Pipe Vulnerability, Max Kellerman: https://dirtypipe.cm4all.com/.
(It's also very interesting – the fix comes down to 2 lines – initializing a local variable to 0!: https://lore.kernel.org/lkml/20220221100313.1504449-1-max.kellermann@ionos.com/.)
The upshot of all this: I recommend you use a fixed kernel (as of now, kernel versions 5.16.11, 5.15.25, and 5.10.102 are fixed). Since this book is based on the 5.10 LTS kernel, I thus highly recommend you use a version 5.10 LTS kernel, specifically, version 5.10.102 or later. (The material, of course, continues to be based on 5.10.60; besides the security implication, which of course really matters on actual production systems, the technical details remain identical.)
Besides, a key point in our favor – the 5.10 LTS kernel will be supported by the community until December 2026, thus keeping it relevant and valid for a pretty long time!
So, great – let's get to configuring and building both our custom production and debug 5.10 kernels! We'll begin with the production one.
Setting up our custom production kernel
Here, I shall have to assume you are familiar with the general procedure involved in building a Linux kernel from source: obtaining the kernel source tree, configuring it, and building it. In case you'd like to brush up on this, the Linux Kernel Programming book covers this in a lot of detail. As well, do refer to the tutorials and links in the Further reading section of this chapter.
Though this is meant to be our production kernel, we'll begin with a rather simplistic default that's based on the existing system (this approach is sometimes called the tuned kernel config via the localmodconfig one. FYI, this, and a lot more, is covered in depth in the Linux Kernel Programming book). Once we've got a reasonable starting point, we'll further tune the kernel for security. Let's begin by performing some base configuration:
- Create a new directory in which you'll work upon the upcoming production kernel:
mkdir –p ~/lkd_kernels/productionk
Bring in the kernel source tree of your choice. Here, as mentioned in Which kernel release should you use?, we shall use the latest (at the time of writing this) LTS Linux kernel, version 5.10.60:
cd ~/lkd_kernels
wget https://mirrors.edge.kernel.org/pub/linux/kernel/v5.x/linux-5.10.60.tar.xz
Notice that here we have simply used the wget utility to bring in the compressed kernel source tree; there are several alternate ways (including using git).
Note
As you'll know, the number in parentheses following the command name – for example, wget(1) – is the section within the manual or man pages where documentation on this command can be found.
- Extract the kernel source tree:
tar xf linux-5.10.60.tar.xz --directory=productionk/
- Switch to the directory it's just been extracted into (using
cd linux-5.10.60) and briefly verify the kernel version information as shown in the following screenshot:
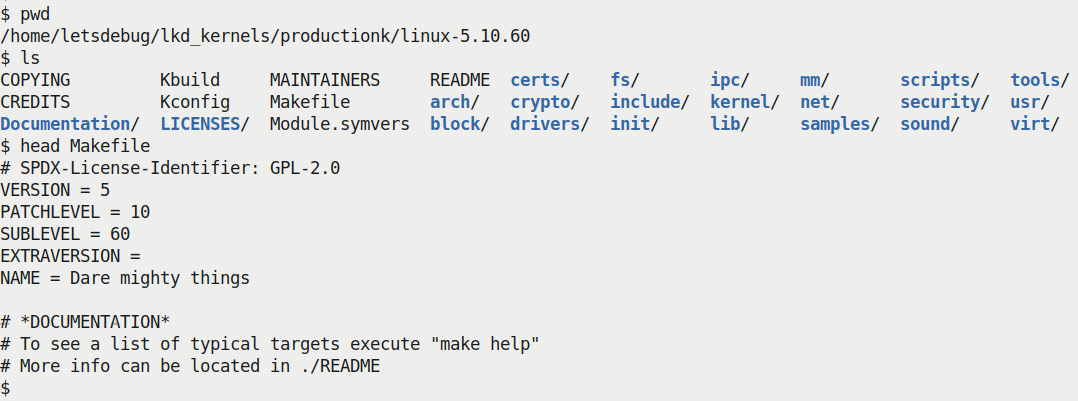
Figure 1.2 – Screenshot of the LTS kernel source tree
Every kernel version is christened with a (rather exotic) name; our 5.10.60 LTS kernel has an appropriately nice name – Dare mighty things – don't you think?
- Configure for appropriate defaults. This is what you can do to obtain a decent, tuned starting point for the kernel config based on the current config:
lsmod > /tmp/lsmod.now
make LSMOD=/tmp/lsmod.now localmodconfig
Note
The preceding command might interactively ask you to specify some choices; just selecting the defaults (by pressing the Enter key) is fine for now. The end result is the kernel configuration file saved as
.configin the root of the kernel source tree (the current directory).
We back up the config file as follows:
cp –af .config ~/lkd_kernels/kconfig_prod01
Tip
You can always do make help to see the various options (including config) available; experienced readers can use alternate config options that better suit their project.
Before jumping into the building of our production kernel, it's really important to consider the security aspect. Let's first configure our kernel to be more secure, hardened.
Securing your production kernel
With security being a major concern, the modern Linux kernel has many security and kernel hardening features. The thing is, there always tends to be a trade-off between security and convenience/performance. Thus, many of these hardening features are off by default; several are designed as an opt-in system: if you want it, turn it on by selecting it from the kernel config menu (via the familiar make menuconfig UI). It makes sense to do this, especially on a production kernel.
The question is: how will I know exactly which config features regarding security to turn on or off? There's literature on this and, better, some utility scripts that examine your existing kernel config and can make recommendations based on existing state-of-the-art security best practices! One such tool is Alexander Popov's kconfig-hardened-check Python script (https://github.com/a13xp0p0v/kconfig-hardened-check). Here's a screenshot of installing and running it plus a portion of its output, when I ran it against my custom kernel configuration file:
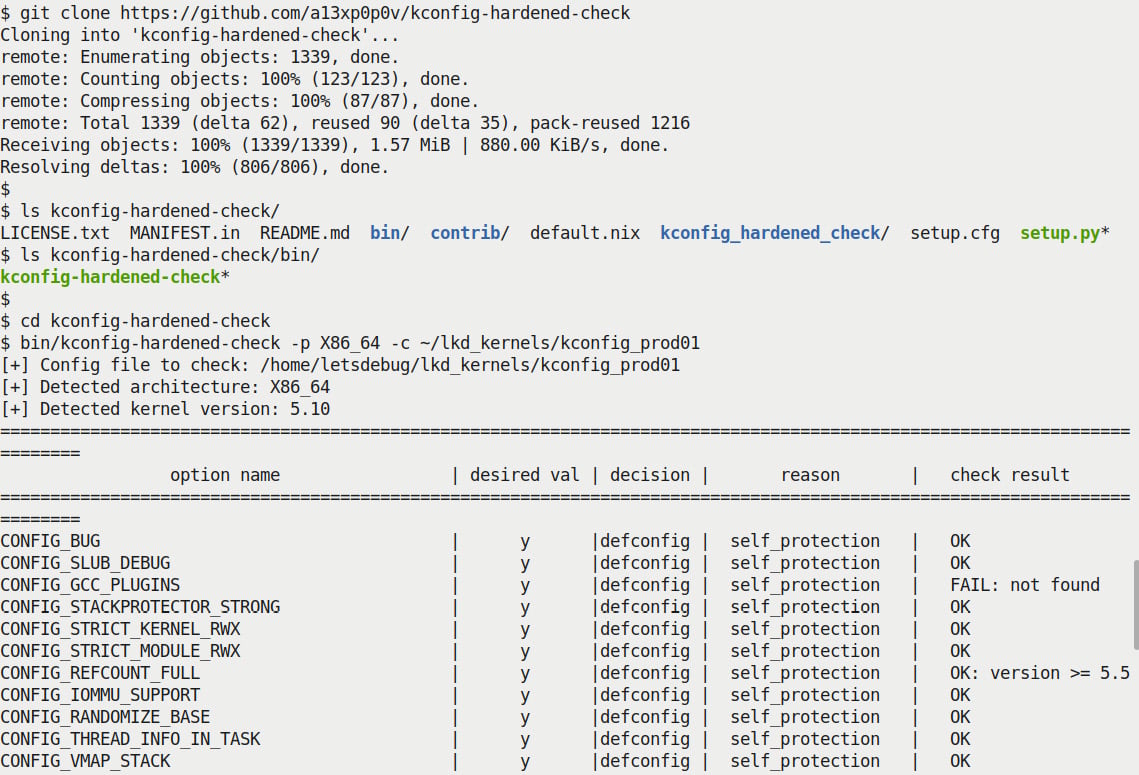
Figure 1.3 – Partial screenshot – truncated output from the kconfig-hardened-check script
(We won't be attempting to go into details regarding the useful kconfig-hardened-check script here, as it's beyond this book's scope. Do look up the GitHub link provided to see details.) Having followed most of the recommendations from this script, I generated a kernel config file:
$ ls -l .config
-rw-r--r-- 1 letsdebug letsdebug 156781 Aug 19 13:02
.config
$
Note
My kernel config file for the production kernel can be found in the book's GitHub code repository here: https://github.com/PacktPublishing/Linux-Kernel-Debugging/blob/main/ch1/kconfig_prod01. (FYI, the custom debug kernel config file that we'll be generating in the following section can be found within the same folder as well.)
Now that we have appropriately configured our custom production kernel, let's build it. The following commands should do the trick (with nproc helping us determine the number of CPU cores onboard):
$ nproc
4
$ make -j8
[ ... ]
BUILD   arch/x86/boot/bzImage
Kernel: arch/x86/boot/bzImage is ready  (#1)
$
Cross Compiling the kernel
If you're working on a typical embedded Linux project, you will need to install an appropriate toolchain and cross-compile the kernel. As well, you'd set the environment variable ARCH to the machine type (for example, ARCH=arm64) and the environment variable CROSS_COMPILE to the cross-compiler prefix (for example, CROSS_COMPILE=aarch64-none-linux-gnu-). Your typical embedded Linux builder systems – Yocto and Buildroot being very common – pretty much automatically take care of this.
As you can see, as a rule of thumb, we set the number of jobs to execute as twice the number of CPU cores available via the make option switch -j. The build should complete in a few minutes. Once done, let's check that the compressed and uncompressed kernel image files have been generated:
$ ls -lh arch/x86/boot/bzImage vmlinux
-rw-r--r-- 1 letsdebug letsdebug 9.1M Aug 19 17:21
arch/x86/boot/bzImage
-rwxr-xr-x 1 letsdebug letsdebug  65M Aug 19 17:21 vmlinux
$
Note that it's always only the first file, bzImage – the compressed kernel image – that we shall boot from. Then what's the second image, vmlinux, for? Very relevant here: it's what we shall (later) often require when we need to perform kernel debugging! It's the one that holds all the symbolic information, after all.
Our production kernel config will typically cause several kernel modules to be generated within the kernel source tree. They have to be installed in a well-known location (/lib/modules/$(uname –r)); this is achieved by doing the following, as root:
$ sudo make modules_install
[sudo] password for letsdebug: xxxxxxxxxxxxxxxx
  INSTALL arch/x86/crypto/aesni-intel.ko
  INSTALL arch/x86/crypto/crc32-pclmul.ko
[ ... ]
   DEPMOD  5.10.60-prod01
$ ls /lib/modules/
5.10.60-prod01/  5.11.0-27-generic/  5.8.0-43-generic/
$ ls /lib/modules/5.10.60-prod01/
build@  modules.alias.bin modules.builtin.bin modules.dep.bin  modules.softdep source@ kernel/        modules.builtin  modules.builtin.modinfo  modules.devname  modules.symbols modules.alias  modules.builtin.alias.bin  modules.dep modules.order modules.symbols.bin
$
For the final step, we make use of an internal script to generate the initramfs image and set up the bootloader (in this case, on our x86_64, it's GRUB) by simply running the following:
sudo make install
For details and a conceptual understanding of the initial RAM disk, as well as some basic GRUB tuning, do see the Linux Kernel Programming book. We also provide useful references within the Further reading section of this chapter.
Now all that's left to do is reboot your guest (or native) system, interrupt the bootloader (typically by holding the Shift key down during early boot; this can vary if you're booting via UEFI though), and select the newly built production kernel:
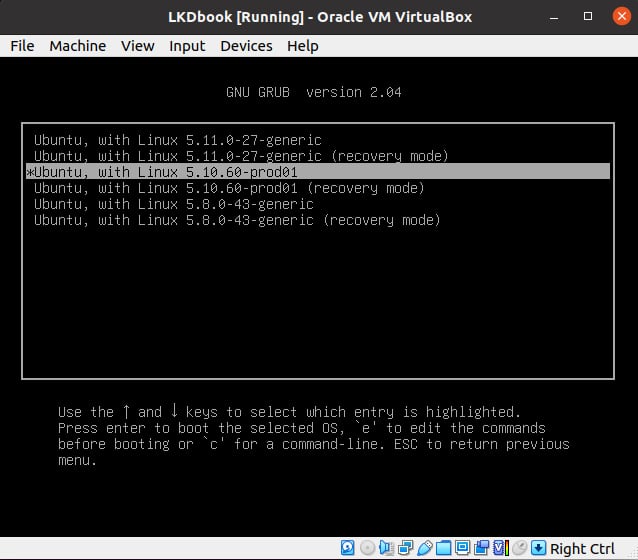
Figure 1.4 – Screenshot showing the GRUB bootloader screen and the new production kernel to boot from
As you can see from the preceding screenshot, I'm running the system as a guest OS via Oracle VirtualBox. I selected the new production kernel and pressed Enter to boot into it.
Voila, we're now running our (guest) system with our brand new production kernel:
$ uname -a
Linux dbg-LKD 5.10.60-prod01 #1 SMP PREEMPT Thu Aug 19 17:10:00 IST 2021 x86_64 x86_64 x86_64 GNU/Linux
$
Working on the guest over SSH
The new Linux kernel should run just fine with the existing root filesystem – the libraries and applications are loosely coupled with the OS, allowing different versions of the kernel (one at a time, of course) to simply mount the root filesystem and use them. Also, you may not get all the bells and whistles; for example, on my guest OS with our new production kernel, the screen resizing, shared folders, and such, features may not work. How come? They depend on the guest additions whose kernel modules haven't been built for this custom kernel. In this case, I find it a lot easier to work on the guest using the console over SSH. To do so, I installed the dropbear lightweight SSH server on the guest and then logged in over SSH from my host system. Windows users might like to try an SSH client such as putty. (In addition, you might need to set up another bridged mode network adapter on the Linux guest.)
You can (re)check the current kernel's configuration by looking up /boot/config-$(uname –r). In this case, it should be that of our production kernel, tuned towards security and performance.
Tip
To have the GRUB bootloader prompt always show up at boot: make a copy of /etc/default/grub (to be safe), then edit it as root, adding the line GRUB_HIDDEN_TIMEOUT_QUIET=false and (possibly) commenting out the line GRUB_TIMEOUT_STYLE=hidden.
Change the GRUB_TIMEOUT value from 0 to 3 (seconds). Run sudo update-grub to have the changes take effect, and reboot to test.
So, good, you now have your guest (or native) Linux OS running a new production kernel. During the course of this book, you will encounter various kernel-level bugs while running this kernel. Identifying the bug(s) will often – though not always – involve you booting via the debug kernel instead. So, let's now move on to creating a custom debug kernel for the system. Read on!
Setting up our custom debug kernel
As you have already set up a production kernel (as described in detail in the previous section), I won't repeat every step in detail here, just the ones that differ:
- Firstly, ensure you have booted into the production kernel that you built in the previous section. This is to ensure that our debug kernel config uses it as a starting point:
$ uname –r
5.10.60-prod01
- Create a new working directory and extract the same kernel version again. It's important to build the debug kernel in a separate workspace from that of the production one. True, it takes a lot more disk space but it keeps them clean and from stepping on each other's toes as you modify their configs:
mkdir –p ~/lkd_kernels/debugk
- We already have the kernel source tree (we earlier used
wgetto bring in the 5.10.60 compressed source). Let's reuse it, this time extracting it into the debug kernel work folder:cd ~/lkd_kernels tar xf linux-5.10.60.tar.xz --directory=debugk/
- Switch to the debug kernel directory and set up a starting point for kernel config – via the
localmodconfigapproach – just as we did for the production kernel. This time though, the config will be based on that of our custom production kernel, as that's what is running right now:cd ~/lkd_kernels/debugk/linux-5.10.60 lsmod > /tmp/lsmod.now make LSMOD=/tmp/lsmod.now localmodconfig
- As this is a debug kernel, we now configure it with the express purpose of turning on the kernel's debug infrastructure as much as is useful. (Though we do not care that much for performance and/or security, the fact is that as we're inheriting the config from the production kernel, the security features are enabled by default.)
The interface we use to configure our debug kernel is the usual one:
make menuconfig
Much (if not most) of the kernel debug infrastructure can be found in the last main menu item here – the one named Kernel hacking:
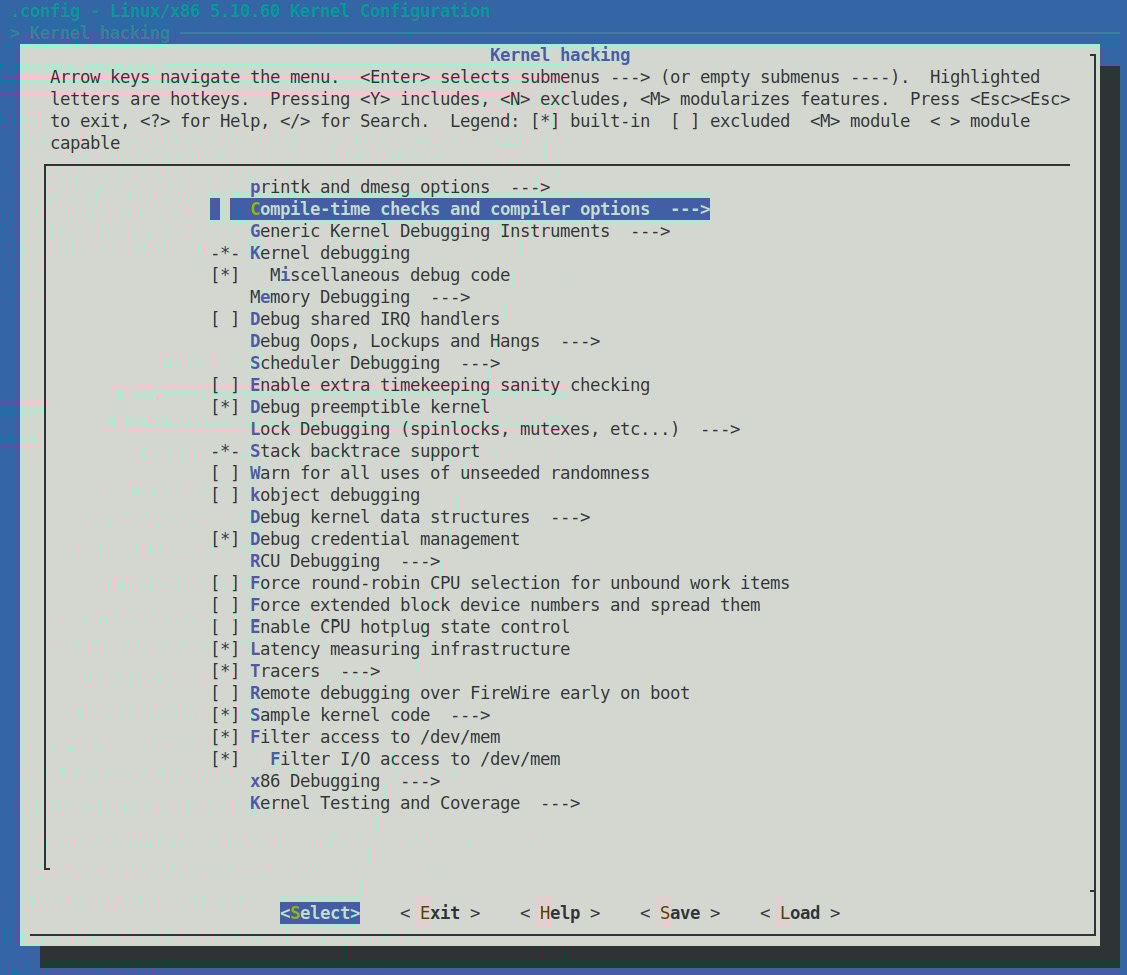
Figure 1.5 – Screenshot: make menuconfig / Kernel hacking – the majority of kernel debug options live here
There are just too many kernel configs relating to debugging to discuss individually here and now; several of them are important kernel debug features that we will explain and make use of in the chapters that follow. The following table (Table 1.1) summarizes some of the kernel config variables that we set or clear, depending on whether the config is for the debug or the production kernel. It is by no means exhaustive.
Not all of the config changes we make are within the Kernel hacking menu; others are changed as well (see the merged column rows in the table – for example, the first one is General setup: init/Kconfig, which specifies from which menu they originate as well as the Kconfig file(s) that they originate from).
Further, the <D> in the Typical, value, … columns indicates that the decision is left to you (or the platform/BSP team) as the particular value to use does depend on the actual product or project, its High Availability (HA) characteristics, security posture, and so on.
Tip
You can search within the make menuconfig UI for a given config variable (CONFIG_XXX) by typing the key / (just as in vi!) and then typing the string to search for.
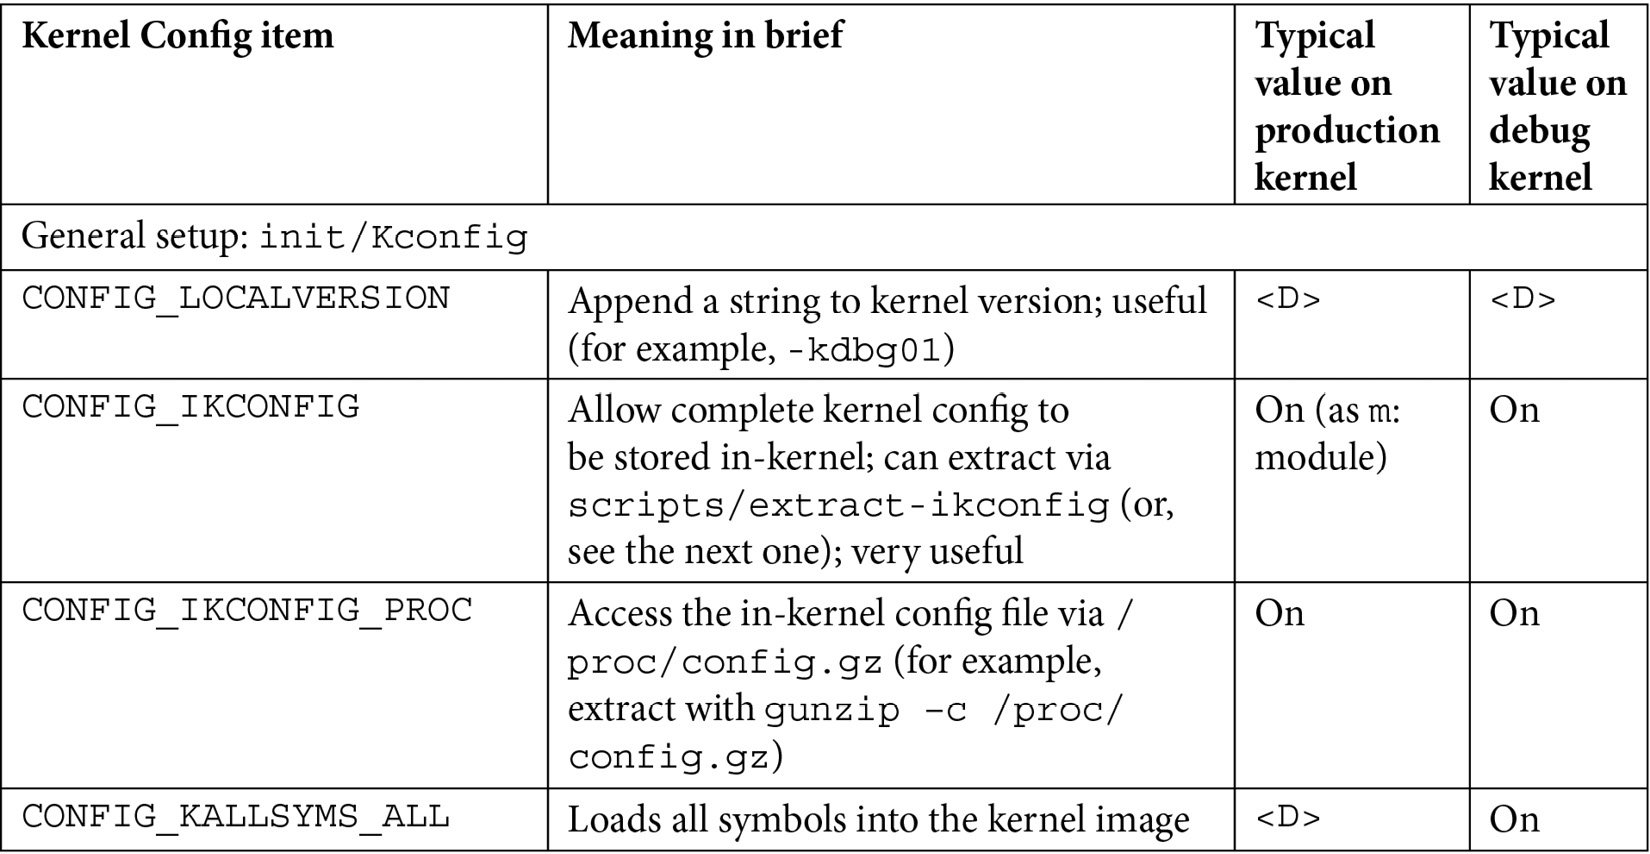
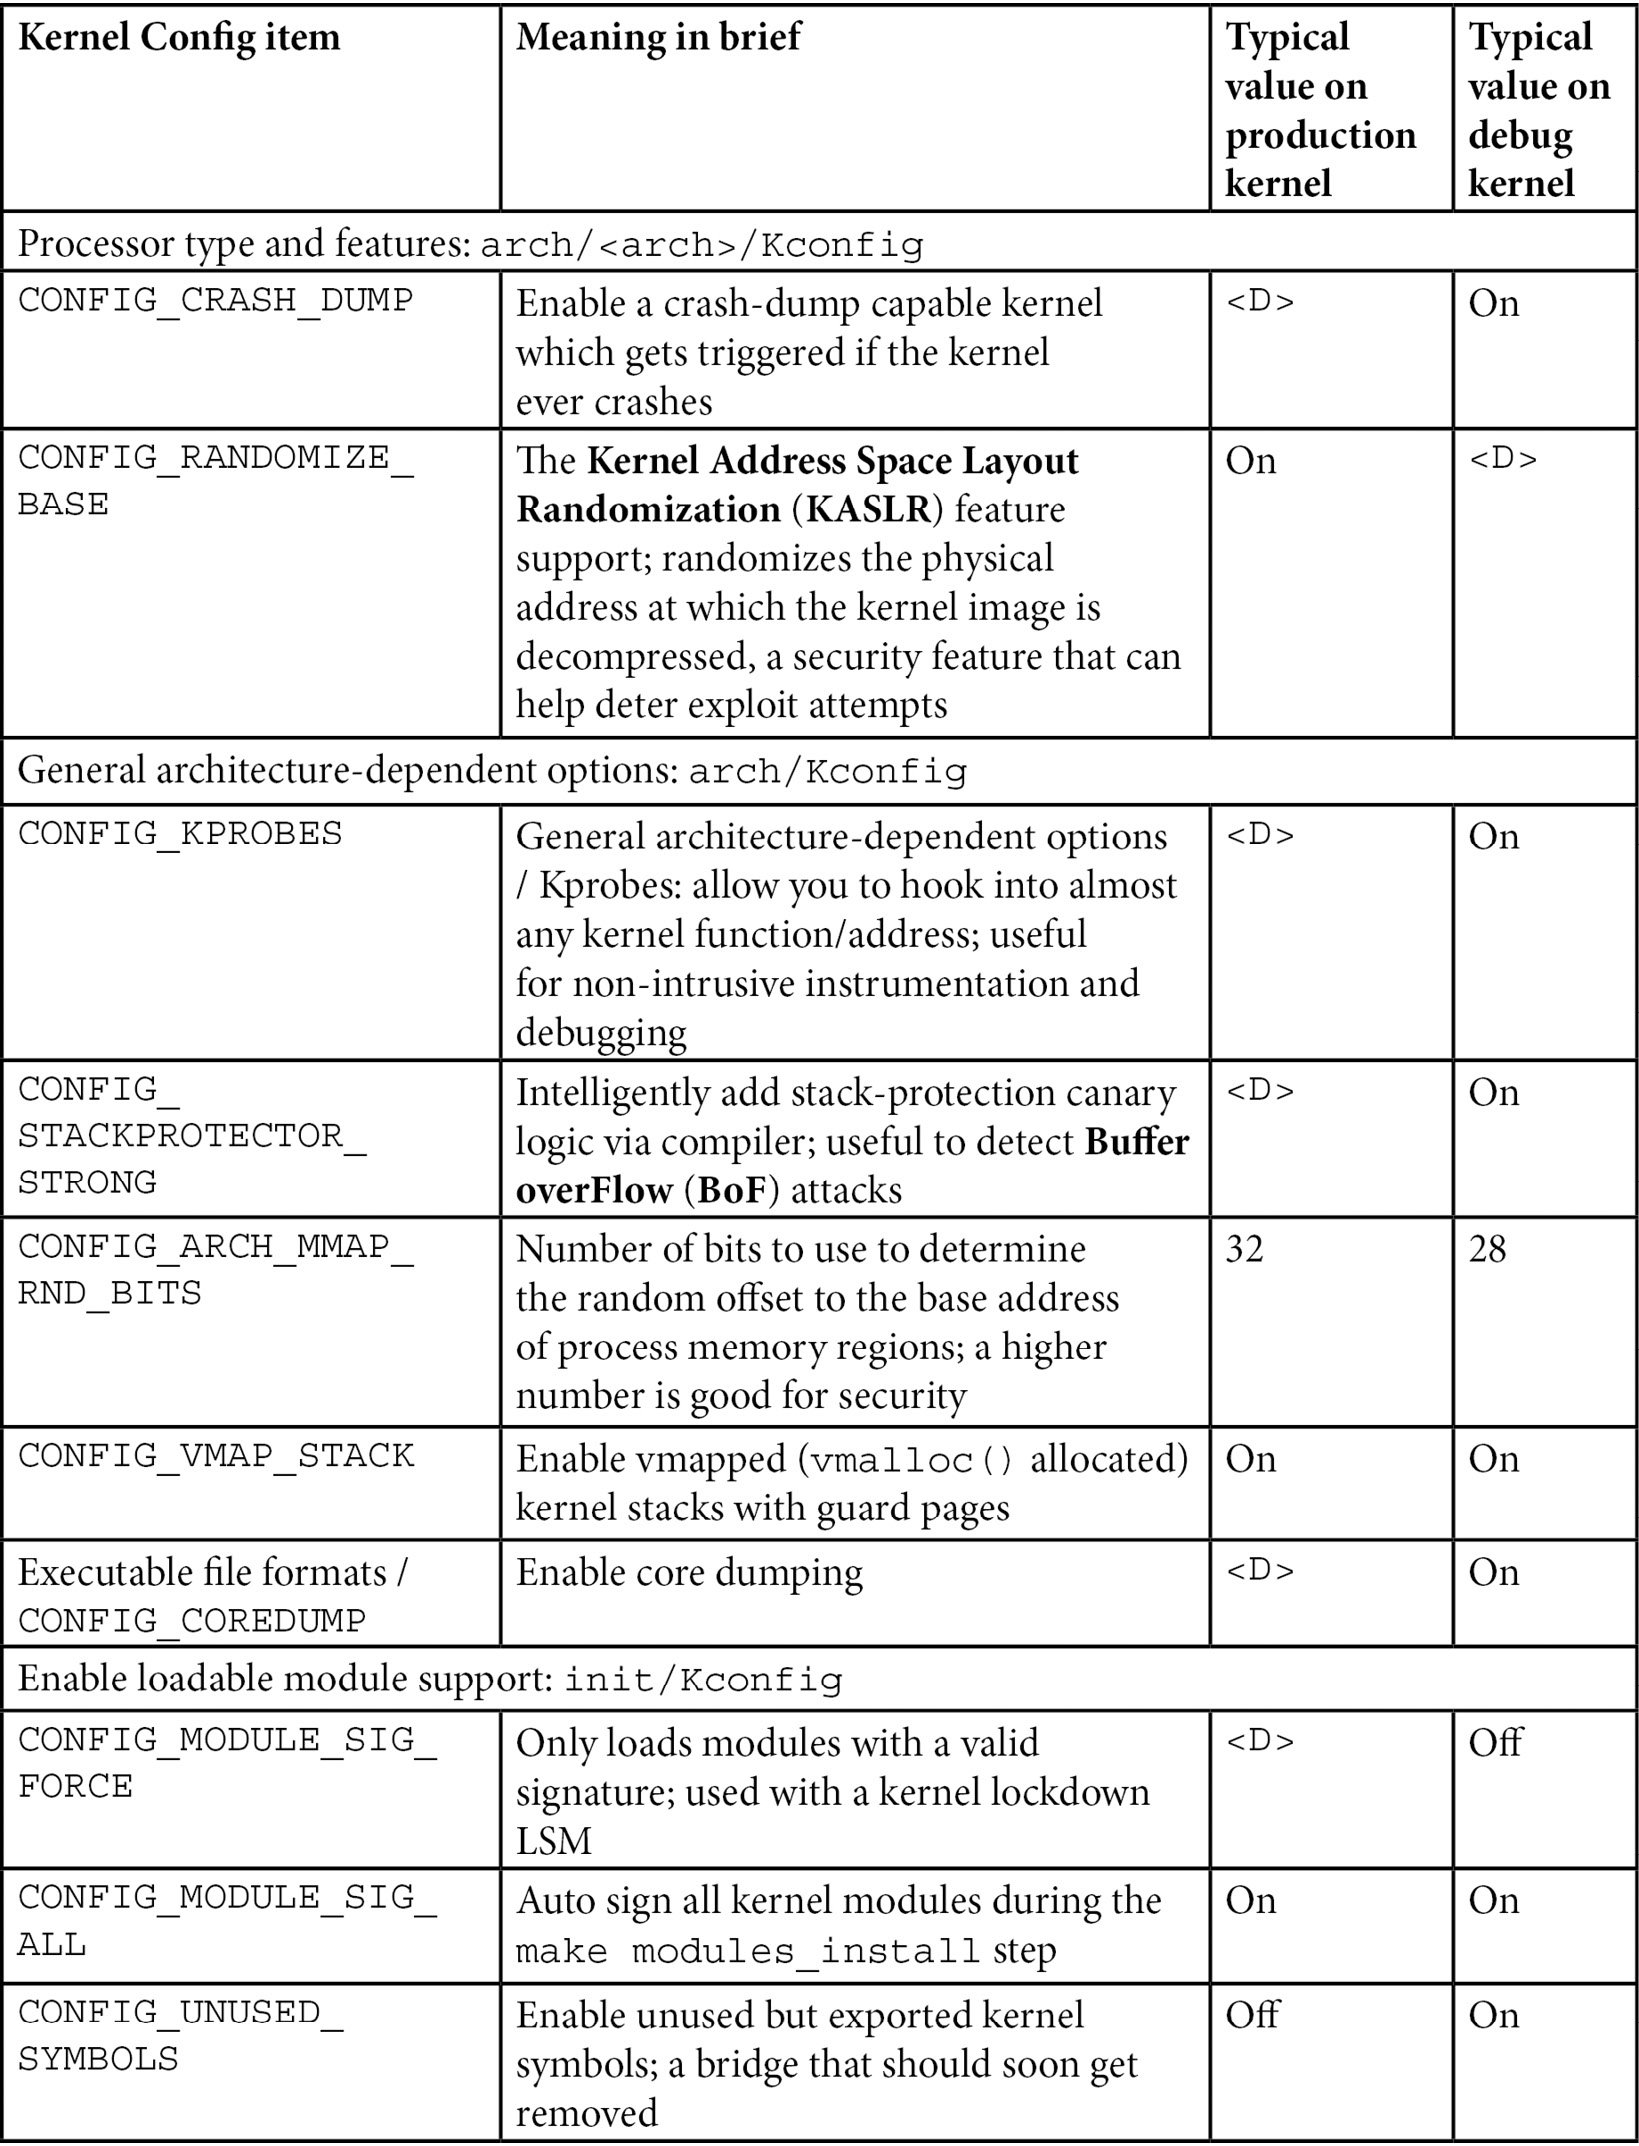
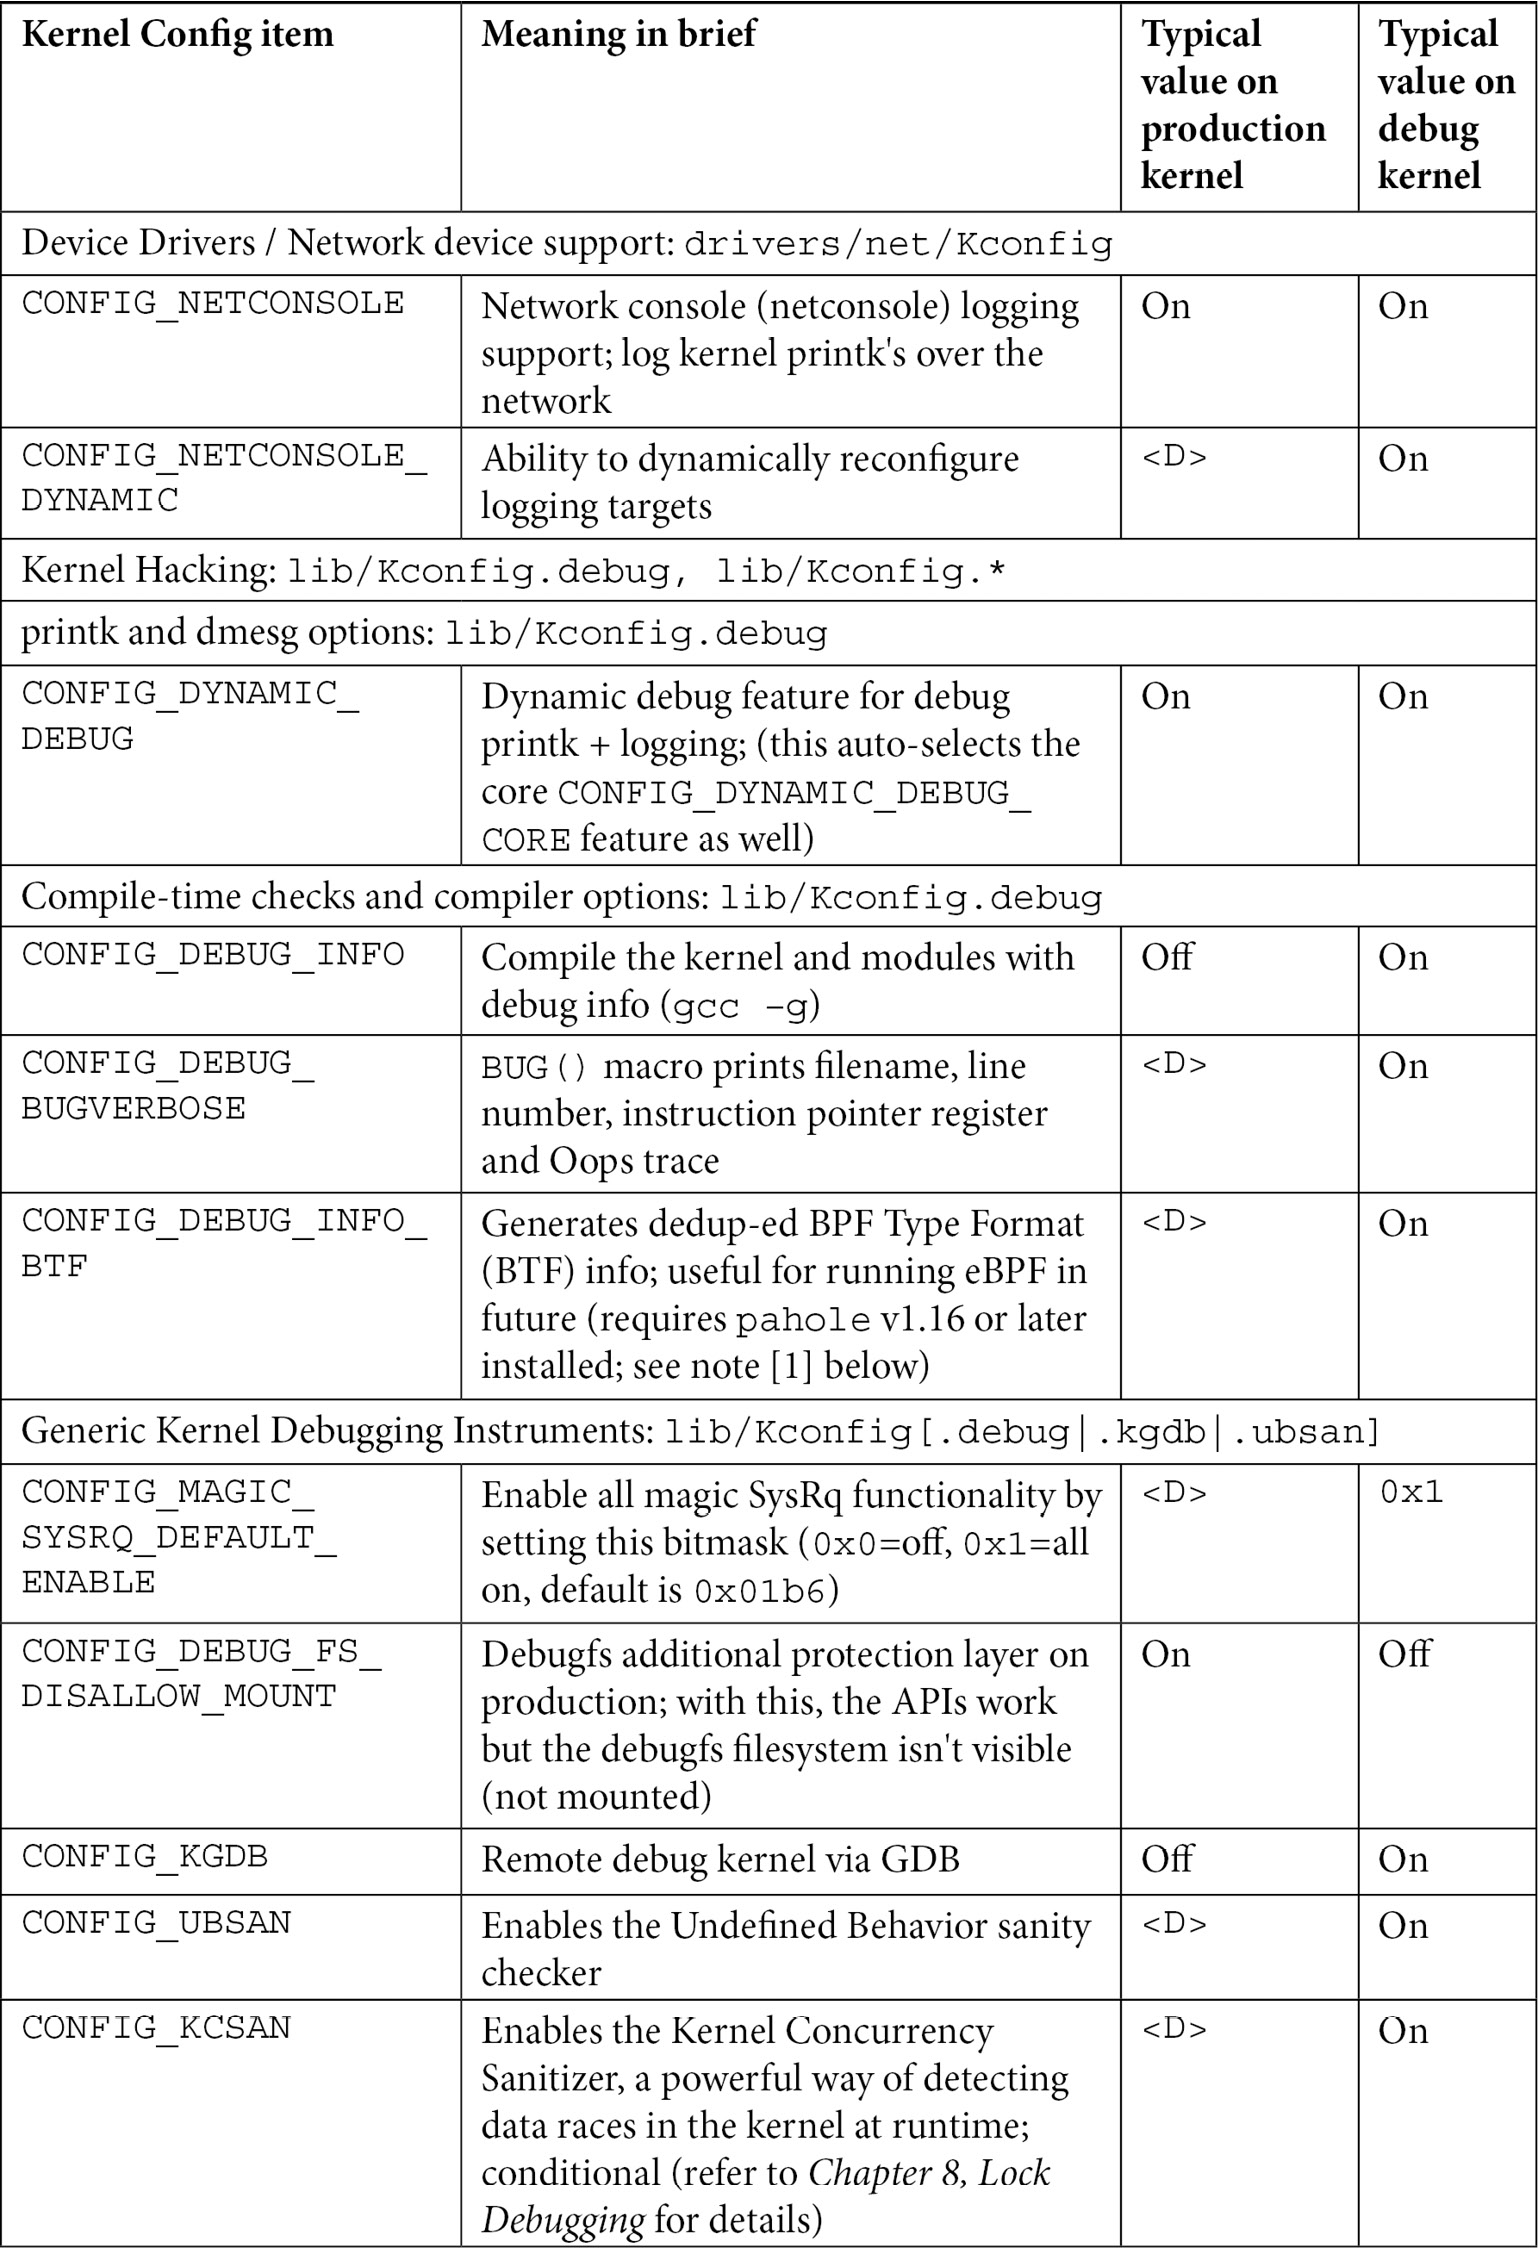
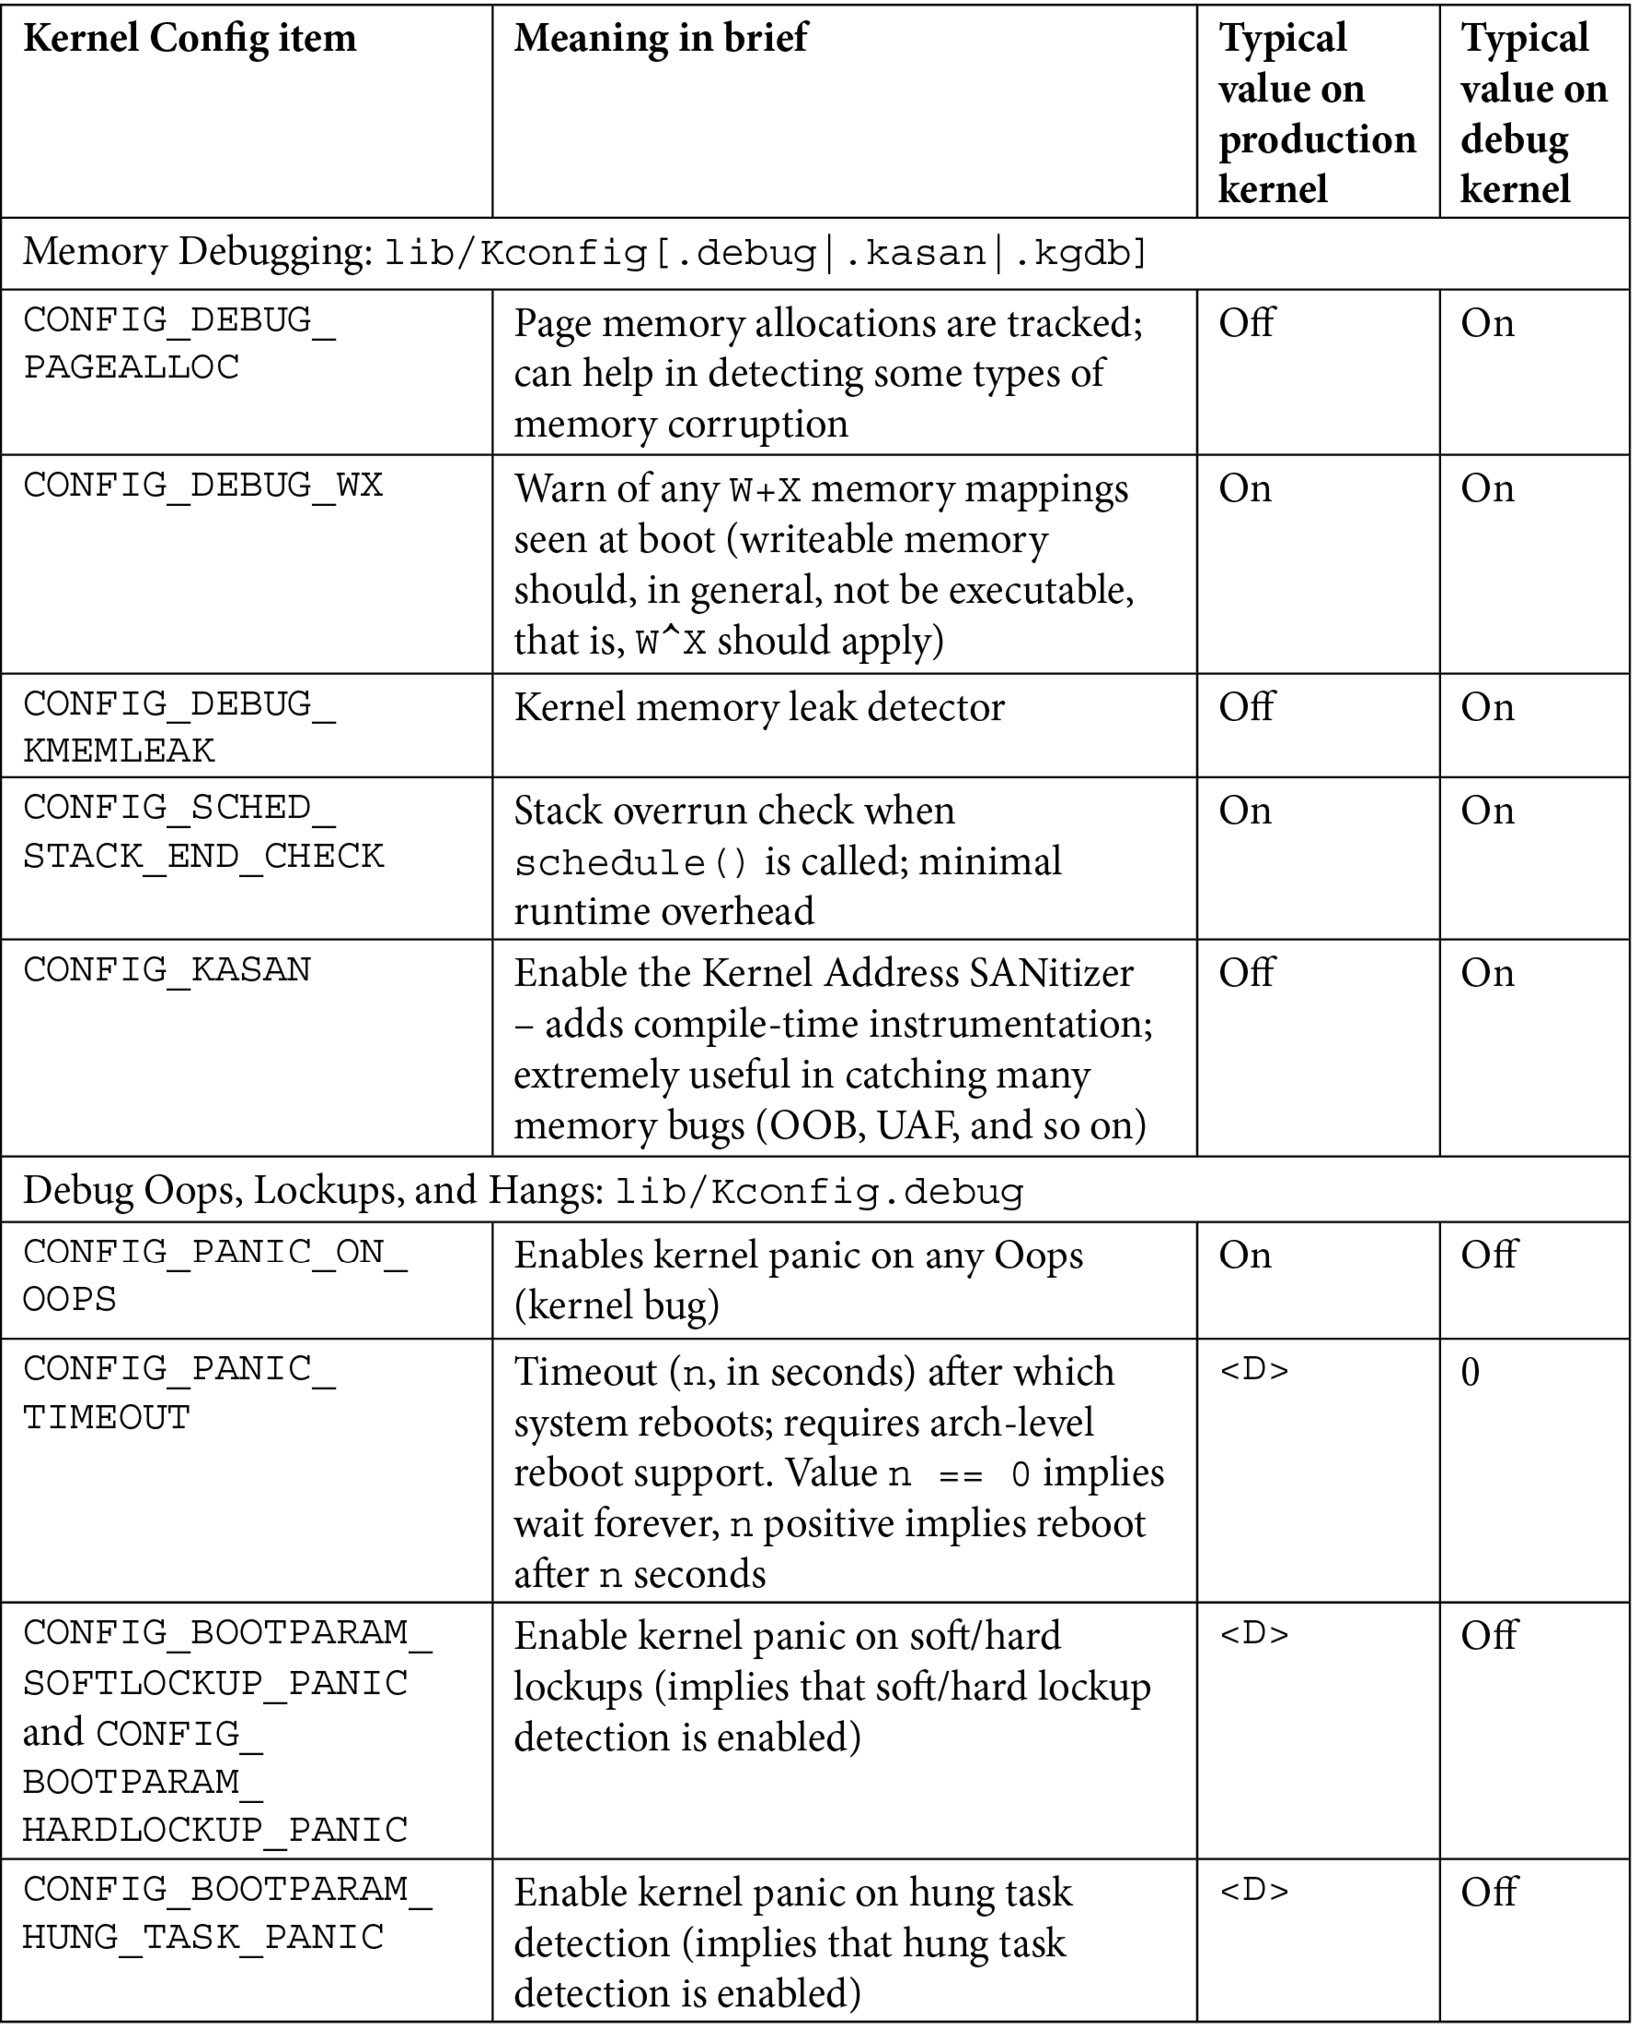
Table 1.1 – Summary of a few kernel config variables, their meaning, and value
Besides the <D> value, the other values shown in the preceding table are merely my recommendations: they may or may not be suitable for your particular use case.
[1] Installing pahole v1.16 or later: pahole is part of the dwarves package. However, on Ubuntu 20.04 (or older), it's version 1.15, which causes the kernel build – when enabled with CONFIG_DEBUG_INFO_BTF – to fail. This is because pahole version 1.16 or later is required. To address this on Ubuntu 20.04, we've provided the v1.17 Debian package in the root of the GitHub source tree. Install it manually as follows:
sudo dpkg –i dwarves_1.17-1_amd64.deb
Viewing the current kernel config
Being able to view (query) the currently running kernel's configuration can prove to be a very useful thing, especially on production systems. This can be done by looking up (grepping) /proc/config.gz (a simple zcat /proc/config.gz | grep CONFIG_<FOO> is typical). The pseudofile /proc/config.gz contains the entire kernel config (it's practically equivalent to the .config file within the kernel source tree). Now, this pseudofile is only generated by setting CONFIG_IKCONFIG=y. As a safety measure on production systems, we set this config to the value m in production, implying that it's available as a kernel module (called configs). Only once you load this module does the /proc/config.gz file become visible; and of course, to load it up you require root access...
Here's an example of loading the configs kernel module and then querying the kernel config (for this very feature!):
$ ls -l /proc/config.gz
ls: cannot access '/proc/config.gz': No such file or directory
OK, to begin with (in production), it doesn't show up. So do this:
$ sudo modprobe configs
$ ls -l /proc/config.gz
-r--r--r-- 1 root root 34720 Oct  5 19:35 /proc/config.gz
$ zcat /proc/config.gz |grep IKCONFIG
CONFIG_IKCONFIG=m
CONFIG_IKCONFIG_PROC=y
Ah, it now works just fine!
Food for Thought
Did you notice? In Table 1.1, I set the production kernel's value for CONFIG_KALLSYMS_ALL as <D>, implying it's up to the system architects to decide whether to keep it on or off. Why? Shouldn't the ability to view all kernel symbols be disabled (off) in a production system? Well, yes, that's the common decision. Recall, though, our brief on the Mars Pathfinder mission, where it initially failed due to a priority inversion issue. The tech lead of the software team at JPL, Glenn Reeves, made a very interesting statement in his now-famous response to Mike Jones (https://www.cs.unc.edu/~anderson/teach/comp790/papers/mars_pathfinder_long_version.html): The software that flies on Mars Pathfinder has several debug features within it that are used in the lab but are not used on the flight spacecraft (not used because some of them produce more information than we can send back to Earth). These features were not "fortuitously" left enabled but remain in the software by design. We strongly believe in the "test what you fly and fly what you test" philosophy.
Sometimes, keeping debug features (and of course, logging) turned on in the production version of the system, can be immensely helpful!
For now, don't stress too much about exactly what each of these kernel debug options means and how you're to use them; we shall cover most of these kernel debug options in the coming chapters. The entries in Table 1.1 are meant to kickstart the configuration of your production and debug kernels and give you a brief idea of their effect.
Once you're done generating the new debug kernel config, let's back it up as follows:
cp –af .config ~/lkd_kernels/kconfig_dbg01
Build it, as before: make -j8 all (adjust the parameter to –j based on the number of CPU cores on your box). When done, check out the compressed and uncompressed kernel image files:
$ ls -lh arch/x86/boot/bzImage vmlinux
-rw-r--r-- 1 letsdebug letsdebug  18M Aug 20 12:35 arch/x86/boot/bzImage
-rwxr-xr-x 1 letsdebug letsdebug 1.1G Aug 20 12:35 vmlinux
$
Did you notice? The size of the vmlinux uncompressed kernel binary image file is huge. How come? All the debug features plus all the kernel symbols account for this large size...
Finish off by installing the kernel modules, initramfs, and bootloader update, as earlier:
sudo make modules_install && sudo make install
Great; now that you're done configuring both the production and debug kernels, let's briefly examine the difference between the configurations.
Seeing the difference – production and debug kernel config
It's enlightening – and really, it's the key thing within this particular topic – to see the differences between our original production and the just-built debug kernel configuration. This is made easy via the convenience script scripts/diffconfig; from within the debug kernel source tree, simply do this to generate the difference:
scripts/diffconfig ~/lkd_kernels/kconfig_prod01 ~/lkd_kernels/kconfig_dbg01 > ../../kconfig_diff_prod_to_debug.txt
View the output file in an editor, seeing for yourself the changes we wrought in configuration. There are indeed many deltas – on my system, the diff file exceeds 200 lines. Here's a partial look at the same on my system (I use the ellipse [ … ] to denote skipping some output):
$ cat kconfig_diff_prod_to_debug.txt
-BPF_LSM y
-DEFAULT_SECURITY_APPARMOR y
-DEFAULT_SECURITY_SELINUX n
-DEFAULT_SECURITY_SMACK n
[ … ]
The - (minus sign) prefixing each of the preceding lines indicates that we removed this kernel config feature from the debug kernel. The output continues as follows:
DEBUG_ATOMIC_SLEEP n -> y
DEBUG_BOOT_PARAMS n -> y
DEBUG_INFO n -> y
DEBUG_KMEMLEAK n -> y
DEBUG_LOCK_ALLOC n -> y
DEBUG_MUTEXES n -> y
DEBUG_PLIST n -> y
DEBUG_RT_MUTEXES n -> y
DEBUG_RWSEMS n -> y
DEBUG_SPINLOCK n -> y
[ … ]
In the preceding code snippet, you can clearly see the change made from the production to the debug kernel; for example, the first line tells us that the kernel config named DEBUG_ATOMIC_SLEEP was disabled in the production kernel and we've not enabled it (n->y) in the debug kernel! (Note that it will be prefixed with CONFIG_, that is, it will show up as CONFIG_DEBUG_ATOMIC_SLEEP in the kernel config file itself.)
Here, we can see how the suffix to the name of the kernel – the config directive named CONFIG_LOCALVERSION – has been changed between the two kernels, besides other things:
LKDTM n -> m
LOCALVERSION "-prod01" -> "-dbg01"
LOCK_STAT n -> y
MMIOTRACE n -> y
MODULE_SIG y -> n
[ … ]
The + prefix to each line indicates the feature that has been added to the debug kernel:
+ARCH_HAS_EARLY_DEBUG y
+BITFIELD_KUNIT n
[ … ]
+IKCONFIG m
+KASAN_GENERIC y
[ … ]
In closing, it's important to realize these things:
- The particulars of the kernel configuration we're performing here – for both our production and debug kernels – is merely representative; your project or product requirements might dictate a different config.
- Many, if not most, modern embedded Linux projects typically employ a sophisticated builder tool or environment; Yocto and Buildroot are two common de facto examples. In such cases, you will have to adapt the instructions given here to cater to using these build environments (in the case of Yocto, this can become a good deal of work in specifying an alternate kernel configuration via a BB-append-style recipe).
By now, I am furtively hoping you've absorbed this material and, indeed, built yourself two custom kernels – a production and a debug one. If not, I request that you please do so before proceeding further.
So, great – well done! By now, you have both a custom 5.10 LTS production and debug kernel ready to rip. We'll certainly make use of them in the coming chapters. Let's finish this chapter with a few debug "tips" that I hope you'll find useful.
Debugging – a few quick tips
I'll start off by saying this: debugging is both a science and an art, refined by experience – the mundane hands-on slogging through to reproduce and identify a bug and its root cause, and (possibly) fix it. I'm of the opinion that the following few debug tips are really nothing new; that said, we do tend to get caught up in the moment and often miss the obvious. The hope is that you'll find these tips useful and return to them time and again!
- Assumptions – just say NO!
Churchill famously said, "Never, never, never, give up". We say "Never, never, never, make assumptions".
Assumptions are, very often, the root cause behind many, many bugs and defects. Think back, re-read the Software bugs – a few actual cases section!
In fact (hey, I am partially joking here), just look at the word assume: it just begs saying, "Don't make an ASS out of U and ME"!
Using assertions in your code is a great way to catch assumptions. The userspace way is to use the assert() macro. It's well documented in the man page. (We cover more on using macros within the kernel in Chapter 12, A Few More Kernel Debugging Approaches, in the Assertions, warnings and BUG() macros section).
- Don't lose the forest for the trees!
At times, we do get lost in the twisted mazes of complex code paths. In these circumstances, it's really easy to lose sight of the big idea, the objective of the code. Try and zoom out and think of the bigger picture. It often helps spot the faulty assumption(s) that led to the error(s). Well-written documentation can be a lifesaver.
- Think small
When faced with a difficult bug, try this: build/configure/get the smallest possible version of your problem (statement) to execute causing the issue or bug you're currently facing to surface. This often helps you track down the root cause of the problem. In fact, very often (in my own experience), the mere act of doing this – or even just the detailed jotting down of the problem you face – triggers you seeing the actual issue and its solution in your mind!
- "It requires twice the brainpower to debug a piece of code than to write it"
This paraphrased quote is by Brian Kernighan in the book The Elements of Programming Style. So, should we not use our full brainpower while writing code? Ha, of course you should... But, debugging is typically harder than writing code. The real point is this: take the trouble to first carefully do your groundwork: write a brief very high-level design document and write what you expect the code to do, at a high level of abstraction. Then move on to the specifics (with a so-called low-level design doc). Good documentation will save you one day (and blessings shall be showered upon you!).
That reminds me of another quote: An ounce of design is worth a pound of refactoring – Karl Wiegers.
- Employ "Zen Mind, Beginner's Mind"
Sometimes, the code can become too complex (spaghetti-like; it just smells). In many cases, just giving up and starting from scratch again, if viable, is perhaps the best thing to do.
This Zen-Beginner's Mind state also implies that we at least temporarily stop our (perhaps over-egotistical) thought patterns (I wrote this so well, how can it be wrong!?) and look at the situation from the point of view of somebody completely new to it. It is, in fact, one key reason why a colleague reviewing your code can spot bugs you'd never see! Plus, a good night's rest can do wonders.
- Variable naming, comments
I recall a Q&A on Quora revealing that the hardest thing a programmer does is name variables well! This is truer than it might appear at first glance. Variable names stick; choose yours carefully. As with commenting, don't go overboard either: a local variable for a loop index? int i is just fine (int theloopindex is just painful). The same goes for comments: they're there to explain the rationale, the design behind the code, what it's designed and implemented to achieve, not how the code works. Any competent programmer can figure that out.
- Ignore logs at your peril!
It's self-evident perhaps, but we can often miss the obvious when under pressure... Carefully checking kernel (and even app) logs often reveals the source of the issue you might be facing. Logs are usually able to be displayed in reverse-chronological order and give you a view of what actually occurred; Linux's systemd journalctl(1) utility is powerful; learn how to leverage it!
- Testing can reveal the presence of errors but not their absence
A truism, unfortunately. Still, testing and QA is simply one of the most critical parts of the software process; ignore it at your peril! The time and the trouble taken to write exhaustive test cases – both positive and negative – pays off in large dividends in the long run, helping make the product or project a grand success. Negative test cases and fuzzing are critical for exposing (and subsequently fixing) security vulnerabilities in the code base. Then again, runtime testing only tests the portions of code actually executed. Take the trouble to perform code coverage analysis; 100% code coverage – and runtime testing it is the objective! (Again, we cover more on these key points in Chapter 12, A Few More Kernel Debugging Approaches, in the An introduction to kernel code coverage tools and testing frameworks section).
- Incurring technical debt
Every now and then, you realize deep down that though what you've coded works, it's not been done well enough (perhaps there still exist corner cases that will trigger bugs or undefined behavior); that nagging feeling that perhaps this design and implementation simply isn't the best. The temptation to quickly check it in and hope for the best can be high, especially as deadlines loom! Please don't; there is really a thing called technical debt. It will come and get you.
- Silly mistakes
If I had a penny for each time I've made really silly mistakes when developing code, I'd be a rich man! For instance, I once spent nearly half a day racking my head about why my C program would just refuse to work correctly until I realized I was editing the correct code but compiling an old version of it – performing the build in the wrong directory! (I am certain you've faced your share of such pesky frustrations.) Often, a break, a good night's sleep, can do wonders.
- Empirical model
The word empirical means to validate something (anything) by actual and direct observation or experience rather than relying on theory.
Figure 1.6 – Be empirical!
So, don't believe the book (this one is an exception of course!), don't believe the tutorial, the article, blog, tutor, or author: be empirical – try it out and see for yourself!
Years (decades, actually) back, on my very first day of work at a company I joined, a colleague emailed me a document that I still hold dear: The Ten Commandments for C Programmers, by Henry Spencer (https://www.electronicsweekly.com/open-source-engineering/linux/the-ten-commandments-for-c-programmers-2009-04/). Do check it out. In a similar, albeit clumsier, manner, I present a quick checklist for you.
A programmer's checklist – seven rules
Very important! Did you remember to do the following?:
- Check all APIs for their failure case.
- Compile with warnings on (definitely with
-Walland possibly-Wextraor even-Werror; yes, treating warnings as errors is going to make its way into the kernel!); eliminate all warnings as far as is possible. - Never trust (user) input; validate it.
- Eliminate unused (or dead) code from the code base immediately.
- Test thoroughly; 100% code coverage is the objective. Take the time and trouble to learn how to use powerful tools: memory checkers, static and dynamic analyzers, security checkers (
checksec,lynis, and several others), fuzzers, code coverage tools, fault injection frameworks, and so on. Don't ignore security! - With regard to kernels and especially drivers, after eliminating software issues, be aware that (peripheral) hardware issues could be the root cause of the bug. Don't discount it out of hand! (You'll learn this the hard way.)
- Do not assume anything (assume: make an ASS out of U and ME); using assertions helps catch assumptions, and thus bugs.
We shall elaborate on several of these points in the coming material.
Summary
Firstly, congratulations on completing this, our first chapter. Getting started is half the battle! You began by learning a bit about how the word debug came to be – equal parts myth, legend, and truth...
A key section was the brief description of some complex real-world cases of software gone wrong (several of them very unfortunate tragedies), where a software bug (or bugs) proved to be a key factor behind the disaster.
You understood that we're using the latest (at the time of this writing) 5.10 LTS kernel and how to set up the workspace (on x86_64, using either a native Linux system or Linux running as a guest OS). We covered the configuring and building of two custom kernels – a production and a debug one, with the production kernel geared toward high performance and security whereas the debug one was configured with several (most) kernel debug features turned on, in order to help catch bugs. I will assume you've done this for yourself, as future chapters will depend on it.
Finally, and I think very importantly, a few debugging tips and a small checklist wrapped up this chapter. I urge you to read through the tips and checklist often.
In the next chapter, you will learn that there can be, and are indeed, various approaches to debugging the Linux kernel (and its modules); you'll learn about them and which to use.
Further reading
- Real-world stories of software going wrong – software horror stories:
- SOFTWARE HORROR STORIES: An old page, but still (mostly) valid and very interesting! Many, many incidents have been covered here; do take a gander: http://www.cs.tau.ac.il/~nachumd/horror.html
- Patriot missile battery failure: https://www-users.cse.umn.edu/~arnold/disasters/patriot.html
- Ariane 5 launcher crash:
- The official report – ARIANE 5 – Flight 501 Failure, by the Inquiry Board: http://sunnyday.mit.edu/nasa-class/Ariane5-report.html
- An excellent article on the same thing: Design by Contract: The Lessons of Ariane, Jean-Marc Jézéquel, Bertrand Meyer (the creator of the Eiffel programming language): https://archive.eiffel.com/doc/manuals/technology/contract/ariane/
- Mars Pathfinder reset issues:
- Priority inversion: https://en.wikipedia.org/wiki/Priority_inversion
- What really happened on Mars?, Glenn Reeves' detailed reply to Mike Jones' summary of the issue: https://www.cs.unc.edu/~anderson/teach/comp790/papers/mars_pathfinder_long_version.html
- What the Media Couldn't Tell You About Mars Pathfinder, Tom Durkin, 1998; PDF: https://people.cis.ksu.edu//~hatcliff/842/Docs/Course-Overview/pathfinder-robotmag.pdf
- Now showing on satellite TV: secret American spy photos, The Guardian, June 13, 2002: https://www.theguardian.com/media/2002/jun/13/terrorismandthemedia.broadcasting
- Software problem kills soldiers in training incident, June 13, 2002: http://catless.ncl.ac.uk/Risks/22.13.html#subj2.1
- Boeing 737 MAX and the MCAS:
- The inside story of MCAS: How Boeing's 737 MAX system gained power and lost safeguards, The Seattle Times, June 22, 2019: https://www.seattletimes.com/seattle-news/times-watchdog/the-inside-story-of-mcas-how-boeings-737-max-system-gained-power-and-lost-safeguards/
- Boeing 737 Max: why was it grounded, what has been fixed and is it enough?, The Conversation, Nov 28, 2020: https://theconversation.com/boeing-737-max-why-was-it-grounded-what-has-been-fixed-and-is-it-enough-150688
- As an aside, do watch Nat Geo's 'Air Crash Investigation' series: https://www.natgeotv.com/in/air-crash-investigation/about
- Recent: DOWNFALL: The Case Against Boeing | Official Trailer | Netflix, Feb 2022: https://www.youtube.com/watch?v=vt-IJkUbAxY
- Jack Ganssle's TEM (The Embedded Muse) newsletter – back issues: http://www.ganssle.com/tem-back.htm; excellent newsletters, do check it out
- Kernel and system workspace setup:
- Various good online articles and tutorials on installing Linux as a guest VM on Oracle VirtualBox can be found at https://github.com/PacktPublishing/Linux-Kernel-Programming/blob/master/Further_Reading.md#chapter-1-kernel-development-workspace-setup---further-reading
- Easy way to determine the virtualization technology of a Linux machine?, StackExchange: https://unix.stackexchange.com/questions/89714/easy-way-to-determine-the-virtualization-technology-of-a-linux-machine
- Ubuntu Linux – the System Requirements page: https://help.ubuntu.com/community/Installation/SystemRequirements
- Kernel documentation: Configuring the kernel (https://www.kernel.org/doc/html/latest/admin-guide/README.html#configuring-the-kernel)
- Article: How to compile a Linux kernel in the 21st century, S Kenlon, Aug 2019: https://opensource.com/article/19/8/linux-kernel-21st-century
- Information on initrd / initramfs and the GRUB bootloader: from the Further reading notes from the Linux Kernel Programming book's GitHub repository: https://github.com/PacktPublishing/Linux-Kernel-Programming/blob/master/Further_Reading.md#chapter-3-building-the-linux-kernel-from-source---further-reading
- Customizing the GRUB bootloader: How do I add a kernel boot parameter? https://askubuntu.com/questions/19486/how-do-i-add-a-kernel-boot-parameter. Do realize, this tends to be x86_64- and Ubuntu-specific...
- The Ten Commandments for C Programmers, Henry Spencer: https://www.electronicsweekly.com/open-source-engineering/linux/the-ten-commandments-for-c-programmers-2009-04/
- Interesting:
- A MUST-READ book: The Mythical Man-Month, Fred Brooks, 1975
- What is a coder's worst nightmare?, Quora; answer by Mick Stute: https://www.quora.com/What-is-a-coders-worst-nightmare
- Reflections on Trusting Trust, Ken Thompson: https://www.cs.cmu.edu/~rdriley/487/papers/Thompson_1984_ReflectionsonTrustingTrust.pdf