


Most websites we visit every day use maps in order to display information about locations or points of interest to the user. It is amazing how this technology has evolved over the past few decades.
In the early days, with the introduction of the Internet, maps were static images. Users were unable to interact with maps as they were limited to just displaying static information. Interactive maps were available only to mapping professionals, accessed via very expensive GIS software. Cartographers used this type of software to create or improve maps, usually for an agency or an organization. Again, if information about a location was to be made available to the public, there were only two options: static images or a printed version.
Improvements in Internet technologies opened up possibilities for interactive content. It was a natural transition for maps to become live, respond to search queries, and allow user interactions, such as panning and changing the zoom level.
Mobile devices were just beginning to evolve, and a new age of smartphones was about to begin. It was natural for maps to become even more important to consumers. Interactive maps are now in their pockets, and more importantly, they can tell a user's location and display a great variety of data.
In an age in which smartphones and tablets have become aware of location, information has become even more important to companies. Smartphones use this information to improve user experience in everything from general-purpose websites such as Google Maps, to more focused apps such as Foursquare and Facebook. Maps are now a crucial component in the digital world.
The popularity of mapping technologies is increasing over the years. A number of services have become available to developers, from free open source solutions to commercial services for web and mobile developers, and even services specialized for cartographers and visualization professionals.
Currently, developers have the option to choose from a variety of services that will work better for their specific tasks. The best part of all is that if some customers have increased traffic requirements, most of them are offered free plans.
The issue with most of the solutions available is that they look extremely similar. By observing the most commonly used websites and services that implement a map, you can easily confirm that they completely lack personality.
Maps have the same colors and present the same features, such as roads, buildings, and labels. Currently, displaying road addresses on a specific website doesn't make sense. Customizing maps is a tedious task, and that is the main reason that it's avoided. What if the map provided by a web service does not work well with the color theme used in your website or app?
Mapbox is a service provider that allows users to select from a variety of customization options. This is one of the most popular features that set it apart from its competitors. The power to fully customize your map in every detail, including the color theme, features you want to present to the user, information displayed, and much more, is indispensable. Using the tools provided by Mapbox, you can upload and publish your own datasets and integrate them with Mapbox's own data.
Mapbox provides you with the tools to fully write in CartoCSS, the language behind Mapbox's cartographic customization, SDKs, and frameworks, to integrate their maps into your website with minimal effort, along with a lot more tools to assist you in your task and provide your users with a unique experience.
Let's take a look at what Mapbox has to offer. We will begin with the three available datasets.
Mapbox Streets is the core technology behind Mapbox's street data. It's powered by Open Street Maps and has an extremely vibrant community of 1.5 million voluntary cartographers and users, who constantly refine and improve map data in real time.
Note
For more information regarding the Mapbox and Open Street Maps partnership, visit https://www.mapbox.com/guides/osm-and-mapbox/.
For more information regarding Open Street Maps, visit http://www.openstreetmap.org.

Mapbox Terrain is composed of datasets fetched from 24 other datasets owned by 13 organizations. It enables you to access elevation data, hill shades, and topography lines, as shown in the following figure:

Mapbox Satellite offers high-resolution cloudless datasets with satellite imagery, as shown in the following figure:

Mapbox Editor is an online editor with which you can easily create and customize maps. Its purpose is for you to easily customize the map's color theme by choosing from presets or creating your own styles. Additionally, you can add features such as markers and lines, or define areas using polygons. Maps are also multilingual, and currently there are four different languages as options to choose from while working with Mapbox Editor:

While adding data manually in Mapbox Editor is handy, it also offers the ability to batch import data, and it supports the most commonly used formats.
The user interface is strictly visual. No coding skills are needed in order to create, customize, and present a map. It is ideal if you want to quickly create and share maps. It also supports sharing to all major platforms, such as WordPress, and embedding in forums or websites using IFrames.
CartoCSS is a powerful open source-style sheet language developed by Mapbox and widely supported by several other mapping and visualization platforms. It's extremely similar to CSS, and if you have ever used CSS, it will be very easy for you to adapt. Take a look at the following code:
#layer {
   line-color: #C00;
   line-width: 1;
}
#layer::glow {
   line-color: #0AF;
   line-opacity: 0.5;
   line-width: 4;
}
TileMill is a free open source desktop editor that you can use to write CartoCSS and fully customize your maps. This is done by adding layers of data from various sources and then customizing layer properties using CartoCSS, a CSS-like style sheet language. When you complete the editing of the map, you can export the tiles and upload them to your Mapbox account in order to use the map on your website. TileMill was used as the standard solution for this type of work, but it used raster data. This changed with the introduction of Mapbox Studio, which uses vector data:

Mapbox Studio is the new open source toolbox created by the Mapbox team to customize maps, and the plan is to slowly replace TileMill. The advantage is that it uses vector tiles instead of raster. Vector tiles are superior because they hold infinite detail; they are not dependent on the resolution found in a fixed-size image. You can still use CartoCSS to customize the map, and as with TileMill, you can export and share the map to your website at any point:

Accessing Mapbox data using various APIs is also very easy. You can use JavaScript or WebGL, or simply access the data using REST service calls. If you are into mobile development, separate SDKs are offered to develop native apps for iOS and Android that take advantage of the amazing Mapbox technologies and customization while maintaining a native look and feel.
Mapbox allows you to use your own sources. You can import a custom dataset and overlay the data on Mapbox Streets, Terrains, or satellite base maps. Another feature worth noting is that you are not limited to fetching data from various sources, as you can also query the tile metadata.
In this recipe, you will be introduced to the core functionality of Mapbox Editor. In the beginning, we will explore the project management dashboard to create a new project. After this, we will use the interactive color picker provided by Mapbox Editor's user interface to help us style our new map.
The power of Mapbox Editor must not be underestimated. The functionality provided allows us to experiment with color schemes and gives our map a unique personality without writing a single line of code. The controls are simple, but at the same time there are options for sophisticated color mixing, making our task easier than ever.
Even if you advance deeper into the book and learn the secrets of CartoCSS, the powerful styling language that powers TillMill and Mapbox Studio, you will often use Mapbox Editor as a scratchpad to experiment with new ideas and color schemes.
To start working with Mapbox, you need to create a user account. This account is needed when you want to create a new project, use the editor, share data, and access the APIs for development; it is used to get a unique access token that you will use in the future when developing using the APIs.
Mapbox offers a free, non-time-limited plan that suffices for the scope of learning Mapbox as long as you do not have any heavy traffic on your published maps. There are limitations, especially when using Mapbox Studio, but you can start with a free plan and upgrade later when needed.
Head over to www.mapbox.com and click on Sign up in the upper-right corner. Follow the instructions to create a new account. After you have created it, simply sign in and select Projects from the menu:

The first step is to create a new project:
Once you have signed in, you will be transferred to the Projects screen. From here, you can create new projects, edit them, or delete them. You will also see the default API access token at the top of the screen, but we will get to that a bit later:

Click on the Create project button, and you will be transferred to Mapbox Editor, where you can style or import data and save your map.
You can pan simply by dragging the mouse on the map, and zoom using the mouse scroll wheel or the plus and minus buttons in the lower-left corner of the screen. Next to the zoom buttons, there is a handy box showing the current coordinates in latitude and longitude of the region currently on the screen. In the upper-left corner of the screen, you will see your profile picture and several buttons that give you access to the related sections. Next to the profile picture is Style, which is used to select one of the predefined map styles:

You can start customizing your map immediately by selecting one of the available preset styles to get started with a predefined color style. You can select any of the 15 available styles provided by Mapbox.
Note
There was a time when Mapbox allowed us to customize the color theme using Mapbox Editor.
Sadly, this functionality has now been removed, and Mapbox kindly reminds us that we can use Mapbox Studio to customize our maps. Don't worry; in the end, it's much more powerful to do it this way, and we will learn more about it in Chapter 3, TileMill and Mapbox Studio.
Most of the time, you will be presenting a map in order to guide the user to a specific location. You can add a variety of vector data to your map, which can be markers if you want to show a POI (point of interest) to the user; lines, which represent a route from one location to another; and polygons, which can be used if you want to highlight an entire area.
There are a number of things that we can do with vector data in Mapbox. Here are a few of them.
The following steps need to be performed:
Click on Data.
Click on Marker and then click anywhere on the map. A marker will drop. You can adjust the marker's position by dragging it and dropping it at a different location.
Add any title you like on the marker.
For the description, you can use not only plain text, but also the
<img>and<a>tags. Try adding the following code as the description:Here is the location I told you about. Check out the images. More information <a href="http://www.wikipedia.com">here.</a> <img src="http://lorempixel.com/400/200/city/"></img>

Click on the Style tab. You can select a color of your choice for the marker and also its size from three predefined sizes.
Click on the Symbol tab. Here, you can select an icon for your marker. Some personality is never bad!
The last tab is Lat/Lon (Latitude/Longitude). You can type in the exact coordinate if you feel so inclined.
Mapbox Editor gives you the ability to create lines. Routes, for example, are best represented with lines. Perform the following steps:
Click on the Data tab.
Click on Line and start the line by clicking anywhere on the map.
When you move the mouse, you will notice that Mapbox Editor shows you a dashed line; click on the next point of the map.
You can continue clicking and expanding your path as long as you wish. To complete the line, click on the last point again.
After you have completed the line, you can still modify each point by simply selecting a point and dragging it to a different location. If you click between two points, Mapbox Editor will create a new point.
Give your line a title and a description if you wish:

You can further customize the line style by selecting the Stroke option and choosing a color, a line width, and the opacity:

There are times when you need to pinpoint a specific area to the user. While you can somehow archive this to an extent by enclosing the area using lines, there is a better and easier way, which is to use polygons:
Click on the Data tab.
Select Polygon.
Click anywhere in the map to start drawing the polygon.
Continue adding points on the map until you have the area of your choice selected. To complete the polygon, click on the first point again.
You can add a title and description if you wish.
At the Stroke tab, you can select a color, the line width, and the opacity of the outline, as with lines.
You can also select a fill color as well as the opacity of the filled color:

To modify a marker, line, or polygon, perform the following steps:
Simply select the hand tool and the item you want to adjust.
Mapbox Editor displays the properties of the selected objects and you can modify any of them, such as the title, description, or colors.
To delete a marker, line, or polygon, you have to select it with the hand tool and click on the small trash can icon in the lower-right corner.
We have seen how easy it is to add features such as markers, lines, and polygons. However, each time, we have to create them one by one.
This would be tedious if we wanted to create several hundred or even thousands of them. The import feature of Mapbox Editor does exactly this. It allows us to import several well-known file formats, such as GeoJSON, CVS, KML, and GPS. Most GIS software, organizations, and services out there are able to export in one of these formats; they are used widely in the GIS and web-development landscape all over the world.
It's probably a good time to explain what these formats are:
GeoJSON: This is a format created to store vector data, such as points, lines, or polygons. It's based on the JSON specification.
KML: This is used primarily by Google. It stores vector data as GeoJSON, but is based on XML.
CSV: This is a format commonly used in popular applications, such as Excel. It's actually a comma-separated format, and in order to import a CVS file into Mapbox Editor, it requires at least a latitude and longitude column.
Each file can contain multiple layers. By layer, we mean multiple features that are grouped together.
We will import a GeoJSON file that contains earthquake data for the last seven days by performing the following steps:
Start a new project.
Click on Discard Palette to choose a preset style, or style your map from scratch if you prefer.
Ensure that the hand tool is selected. Directly below it, you will see Draw or import .geojson, .cvs, .kml, or .gps files. Click on import.
You will be greeted with the Import features dialog box. The provided GeoJSON file contains many different fields, such as the earthquake's magnitude, time, place, and so on. We can specify which of these fields will be displayed in the title and description. Ensure that Title is selected and select mag (magnitude) as the title field:

Next, select the Description tab and then select the place field as the description.
In the Style tab, select your preferred color and marker size.
In the Symbol tab, select any symbol you prefer.
Click on Finish importing:

The map will zoom out, and the imported features will appear on the map with the fields that we selected as the title and description.
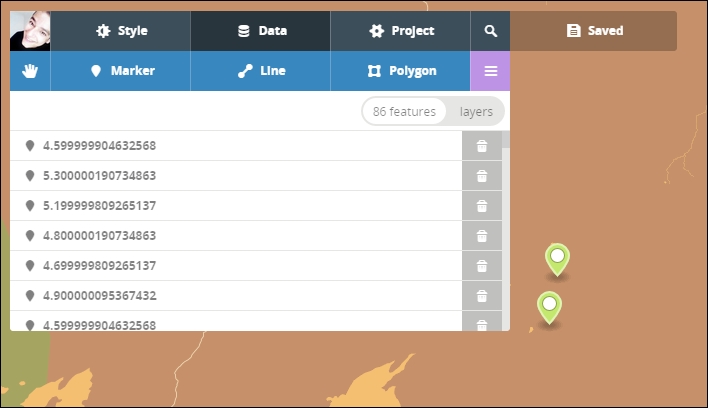
You can access imported data by clicking on the hamburger icon on the data screen next to the polygon button. You will be presented with a list of every feature you imported. This section is composed of two tabs: the first one lists the features, and the other lists the layers. GeoJSON and KML are formats that can contain features grouped into multiple layers:
Clicking on an item in the featured list allows us to edit it. We can change the title, description, color, size, and icon of the feature where available, as different types of feature have different attributes that we can modify.
Clicking on the trash can icon next to an item allows us to delete these specific features.
Now that we have created our own map and added the features we wanted, it's time to show it to the world.
In this recipe, we will learn how to publish our maps.
At this point, we have beautifully styled our map using Mapbox Editor and we have learned how to create data from scratch or import it. Now it's time for the world to see what we have created.
Before publishing your map, it's wise to have an overview of some settings that may be useful:
Under Project | Settings, you can select the name of your project and its description
Under Project | Advanced, you can set and save the current map position
Mapbox Editor offers various options for sharing our map. If you have created markers, lines, or polygons, or imported any data, you will be presented with an option to download them as GeoJSON or KML. You can use these files to overlay the data on a map using JavaScript or other APIs. We will take a look at how to do this in the next few chapters.
In order to share a Mapbox-hosted map, you will need to use the URL provided by Mapbox to directly share your map. Before doing this, however, in order to share it you need to first save the map:
Click on Save.
Copy the clipboard copy icon next to the Share textbox.
The URL will now be copied to the clipboard. Paste the link anywhere you want for the world to see:

Tip
Downloading the example code
You can download the code files by following these steps:
Log in or register to our website using your e-mail address and password.
Hover the mouse pointer on the SUPPORT tab at the top.
Click on Code Downloads & Errata.
Enter the name of the book in the Search box.
Select the book for which you're looking to download the code files.
Choose from the drop-down menu where you purchased this book from.
Click on Code Download.
Once the file is downloaded, please make sure that you unzip or extract the folder using the latest version of:
WinRAR / 7-Zip for Windows
Zipeg / iZip / UnRarX for Mac
7-Zip / PeaZip for Linux
If you have a self-hosted website, the easiest option is to share your map using IFrames. You can also share to Wordpress, Tumblr, Drupal, and other platforms that support IFrames (usually via plugins).
Mapbox Editor already provides the code to embed the map into HTML.
Below the embedded textbox there are checkboxes. These allow us to limit user interaction in the embedded map. For example, you can disable pan and zoom, scroll wheel...., and geocoding, which disables the magnifier icon that allows us to search for addresses and links.
The code generated in the embed tag looks similar to this:
<iframe width='100%' height='500px' frameBorder='0' src='https://a.tiles.mapbox.com/v4/nimrod7.k4adg5mg/attribution,zoompan,zoomwheel,geocoder,share.html?access_token=pk.eyJ1Ijoibmltcm9kNyIsImEiOiJkNkw1WWRnIn0.pnQn9P2nbHyhKf2FY_XJog'></iframe>
Notice the width and height parameters. We can modify these to specify the size that will work best with our design. You can explicitly set the width or height to a specific pixel value or set a percentage.
Notice the frameBorder option. This generates a border around the IFrame to separate the embedded map from the content of the webpage.
For this example, we will use a basic HTML file that contains boilerplate HTML code and some extra elements. We will embed the map into HTML using IFrames.
Note
From this point on, we will need to edit files and write code, usually HTML and JavaScript, and we will need an editor to do so. While a simple plain text editor, such as notepad on Windows and TextEdit on Mac, can do the job, it's highly recommended that you use a specialized application for this purpose, such as Sublime Text, which is available for Windows, Mac, and Linux. It can make our task a lot easier with syntax highlighting.
Before we begin editing HTML, double–click on the chapter-1/example-1-begin/index.html file, and it will open in your default browser. You will see our HTML page, which contains some basic HTML elements such as <h1> and <divs> tags. Embed our map under the <h3>Earthquakes in Iceland:</h3> element through the following steps:
Open the
chapter-1/example-1-begin/index.htmlfile with a text editor.Copy the code contained within the embedded tag.
Adjust the width and height if needed, and add a frame border if you wish.
Directly under
<h3>Our Location</h3>, paste the code we copied before.Save the file.
That's it. We have successfully embedded a map into a custom HTML page using the sharing feature of Mapbox Editor and IFrames. Now, it's time to discuss what we created. We need to open the file in a browser by either dragging the index.html file on a browser or double-clicking on it (this behavior may be overwritten by your HTML editor):